Replacement value cost trends - Risk Engineering
Replacement value cost trends - Risk Engineering
Replacement value cost trends - Risk Engineering

Create successful ePaper yourself
Turn your PDF publications into a flip-book with our unique Google optimized e-Paper software.
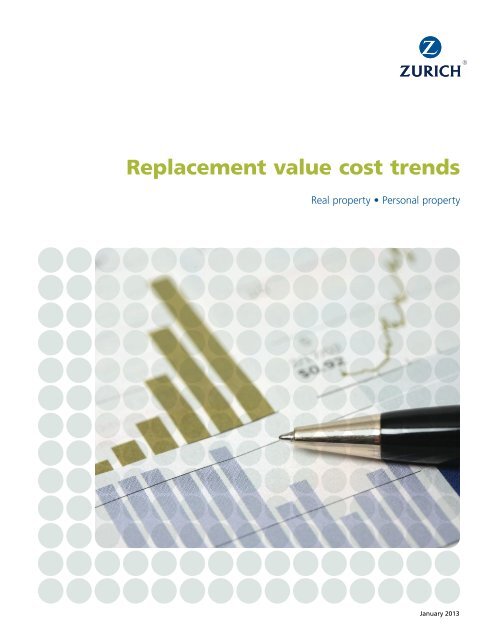
<strong>Replacement</strong> <strong>value</strong> <strong>cost</strong> <strong>trends</strong>Real property • Personal propertyJanuary 2013
Zurich is committed to providing experience and insights to help customersand producers better understand and prepare for the evolving risks theyface over time. This issue of Zurich’s replacement <strong>value</strong> <strong>cost</strong> <strong>trends</strong> providesthe results of the most recent real and personal property inflation surveyconducted by Zurich. The <strong>cost</strong> <strong>trends</strong> are published to assist in maintainingproper levels of insurable replacement <strong>cost</strong>s for commercial and industrialproperties. The <strong>cost</strong> <strong>trends</strong> are issued bi-annually in January and July.January 2013 <strong>cost</strong> <strong>trends</strong> analysisThe current building construction <strong>cost</strong> <strong>trends</strong>show an average <strong>cost</strong> increase of less than 1% forthe six months ending January 2013. This smallchange reflects modest labor <strong>cost</strong> increases andmixed but overall low material <strong>cost</strong> increases asthe worldwide economic slump continues. Theconstruction market has stabilized somewhat andthere are pockets of encouraging constructionactivity. Labor <strong>cost</strong>s are the primary driver in thecurrent inflation rate. Material prices continueto rise and fall back on a regular basis butoverall remain somewhat stable. Constructionunemployment remains high.The personal property <strong>cost</strong> <strong>trends</strong> indicateoverall percentage increases in machinery andequipment <strong>cost</strong>s for the listed plant occupancies.The most recent survey of machinery andequipment <strong>cost</strong>s showed <strong>cost</strong>s remained flat forthe last 6-month period. It is anticipated the rateof increase will be about the same over the nextsix-month period.Real propertyInflation multipliers are provided for all 50states, Puerto Rico and eight Canadianprovinces. In all, <strong>cost</strong> <strong>trends</strong> are included for184 cities. Prior to 2007, the <strong>cost</strong> <strong>trends</strong> areavailable on a regional basis.To determine the current replacement <strong>cost</strong> ofa building, select the closest city from Zurich’sreplacement <strong>value</strong> <strong>cost</strong> <strong>trends</strong>. Find the dateacross the top of the page that corresponds tothe last time the existing <strong>value</strong>s were updated.Scroll down the page to the closest city and notethe multiplier. Multiply the factor provided by theexisting estimated replacement <strong>cost</strong> to arrive atthe current estimated replacement <strong>cost</strong>.Personal propertyThe personal property <strong>cost</strong> <strong>trends</strong> are calculatedby use of a weighted index and include aninstallation factor.For personal property, choose the occupancy andscroll down the page to the date closest to whenthe existing <strong>value</strong>s were updated or establishedand note the multiplier. Then apply theappropriate multiplier to the existing personalproperty <strong>value</strong>s to approximate the currentreplacement <strong>cost</strong>.Cost <strong>trends</strong> are also available in pdf format on www.zurichna.com
Real property replacement <strong>value</strong> <strong>cost</strong> <strong>trends</strong>January 2013UNITED STATESJan, 13 July, 12 Jan, 12 July, 11 Jan, 11 July, 10 Jan, 10 July, 09 Jan, 09 July, 08US national average 1.000 1.009 1.025 1.036 1.059 1.084 1.097 1.073 1.067 1.121State/CityALABAMA 1.000 1.012 1.017 1.032 1.051 1.072 1.080 1.049 1.038 1.101Birmingham 1.000 1.012 1.015 1.029 1.050 1.068 1.075 1.051 1.042 1.107Huntsville 1.000 1.012 1.015 1.030 1.052 1.070 1.077 1.049 1.038 1.098Mobile 1.000 1.012 1.023 1.037 1.047 1.076 1.088 1.048 1.035 1.098Montgomery 1.000 1.013 1.016 1.031 1.053 1.071 1.078 1.050 1.038 1.099ALASKA 1.000 1.005 1.026 1.035 1.053 1.082 1.106 1.069 1.063 1.117Anchorage 1.000 1.005 1.025 1.035 1.052 1.084 1.108 1.072 1.066 1.120Fairbanks 1.000 1.006 1.026 1.035 1.054 1.082 1.106 1.069 1.063 1.117Juneau 1.000 1.005 1.025 1.034 1.052 1.080 1.104 1.066 1.060 1.1161.000 1.011 1.023 1.014 1.007 1.066 1.069 1.104 1.106 1.156ARIZONA 1.000 1.009 1.023 1.031 1.056 1.076 1.090 1.067 1.053 1.087Flagstaff 1.000 1.008 1.024 1.036 1.065 1.093 1.108 1.097 1.090 1.154Phoenix 1.000 1.008 1.022 1.033 1.058 1.078 1.091 1.066 1.053 1.088Tucson 1.000 1.010 1.025 1.033 1.057 1.075 1.088 1.066 1.053 1.086ARKANSAS 1.000 1.014 1.024 1.042 1.057 1.073 1.098 1.074 1.067 1.123Fort Smith 1.000 1.014 1.024 1.042 1.057 1.073 1.098 1.082 1.076 1.132Little Rock 1.000 1.014 1.024 1.042 1.057 1.073 1.098 1.063 1.057 1.112CALIFORNIA 1.000 1.007 1.028 1.037 1.058 1.094 1.093 1.072 1.068 1.120Fresno 1.000 1.008 1.026 1.037 1.064 1.087 1.104 1.090 1.087 1.139Los Angeles 1.000 1.010 1.029 1.036 1.058 1.085 1.082 1.049 1.048 1.109Redding 1.000 1.013 1.030 1.042 1.062 1.092 1.102 1.093 1.084 1.137Sacramento 1.000 1.010 1.026 1.041 1.064 1.098 1.108 1.089 1.081 1.135San Diego 1.000 1.011 1.030 1.038 1.053 1.083 1.086 1.059 1.057 1.113San Francisco 1.000 1.007 1.029 1.044 1.061 1.125 1.108 1.092 1.085 1.127San Jose 1.000 1.004 1.028 1.044 1.059 1.125 1.112 1.093 1.086 1.129COLORADO 1.000 1.005 1.024 1.033 1.054 1.087 1.091 1.073 1.064 1.123Colorado Springs 1.000 1.005 1.024 1.034 1.054 1.080 1.082 1.059 1.053 1.113Denver 1.000 1.005 1.024 1.034 1.055 1.082 1.084 1.055 1.049 1.110Fort Collins 1.000 1.005 1.024 1.034 1.055 1.088 1.090 1.064 1.057 1.118Grand Junction 1.000 1.007 1.025 1.030 1.054 1.091 1.104 1.095 1.083 1.130CONNECTICUT 1.000 1.007 1.025 1.038 1.057 1.093 1.101 1.083 1.076 1.132Bridgeport 1.000 1.009 1.019 1.032 1.052 1.087 1.092 1.076 1.069 1.114Hartford 1.000 1.006 1.029 1.044 1.062 1.099 1.109 1.089 1.083 1.144New Haven 1.000 1.006 1.028 1.042 1.060 1.097 1.105 1.087 1.082 1.143Stamford 1.000 1.009 1.019 1.032 1.051 1.089 1.092 1.076 1.070 1.119Waterbury 1.000 1.006 1.028 1.041 1.060 1.097 1.106 1.086 1.080 1.142D.C. WASHINGTON 1.000 1.007 1.028 1.036 1.061 1.093 1.099 1.077 1.076 1.128Washington 1.000 1.007 1.028 1.036 1.061 1.093 1.099 1.077 1.076 1.128DELAWARE 1.000 1.010 1.029 1.033 1.054 1.091 1.103 1.081 1.073 1.118Wilmington/Dover 1.000 1.010 1.029 1.033 1.054 1.091 1.103 1.081 1.073 1.118
Real property replacement <strong>value</strong> <strong>cost</strong> <strong>trends</strong>Jan, 13 July, 12 Jan, 12 July, 11 Jan, 11 July, 10 Jan, 10 July, 09 Jan, 09 July, 08UNITED STATESUS national average 1.000 1.009 1.025 1.036 1.059 1.084 1.097 1.073 1.067 1.121State/CityFLORIDA 1.000 1.009 1.028 1.033 1.057 1.089 1.081 1.041 1.040 1.095Jacksonville 1.000 1.007 1.023 1.028 1.057 1.091 1.079 1.049 1.051 1.100Miami 1.000 1.009 1.032 1.037 1.057 1.084 1.091 1.044 1.047 1.121Orlando 1.000 1.011 1.033 1.039 1.056 1.088 1.075 1.031 1.025 1.079Pensacola 1.000 1.007 1.025 1.029 1.059 1.094 1.087 1.053 1.056 1.106Tallahassee 1.000 1.009 1.026 1.031 1.059 1.093 1.081 1.034 1.036 1.086Tampa/St. Petersburg 1.000 1.011 1.033 1.039 1.060 1.093 1.085 1.049 1.046 1.102GEORGIA 1.000 1.008 1.029 1.033 1.056 1.089 1.093 1.055 1.055 1.104Atlanta 1.000 1.007 1.029 1.035 1.053 1.086 1.091 1.066 1.060 1.095Augusta 1.000 1.008 1.025 1.030 1.056 1.089 1.092 1.042 1.039 1.101Columbus 1.000 1.007 1.029 1.035 1.052 1.086 1.090 1.065 1.063 1.095Macon 1.000 1.007 1.030 1.035 1.053 1.086 1.090 1.066 1.062 1.096Savannah 1.000 1.009 1.030 1.035 1.062 1.095 1.098 1.045 1.038 1.102Valdosta 1.000 1.009 1.027 1.031 1.059 1.093 1.095 1.046 1.068 1.136HAWAII 1.000 1.009 1.030 1.043 1.066 1.082 1.101 1.075 1.080 1.125Honolulu 1.000 1.009 1.030 1.043 1.066 1.082 1.101 1.075 1.080 1.125IDAHO 1.000 1.011 1.029 1.041 1.058 1.084 1.089 1.064 1.056 1.114Boise 1.000 1.010 1.030 1.042 1.059 1.084 1.089 1.064 1.056 1.113Lewiston 1.000 1.011 1.029 1.039 1.054 1.084 1.090 1.063 1.059 1.115Pocatello 1.000 1.010 1.029 1.040 1.058 1.082 1.088 1.063 1.055 1.115ILLINOIS 1.000 1.017 1.027 1.042 1.068 1.090 1.103 1.087 1.096 1.152Chicago 1.000 1.010 1.024 1.040 1.054 1.087 1.096 1.085 1.086 1.147Peoria 1.000 1.020 1.027 1.042 1.071 1.084 1.098 1.080 1.089 1.146Rockford 1.000 1.017 1.029 1.041 1.064 1.092 1.102 1.092 1.107 1.163INDIANA 1.000 1.011 1.022 1.036 1.062 1.085 1.093 1.075 1.075 1.125Evansville 1.000 1.013 1.030 1.044 1.077 1.095 1.097 1.072 1.068 1.125Fort Wayne 1.000 1.013 1.029 1.043 1.075 1.094 1.095 1.069 1.068 1.120Gary 1.000 1.014 1.027 1.042 1.064 1.097 1.105 1.085 1.090 1.147Indianapolis 1.000 1.010 1.014 1.028 1.050 1.078 1.091 1.068 1.065 1.112South Bend 1.000 1.007 1.022 1.036 1.064 1.080 1.083 1.079 1.069 1.120Terre Haute 1.000 1.011 1.029 1.043 1.075 1.091 1.094 1.070 1.068 1.126IOWA 1.000 1.006 1.013 1.024 1.046 1.062 1.073 1.075 1.067 1.116Cedar Rapids 1.000 1.006 1.012 1.023 1.045 1.061 1.074 1.067 1.061 1.106Des Moines 1.000 1.004 1.011 1.022 1.046 1.060 1.064 1.075 1.065 1.122Dubuque 1.000 1.007 1.012 1.023 1.045 1.060 1.075 1.070 1.064 1.109Sioux City 1.000 1.004 1.011 1.022 1.048 1.064 1.067 1.061 1.052 1.105KANSAS 1.000 1.011 1.019 1.033 1.054 1.077 1.086 1.074 1.066 1.125Kansas City 1.000 1.009 1.019 1.034 1.060 1.083 1.096 1.074 1.068 1.132Topeka 1.000 1.010 1.020 1.037 1.064 1.082 1.096 1.077 1.068 1.126Wichita 1.000 1.012 1.021 1.033 1.049 1.075 1.081 1.064 1.056 1.115KENTUCKY 1.000 1.009 1.024 1.041 1.065 1.082 1.092 1.065 1.065 1.110Bowling Green 1.000 1.009 1.026 1.043 1.071 1.088 1.098 1.073 1.072 1.115Lexington 1.000 1.008 1.022 1.039 1.058 1.075 1.085 1.057 1.055 1.099Louisville 1.000 1.008 1.022 1.041 1.066 1.083 1.095 1.069 1.068 1.117LOUISIANA 1.000 1.005 1.014 1.034 1.055 1.076 1.084 1.054 1.043 1.117Alexandria 1.000 1.006 1.016 1.039 1.060 1.075 1.091 1.058 1.046 1.118Baton Rouge 1.000 1.002 1.011 1.032 1.051 1.079 1.079 1.049 1.037 1.113New Orleans 1.000 1.004 1.013 1.031 1.051 1.074 1.076 1.048 1.037 1.112Shreveport 1.000 1.006 1.017 1.038 1.058 1.073 1.088 1.055 1.046 1.122
Real property replacement <strong>value</strong> <strong>cost</strong> <strong>trends</strong>Jan, 13 July, 12 Jan, 12 July, 11 Jan, 11 July, 10 Jan, 10 July, 09 Jan, 09 July, 08UNITED STATESUS national average 1.000 1.009 1.025 1.036 1.059 1.084 1.097 1.073 1.067 1.121State/CityMAINE 1.000 1.007 1.028 1.067 1.090 1.121 1.148 1.132 1.135 1.199Bangor 1.000 1.004 1.027 1.035 1.056 1.081 1.100 1.094 1.093 1.155Portland 1.000 1.009 1.029 1.038 1.062 1.099 1.134 1.110 1.112 1.172MARYLAND 1.000 1.003 1.022 1.027 1.056 1.098 1.104 1.064 1.055 1.100Baltimore 1.000 1.003 1.020 1.025 1.055 1.096 1.101 1.061 1.053 1.096Hagerstown 1.000 1.002 1.023 1.028 1.058 1.100 1.106 1.067 1.058 1.103MASSACHUSETTS 1.000 1.008 1.024 1.035 1.061 1.089 1.106 1.093 1.089 1.152Boston 1.000 1.008 1.027 1.037 1.066 1.092 1.106 1.090 1.087 1.148Hyannis 1.000 1.008 1.022 1.033 1.061 1.089 1.103 1.094 1.087 1.149Lowell 1.000 1.008 1.023 1.033 1.061 1.089 1.103 1.092 1.085 1.148New Bedford 1.000 1.008 1.023 1.033 1.061 1.089 1.103 1.093 1.085 1.148Pittsfield 1.000 1.009 1.027 1.039 1.061 1.088 1.109 1.091 1.092 1.158Springfield 1.000 1.009 1.027 1.036 1.058 1.084 1.109 1.091 1.093 1.157MICHIGAN 1.000 1.012 1.030 1.044 1.067 1.077 1.088 1.067 1.070 1.122Detroit 1.000 1.011 1.030 1.046 1.068 1.076 1.087 1.063 1.062 1.110Grand Rapids 1.000 1.013 1.030 1.043 1.071 1.081 1.093 1.076 1.089 1.157Kalamazzo 1.000 1.013 1.029 1.042 1.064 1.079 1.091 1.069 1.068 1.119Lansing 1.000 1.014 1.032 1.045 1.067 1.075 1.085 1.063 1.067 1.123MINNESOTA 1.000 1.003 1.016 1.024 1.044 1.060 1.075 1.064 1.075 1.120Duluth 1.000 1.006 1.015 1.023 1.046 1.063 1.082 1.059 1.066 1.112Minneapolis/St. Paul 1.000 1.002 1.016 1.025 1.044 1.058 1.073 1.065 1.072 1.116Rochester 1.000 1.003 1.016 1.024 1.044 1.060 1.075 1.069 1.077 1.124MISSISSIPPI 1.000 1.006 1.018 1.033 1.059 1.081 1.091 1.059 1.046 1.104Biloxi 1.000 1.005 1.012 1.030 1.052 1.078 1.079 1.045 1.036 1.102Meridian 1.000 1.005 1.018 1.032 1.061 1.080 1.093 1.063 1.050 1.105MISSOURI 1.000 1.011 1.022 1.038 1.064 1.085 1.099 1.086 1.082 1.130Columbia 1.000 1.011 1.023 1.040 1.066 1.094 1.107 1.095 1.094 1.135Kansas City 1.000 1.009 1.021 1.038 1.063 1.080 1.097 1.073 1.076 1.126Springfield 1.000 1.011 1.021 1.039 1.066 1.084 1.099 1.085 1.079 1.140St. Louis 1.000 1.013 1.028 1.040 1.065 1.084 1.098 1.082 1.077 1.118MONTANA 1.000 1.005 1.028 1.036 1.060 1.074 1.103 1.081 1.076 1.136Billings 1.000 1.008 1.030 1.042 1.066 1.083 1.101 1.085 1.076 1.131Great Falls 1.000 1.004 1.025 1.031 1.056 1.069 1.102 1.083 1.079 1.138Missoula 1.000 1.004 1.030 1.037 1.062 1.075 1.104 1.079 1.078 1.143NEBRASKA 1.000 1.011 1.022 1.034 1.049 1.072 1.086 1.070 1.058 1.106Lincoln 1.000 1.012 1.023 1.035 1.051 1.073 1.087 1.068 1.055 1.105North Platte 1.000 1.011 1.020 1.031 1.047 1.067 1.081 1.063 1.051 1.097Omaha 1.000 1.011 1.024 1.036 1.051 1.075 1.089 1.081 1.068 1.120NEVADA 1.000 1.012 1.029 1.038 1.057 1.079 1.100 1.075 1.066 1.126Las Vegas 1.000 1.011 1.029 1.033 1.052 1.070 1.079 1.064 1.060 1.124Reno 1.000 1.012 1.029 1.039 1.058 1.084 1.109 1.080 1.068 1.126NEW HAMPSHIRE 1.000 1.005 1.027 1.033 1.045 1.074 1.100 1.070 1.066 1.131Manchester 1.000 1.005 1.028 1.034 1.045 1.074 1.099 1.069 1.065 1.129Portsmouth 1.000 1.005 1.027 1.033 1.045 1.075 1.101 1.071 1.067 1.135NEW JERSEY 1.000 1.006 1.024 1.035 1.061 1.091 1.100 1.091 1.085 1.135Newark 1.000 1.007 1.023 1.034 1.063 1.095 1.097 1.082 1.074 1.121Trenton 1.000 1.006 1.027 1.035 1.058 1.091 1.107 1.098 1.096 1.149
Real property replacement <strong>value</strong> <strong>cost</strong> <strong>trends</strong>Jan, 13 July, 12 Jan, 12 July, 11 Jan, 11 July, 10 Jan, 10 July, 09 Jan, 09 July, 08UNITED STATESUS national average 1.000 1.009 1.025 1.036 1.059 1.084 1.097 1.073 1.067 1.121State/CityNEW MEXICO 1.000 1.010 1.028 1.038 1.061 1.090 1.095 1.063 1.051 1.101Albuquerque 1.000 1.010 1.030 1.039 1.050 1.073 1.082 1.040 1.034 1.101Las Cruces 1.000 1.010 1.027 1.037 1.063 1.097 1.102 1.076 1.062 1.108Santa Fe 1.000 1.011 1.030 1.040 1.065 1.094 1.099 1.062 1.049 1.098NEW YORK 1.000 1.007 1.027 1.034 1.056 1.089 1.104 1.082 1.075 1.123Albany 1.000 1.010 1.027 1.033 1.061 1.091 1.104 1.080 1.072 1.134Buffalo 1.000 1.004 1.021 1.029 1.052 1.086 1.095 1.076 1.070 1.124New York City 1.000 1.007 1.026 1.037 1.053 1.087 1.102 1.083 1.080 1.110Rochester 1.000 1.006 1.029 1.036 1.056 1.087 1.106 1.085 1.078 1.128Syracuse 1.000 1.008 1.026 1.034 1.056 1.093 1.114 1.091 1.083 1.131White Plains 1.000 1.005 1.026 1.030 1.047 1.079 1.094 1.069 1.065 1.104NORTH CAROLINA 1.000 1.003 1.023 1.031 1.059 1.090 1.099 1.052 1.042 1.087Ashville 1.000 1.007 1.027 1.035 1.061 1.091 1.096 1.056 1.040 1.084Charlotte 1.000 1.007 1.027 1.035 1.060 1.089 1.095 1.052 1.036 1.081Durham 1.000 1.002 1.022 1.029 1.058 1.089 1.099 1.050 1.041 1.085Raleigh 1.000 1.001 1.021 1.029 1.057 1.087 1.098 1.046 1.039 1.086Winston-Salem 1.000 1.002 1.022 1.029 1.057 1.088 1.098 1.049 1.041 1.085NORTH DAKOTA 1.000 1.008 1.022 1.038 1.062 1.079 1.099 1.073 1.061 1.126Bismark 1.000 1.007 1.022 1.038 1.061 1.081 1.100 1.071 1.059 1.125Fargo 1.000 1.008 1.022 1.038 1.061 1.081 1.099 1.077 1.065 1.131Grand Forks 1.000 1.008 1.019 1.035 1.061 1.074 1.094 1.061 1.049 1.113OHIO 1.000 1.009 1.024 1.036 1.064 1.081 1.104 1.076 1.070 1.114Cincinnati 1.000 1.007 1.019 1.034 1.059 1.080 1.099 1.064 1.055 1.086Cleveland 1.000 1.014 1.030 1.040 1.063 1.080 1.105 1.078 1.071 1.120Columbus 1.000 1.011 1.024 1.042 1.073 1.088 1.108 1.088 1.088 1.137Dayton 1.000 1.007 1.017 1.032 1.052 1.075 1.094 1.058 1.070 1.076Toledo 1.000 1.007 1.024 1.032 1.065 1.082 1.107 1.078 1.070 1.119OKLAHOMA 1.000 1.008 1.020 1.033 1.056 1.071 1.076 1.045 1.041 1.095Oklahoma City 1.000 1.009 1.021 1.033 1.055 1.070 1.075 1.057 1.050 1.099Tulsa 1.000 1.009 1.020 1.034 1.057 1.070 1.077 1.055 1.051 1.092OREGON 1.000 1.007 1.027 1.031 1.057 1.076 1.080 1.072 1.066 1.113Eugene 1.000 1.006 1.027 1.029 1.057 1.074 1.076 1.074 1.069 1.113Medford 1.000 1.009 1.029 1.036 1.057 1.083 1.090 1.068 1.062 1.113Portland 1.000 1.005 1.024 1.027 1.055 1.072 1.075 1.070 1.064 1.109PENNSYLVANIA 1.000 1.007 1.030 1.040 1.065 1.101 1.117 1.098 1.098 1.150Harrisburg 1.000 1.009 1.032 1.043 1.069 1.109 1.124 1.102 1.099 1.151Philadelphia 1.000 1.008 1.028 1.038 1.057 1.089 1.095 1.081 1.079 1.128Pittsburgh 1.000 1.006 1.027 1.040 1.066 1.102 1.134 1.112 1.116 1.177Scranton 1.000 1.006 1.029 1.038 1.063 1.101 1.114 1.095 1.102 1.152PUERTO RICO 1.000 1.020 1.020 1.036 1.062 1.063 1.074 1.087 1.069 1.113San Juan 1.000 1.020 1.020 1.036 1.062 1.063 1.074 1.087 1.069 1.113RHODE ISLAND 1.000 1.008 1.027 1.036 1.057 1.082 1.096 1.080 1.069 1.137Providence 1.000 1.008 1.027 1.036 1.057 1.082 1.096 1.080 1.069 1.137SOUTH CAROLINA 1.000 1.006 1.025 1.030 1.055 1.082 1.096 1.058 1.047 1.088Charleston 1.000 1.008 1.028 1.032 1.053 1.084 1.103 1.065 1.056 1.106Columbia 1.000 1.005 1.025 1.029 1.055 1.081 1.093 1.054 1.043 1.083Greenville 1.000 1.006 1.024 1.029 1.056 1.082 1.094 1.057 1.046 1.083
Real property replacement <strong>value</strong> <strong>cost</strong> <strong>trends</strong>UNITED STATESJan, 13 July, 12 Jan, 12 July, 11 Jan, 11 July, 10 Jan, 10 July, 09 Jan, 09 July, 08US national average 1.000 1.009 1.025 1.036 1.059 1.084 1.097 1.073 1.067 1.121State/CitySOUTH DAKOTA 1.000 1.008 1.020 1.036 1.061 1.071 1.082 1.060 1.049 1.114Aberdeen 1.000 1.007 1.018 1.034 1.057 1.064 1.074 1.055 1.044 1.109Rapid City 1.000 1.010 1.018 1.035 1.068 1.086 1.098 1.066 1.055 1.117TENNESSEE 1.000 1.011 1.027 1.040 1.068 1.079 1.091 1.058 1.060 1.115Chattanooga 1.000 1.009 1.025 1.038 1.065 1.071 1.081 1.049 1.074 1.129Knoxville 1.000 1.009 1.026 1.040 1.068 1.074 1.084 1.052 1.063 1.115Memphis 1.000 1.014 1.030 1.043 1.073 1.093 1.101 1.064 1.051 1.110Nashville 1.000 1.011 1.030 1.043 1.068 1.074 1.081 1.052 1.041 1.101TEXAS 1.000 1.010 1.026 1.041 1.064 1.083 1.098 1.061 1.058 1.120Austin 1.000 1.014 1.022 1.042 1.068 1.088 1.091 1.043 1.035 1.098Dallas/Fort Worth 1.000 1.009 1.027 1.042 1.055 1.076 1.095 1.060 1.057 1.116El Paso 1.000 1.010 1.022 1.036 1.058 1.070 1.095 1.071 1.077 1.139Houston 1.000 1.008 1.029 1.039 1.063 1.085 1.091 1.042 1.038 1.101Lubbock 1.000 1.007 1.023 1.036 1.070 1.089 1.118 1.100 1.093 1.154San Antonio 1.000 1.014 1.026 1.044 1.071 1.097 1.102 1.052 1.040 1.105San AntonioUTAH 1.000 1.011 1.030 1.041 1.067 1.088 1.103 1.073 1.063 1.121Salt Lake City 1.000 1.011 1.030 1.041 1.067 1.088 1.101 1.069 1.058 1.117VERMONT 1.000 1.005 1.025 1.032 1.063 1.095 1.103 1.081 1.075 1.129Burlington 1.000 1.005 1.025 1.032 1.062 1.094 1.103 1.081 1.075 1.129Rutland 1.000 1.005 1.025 1.033 1.064 1.096 1.103 1.082 1.076 1.130VIRGINIA 1.000 1.006 1.031 1.040 1.065 1.097 1.104 1.076 1.069 1.124Arlington 1.000 1.006 1.029 1.035 1.061 1.094 1.102 1.079 1.075 1.132Norfolk 1.000 1.003 1.032 1.041 1.062 1.095 1.095 1.072 1.066 1.127Richmond 1.000 1.009 1.029 1.039 1.067 1.099 1.115 1.071 1.057 1.111Roanoke 1.000 1.009 1.029 1.039 1.068 1.098 1.116 1.073 1.060 1.113WASHINGTON 1.000 1.008 1.020 1.030 1.048 1.072 1.092 1.075 1.069 1.121Seattle 1.000 1.001 1.017 1.028 1.047 1.078 1.093 1.076 1.078 1.137Spokane 1.000 1.014 1.018 1.026 1.044 1.066 1.090 1.066 1.061 1.106Yakima 1.000 1.013 1.021 1.030 1.050 1.065 1.087 1.080 1.074 1.120WEST VIRGINIA 1.000 1.009 1.028 1.037 1.065 1.095 1.109 1.089 1.082 1.136Charleston 1.000 1.009 1.028 1.037 1.065 1.095 1.109 1.089 1.082 1.136Wheeling 1.000 1.009 1.028 1.037 1.065 1.094 1.110 1.089 1.082 1.136WISCONSIN 1.000 1.011 1.024 1.035 1.061 1.070 1.106 1.080 1.076 1.129Green Bay 1.000 1.011 1.028 1.037 1.064 1.071 1.111 1.084 1.081 1.134La Crosse 1.000 1.012 1.024 1.034 1.061 1.068 1.111 1.084 1.080 1.132Madison 1.000 1.011 1.024 1.036 1.060 1.069 1.103 1.075 1.070 1.127Milwaukee 1.000 1.013 1.025 1.035 1.062 1.077 1.097 1.079 1.075 1.128WYOMING 1.000 1.021 1.039 1.050 1.074 1.093 1.119 1.094 1.083 1.128Casper 1.000 1.013 1.031 1.041 1.068 1.086 1.103 1.085 1.068 1.092Cheyenne 1.000 1.012 1.032 1.043 1.066 1.086 1.114 1.083 1.076 1.131
Real property replacement <strong>value</strong> <strong>cost</strong> <strong>trends</strong>CANADAJan, 13 July, 12 Jan, 12 July, 11 Jan, 11 July, 10 Jan, 10 July, 09 Jan, 09 Jul, 08Canadian national average 1.00 1.01 1.02 1.03 1.05 1.10 1.11 1.10 1.10 1.16Province/CityALBERTA 1.000 1.009 1.026 1.037 1.049 1.094 1.110 1.091 1.092 1.161Calgary 1.000 1.006 1.021 1.031 1.039 1.086 1.093 1.074 1.074 1.157Edmonton 1.000 1.012 1.030 1.042 1.059 1.102 1.128 1.109 1.111 1.164BRITISH COLUMBIA 1.000 1.008 1.013 1.028 1.062 1.110 1.121 1.104 1.102 1.147Vancouver 1.000 1.008 1.013 1.028 1.062 1.110 1.121 1.104 1.102 1.147MANITOBA 1.000 1.002 1.025 1.036 1.054 1.080 1.086 1.055 1.042 1.111Winnipeg 1.000 1.002 1.025 1.036 1.054 1.080 1.086 1.055 1.042 1.111San AntonioNEWFOUNDLAND 1.000 1.022 1.042 1.050 1.069 1.127 1.153 1.139 1.128 1.174St. Johns 1.000 1.022 1.042 1.050 1.069 1.127 1.153 1.139 1.128 1.174NOVA SCOTIA 1.000 1.016 1.036 1.040 1.075 1.122 1.143 1.127 1.111 1.145Halifax 1.000 1.016 1.036 1.040 1.075 1.122 1.143 1.127 1.111 1.145ONTARIO 1.000 1.023 1.039 1.058 1.076 1.105 1.120 1.101 1.097 1.145Ottawa 1.000 1.024 1.042 1.055 1.077 1.098 1.115 1.094 1.087 1.142Toronto 1.000 1.021 1.037 1.051 1.070 1.097 1.113 1.093 1.087 1.142Windsor 1.000 1.023 1.043 1.111 1.104 1.136 1.134 1.120 1.122 1.148QUEBEC 1.000 1.010 1.036 1.042 1.075 1.116 1.125 1.103 1.093 1.135Montreal 1.000 1.013 1.041 1.046 1.081 1.124 1.137 1.120 1.106 1.153Quebec 1.000 1.014 1.034 1.041 1.072 1.096 1.099 1.066 1.066 1.103SASKATCHEWAN 1.000 1.020 1.034 1.048 1.070 1.143 1.169 1.146 1.141 1.194Regina 1.000 1.024 1.037 1.056 1.080 1.153 1.180 1.153 1.143 1.207Saskatoon 1.000 1.016 1.031 1.040 1.060 1.133 1.158 1.140 1.139 1.181UNITED STATES BY REGIONYearEasternStatesCentralStatesSouthernStatesWesternStatesYearEasternStatesCentralStatesSouthernStatesWesternStatesYearEasternStatesCentralStatesSouthernStatesJan, 08 1.136 1.123 1.108 1.117 Jan, 89 2.243 2.113 2.277 2.108 Jan, 69 8.157 8.102 9.045 8.472July, 07 1.146 1.135 1.121 1.129 Jan, 88 2.310 2.161 2.336 2.179 Jan, 68 8.588 8.628 9.427 8.820Jan, 07 1.169 1.163 1.144 1.153 Jan, 87 2.344 2.182 2.382 2.213 Jan, 67 9.068 8.685 9.631 8.943July, 06 1.178 1.175 1.155 1.165 Jan, 86 2.374 2.245 2.421 2.267 Jan, 66 9.419 8.918 9.700 9.005Jan, 06 1.238 1.222 1.215 1.215 Jan, 85 2.462 2.335 2.526 2.337 Jan, 65 9.733 9.101 9.843 9.198Jan, 05 1.278 1.258 1.267 1.261 Jan, 84 2.522 2.399 2.625 2.394 Jan, 64 10.069 9.358 9.916 9.400Jan, 04 1.344 1.321 1.340 1.326 Jan, 83 2.659 2.536 2.760 2.515 Jan, 63 10.355 9.629 10.141 9.610Jan, 03 1.474 1.450 1.487 1.452 Jan, 82 2.874 2.757 3.008 2.705 Jan, 62 10.815 9.843 10.377 9.830WesternStatesJan, 02 1.520 1.484 1.635 1.481 Jan, 81 3.160 3.020 3.233 2.914 Jan, 61 11.231 10.143 10.624 10.140Jan, 01 1.568 1.529 1.668 1.524 Jan, 80 3.501 3.314 3.523 3.195 Jan, 60 11.587 10.381 10.709 10.385Jan, 00 1.619 1.569 1.712 1.548 Jan, 79 3.904 3.553 3.869 3.462 Jan, 59 11.967 10.630 11.063 10.643Jan, 99 1.678 1.618 1.764 1.588 Jan, 78 4.244 3.874 4.210 3.799 Jan, 58 12.269 10.892 11.249 10.913Jan, 98 1.736 1.676 1.816 1.643 Jan, 77 4.665 4.192 4.632 4.141 Jan, 57 12.373 11.357 11.540 11.296Jan, 97 1.796 1.723 1.854 1.675 Jan, 76 5.123 4.712 5.129 4.666 Jan, 56 12.807 11.656 11.952 11.602Jan, 96 1.862 1.796 1.929 1.729 Jan, 75 5.407 4.977 5.376 4.991 Jan, 55 13.273 11.864 12.281 11.814Jan, 95 1.949 1.872 2.034 1.829 Jan, 74 5.726 5.336 5.795 5.343 Jan, 54 13.519 12.303 12.629 12.149Jan, 94 2.031 1.943 2.082 1.877 Jan, 73 6.135 5.854 6.405 5.853 Jan, 53 13.774 12.536 12.872 12.382Jan, 93 2.095 1.977 2.135 1.931 Jan, 72 6.667 6.814 7.437 6.961 Jan, 52 14.039 12.777 12.934 12.444Jan, 92 2.153 2.041 2.187 1.978 Jan, 71 7.019 7.261 7.874 7.444 Jan, 51 14.175 12.901 13.066 12.569Jan, 91 2.169 2.063 2.209 2.025 Jan, 70 7.487 7.863 8.581 8.099Jan, 90 2.212 2.089 2.246 2.060
Personal property replacement <strong>value</strong> <strong>cost</strong> <strong>trends</strong>January 2013YearAvgCanning& FoodIndustryMachineShopOfficePaperMfgPlasticsPrintingSheetMetalFabTextileRubberWoodWorkingJan-13 1.00 1.00 1.00 1.00 1.00 1.00 1.00 1.00 1.00 1.00 1.00 1.00Jul-12 1.01 1.01 1.01 1.00 1.01 1.00 1.00 1.01 1.00 1.00 1.01 1.01Jan-12 1.01 1.03 1.02 1.01 1.01 1.01 1.01 1.02 1.01 1.01 1.02 1.02Jul-11 1.03 1.04 1.03 1.02 1.03 1.03 1.03 1.03 1.02 1.02 1.04 1.04Jan-11 1.05 1.06 1.05 1.04 1.04 1.04 1.05 1.05 1.04 1.04 1.05 1.05Jul-10 1.05 1.07 1.06 1.04 1.05 1.04 1.05 1.05 1.04 1.04 1.06 1.06Jan-10 1.05 1.08 1.07 1.04 1.05 1.04 1.04 1.06 1.04 1.05 1.06 1.06Jul-09 1.04 1.08 1.05 1.02 1.05 1.02 1.03 1.04 1.03 1.04 1.04 1.05Jan-09 1.04 1.08 1.06 1.02 1.05 1.03 1.03 1.05 1.03 1.04 1.04 1.05Jul-08 1.07 1.11 1.09 1.03 1.08 1.07 1.06 1.09 1.06 1.07 1.08 1.07Jan-08 1.08 1.13 1.10 1.05 1.08 1.08 1.06 1.10 1.07 1.07 1.09 1.08Jul-07 1.09 1.13 1.11 1.04 1.09 1.11 1.08 1.10 1.08 1.08 1.11 1.09Jan-07 1.10 1.15 1.11 1.05 1.12 1.11 1.08 1.11 1.09 1.08 1.11 1.10Jul-06 1.12 1.18 1.12 1.06 1.14 1.12 1.10 1.13 1.10 1.10 1.13 1.12Jan-06 1.14 1.21 1.15 1.07 1.17 1.12 1.11 1.14 1.13 1.12 1.15 1.14Jul-05 1.16 1.23 1.18 1.08 1.21 1.13 1.13 1.17 1.15 1.13 1.17 1.15Jan-05 1.19 1.26 1.20 1.11 1.25 1.16 1.18 1.19 1.18 1.17 1.20 1.17Jul-04 1.21 1.29 1.22 1.15 1.29 1.16 1.20 1.22 1.20 1.20 1.21 1.20Jan-04 1.23 1.34 1.23 1.17 1.32 1.19 1.20 1.24 1.20 1.22 1.22 1.21Jul-03 1.23 1.34 1.24 1.18 1.32 1.19 1.20 1.25 1.20 1.23 1.20 1.20Jan-03 1.24 1.36 1.25 1.19 1.33 1.18 1.20 1.25 1.20 1.26 1.20 1.21Jul-02 1.24 1.36 1.26 1.19 1.33 1.19 1.20 1.25 1.21 1.26 1.21 1.21Jan-02 1.25 1.36 1.27 1.21 1.33 1.18 1.21 1.25 1.21 1.26 1.22 1.22Jul-01 1.25 1.36 1.28 1.21 1.34 1.18 1.21 1.24 1.22 1.26 1.22 1.22Jan-01 1.25 1.37 1.28 1.22 1.34 1.19 1.21 1.24 1.22 1.26 1.22 1.23Jul-00 1.25 1.37 1.28 1.22 1.35 1.18 1.22 1.24 1.22 1.26 1.23 1.23Jan-00 1.32 1.44 1.33 1.28 1.42 1.22 1.28 1.30 1.30 1.30 1.32 1.29Jul-99 1.27 1.39 1.30 1.25 1.37 1.19 1.23 1.26 1.24 1.28 1.25 1.26Jan-99 1.28 1.40 1.30 1.25 1.38 1.20 1.25 1.27 1.25 1.28 1.27 1.26Jul-98 1.29 1.42 1.31 1.26 1.39 1.21 1.27 1.27 1.26 1.28 1.28 1.27Jan-98 1.31 1.43 1.32 1.28 1.40 1.21 1.27 1.29 1.28 1.28 1.30 1.29Jul-97 1.32 1.44 1.33 1.28 1.42 1.22 1.28 1.30 1.30 1.30 1.32 1.29Jan-97 1.33 1.46 1.34 1.30 1.44 1.23 1.28 1.32 1.32 1.33 1.33 1.31Jul-96 1.35 1.47 1.36 1.31 1.46 1.25 1.27 1.34 1.33 1.34 1.36 1.31Jan-96 1.36 1.48 1.38 1.32 1.48 1.26 1.30 1.35 1.35 1.35 1.38 1.32Jul-95 1.38 1.50 1.40 1.34 1.51 1.29 1.32 1.38 1.37 1.38 1.40 1.34Jan-95 1.41 1.52 1.43 1.36 1.55 1.30 1.35 1.39 1.39 1.38 1.42 1.36Jul-94 1.42 1.53 1.45 1.37 1.58 1.32 1.38 1.42 1.41 1.38 1.45 1.37Jan-94 1.43 1.54 1.46 1.38 1.59 1.32 1.38 1.43 1.42 1.39 1.48 1.38Jul-93 1.45 1.57 1.47 1.38 1.60 1.33 1.39 1.43 1.45 1.42 1.50 1.40Jan-93 1.47 1.58 1.48 1.39 1.63 1.35 1.40 1.44 1.47 1.44 1.52 1.42Jul-92 1.49 1.60 1.50 1.41 1.67 1.35 1.40 1.46 1.49 1.46 1.55 1.45Jan-92 1.50 1.62 1.52 1.41 1.68 1.37 1.40 1.48 1.52 1.48 1.57 1.47Jul-91 1.52 1.65 1.55 1.42 1.70 1.38 1.42 1.49 1.53 1.48 1.59 1.49Jan-91 1.54 1.68 1.57 1.44 1.72 1.40 1.44 1.52 1.55 1.52 1.62 1.511990 1.62 1.72 1.65 1.50 1.84 1.45 1.54 1.59 1.62 1.58 1.71 1.571989 1.69 1.79 1.74 1.56 1.98 1.49 1.59 1.66 1.71 1.66 1.76 1.671988 1.77 1.86 1.83 1.64 2.08 1.55 1.67 1.73 1.79 1.73 1.83 1.731987 1.81 1.92 1.87 1.68 2.15 1.57 1.71 1.76 1.84 1.78 1.88 1.811986 1.86 1.95 1.89 1.71 2.21 1.61 1.75 1.78 1.89 1.83 1.91 1.88Hospital
Personal property replacement <strong>value</strong> <strong>cost</strong> <strong>trends</strong>YearAvgCanning& FoodIndustryMachineShopOfficePaperMfgPlasticsPrintingSheetMetalFabTextileRubberWoodWorking1985 1.90 1.99 1.88 1.74 2.30 1.65 1.82 1.82 1.92 1.90 1.95 1.961984 1.98 2.07 1.94 1.77 2.43 1.72 1.88 1.85 2.01 2.02 2.02 2.051983 2.04 2.17 1.94 1.84 2.52 1.79 1.96 1.81 2.07 2.14 2.08 2.161982 2.12 2.23 1.94 1.94 2.67 1.88 2.09 1.83 2.13 2.23 2.08 2.281981 2.31 2.44 2.06 2.14 2.98 2.02 2.21 1.98 2.35 2.46 2.29 2.431980 2.56 2.72 2.27 2.33 3.32 2.21 2.43 2.26 2.64 2.73 2.61 2.691979 2.72 2.90 2.45 2.45 3.50 2.31 2.58 2.41 2.80 2.89 2.79 2.851978 3.02 3.25 2.82 2.69 3.79 2.54 2.93 2.72 3.08 3.20 3.13 3.091977 3.27 3.64 3.03 2.88 4.08 2.74 3.20 2.97 3.31 3.45 3.44 3.281976 3.49 3.91 3.20 3.02 4.29 2.96 3.46 3.19 3.54 3.69 3.74 3.431975 3.75 4.19 3.39 3.22 4.67 3.14 3.72 3.44 3.83 3.96 4.08 3.661974 4.25 4.60 3.92 3.57 5.36 3.56 4.16 4.13 4.19 4.54 4.68 4.011973 4.90 5.14 4.65 4.11 6.32 4.09 4.74 4.72 4.82 5.41 5.35 4.511972 5.18 5.38 4.93 4.29 6.67 4.28 4.95 5.01 5.08 5.70 5.62 5.091971 5.41 5.59 5.07 4.42 7.03 4.44 5.11 5.40 5.38 5.90 5.88 5.281970 5.72 5.93 5.29 4.67 7.54 4.66 5.46 5.55 5.67 6.36 6.26 5.561965 7.29 7.43 6.76 5.79 9.72 5.77 6.87 7.22 6.88 8.58 8.18 6.941960 7.93 7.28 10.30 7.35 7.85 7.32 9.13 9.12 7.401955 9.79 9.03 12.95 9.07 9.20 9.10 11.08 11.221950 11.87 10.86 15.12 11.03 10.88 10.68 13.38 13.631945 17.70 17.13 26.70 19.05 17.72 17.49 21.98 22.051940 21.25 19.88 30.70 20.96 21.44 20.29 27.03 25.36Hospital
Zurich’s property valuation experienceIt’s more than insurance appraisalsIt’s about helping you stay protectedZurich’s property valuation services are about making sure your insurableproperty <strong>value</strong>s are reported accurately. With up-to-date valuation dataand consulting tools, our seasoned valuation team is helping to createinsurance programs that more accurately reflect the true <strong>value</strong> and exposurefor property insurance, while at the same time simplifying the ITV (insuranceto <strong>value</strong>) process.Specialized experience• Certified valuation professionals dedicated solely to property valuation• Qualified staff with a 30-year record of providing effective ITV solutions• Confidentiality and accountability in all business dealingsCustomized services that address your needs• Detailed on-site appraisals for real and personal property• Thorough business interruption <strong>value</strong> analysis• Comprehensive reports that confirm <strong>value</strong>s• Responsive consulting services• Customized valuation analysis using modeling approaches for largeproperty schedules• Effective assistance in analyzing and managing property exposures• A holistic approach to solving valuation problemsUp-to-date <strong>cost</strong> trending• Publishing real and personal property <strong>cost</strong> <strong>trends</strong> that are updated biannuallyIf you have questions, please contact:Rick Lunt<strong>Risk</strong> <strong>Engineering</strong> property valuation manager847-330-4398richard.lunt@zurichna.com
A1-117345-K (02/13) 112001012Zurich Services Corporation<strong>Risk</strong> <strong>Engineering</strong>1400 American Lane, Schaumburg, Illinois 60196-1056800 982 5964 www.zurichna.comThe information in this publication was compiled by Zurich Services Corporation from sourcesbelieved to be reliable for informational purposes only. All sample policies and proceduresherein should serve as a guideline, which you can use to create your own policies andprocedures. We trust that you will customize these samples to reflect your own operationsand believe that these samples may serve as a helpful platform for this endeavor. Any and allinformation contained herein is not intended to constitute legal advice and accordingly, youshould consult with your own attorneys when developing programs and policies. We do notguarantee the accuracy of this information or any results and further assume no liability inconnection with this publication and sample policies and procedures, including any information,methods or safety suggestions contained herein. Moreover, Zurich Services Corporation remindsyou that this cannot be assumed to contain every acceptable safety and compliance procedureor that additional procedures might not be appropriate under the circumstances. The subjectmatter of this publication is not tied to any specific insurance product nor will adopting thesepolicies and procedures ensure coverage under any insurance policy.©2013 Zurich Services Corporation