Turkish Power Market Monthly Report (June 2012) - Hydropower ...
Turkish Power Market Monthly Report (June 2012) - Hydropower ...
Turkish Power Market Monthly Report (June 2012) - Hydropower ...
You also want an ePaper? Increase the reach of your titles
YUMPU automatically turns print PDFs into web optimized ePapers that Google loves.
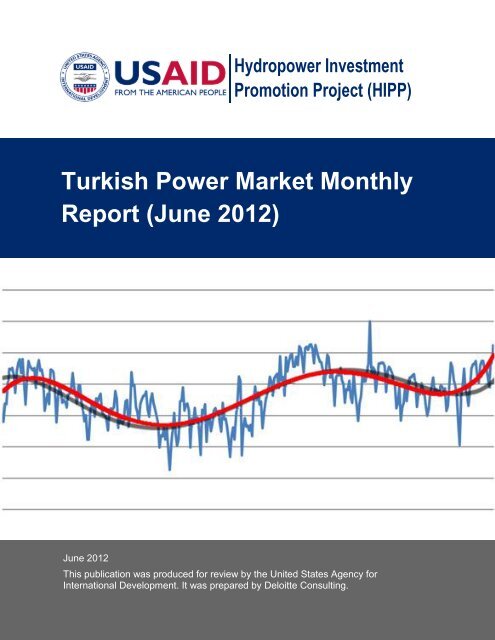
<strong>Hydropower</strong> InvestmentPromotion Project (HIPP)<strong>Turkish</strong> <strong>Power</strong> <strong>Market</strong> <strong>Monthly</strong><strong>Report</strong> (<strong>June</strong> <strong>2012</strong>)<strong>June</strong> <strong>2012</strong>This publication was produced for review by the United States Agency forInternational Development. It was prepared by Deloitte Consulting.
<strong>Turkish</strong> <strong>Power</strong> <strong>Market</strong> <strong>Monthly</strong><strong>Report</strong> (<strong>June</strong> <strong>2012</strong>)USAID HYDROPOWER INVESTMENT PROMOTION PROJECT (HIPP)CONTRACT NUMBER: EEM-I-00-07-00005-0DELOITTE CONSULTING LLPUSAID/CAUCASUS OFFICE OF ENERGY AND ENVIRONMENTDISCLAIMER:The author’s views expressed in this publication do not necessarily reflectthe views of the United States Agency for International Development or theUnited States Government.
This document was prepared by:Author Organization Contact DetailsNikoloz SumbadzeDeloitte Consultingnsumbadze@dcop-hipp.ge+995-593-33-42-25Giorgi Bochorishvili Deloitte Consultinggbochorishvili@dcop-hipp.ge+995-577-59-58-55Reviewer Organization Contact DetailsAdrian Rouse Deloitte Consulting adrouse@deloitte.com
TABLE OF CONTENTSEXECUTIVE SUMMARY ...................................................................................... 11. INTRODUCTION .......................................................................................... 22. SYNOPSIS OF TURKISH ENERGY ECONOMY ......................................... 33. SYNOPSIS OF TURKISH DAM ................................................................... 44. ANALYSIS OF TURKISH DAM ACTIVITIES IN JUNE <strong>2012</strong> ....................... 64.1. Price Sub Groups on the <strong>Turkish</strong> DAM ........................................................... 94.2. Price Curve Dynamics by Week-Days .......................................................... 104.3. DAM Volume Data Analysis .......................................................................... 11APPENDIX ......................................................................................................... 14
Acronyms Used in this <strong>Report</strong>CPIDAMEDASEEXEMRAENTSO-EEUGWGWhHIPPHPPIFIKGÜPkVkWhMWMWhOIBPMUMSDVTEIASTETASTLTSOUSDUS cy-o-yConsumer Price IndexDay-Ahead <strong>Market</strong>Electricity Distribution CompanyEuropean Energy ExchangeEnergy <strong>Market</strong> Regulatory AuthorityEuropean Network of Transmission System Operators for ElectricityEuropean UnionGigawattGigawatt Hours<strong>Hydropower</strong> Investment Promotion ProjectHydro <strong>Power</strong> PlantInternational Financial InstitutionsFinal Day Ahead Production / Consumption Program (Kesinleşmiş GünÖncesi Üretim/Tüketim Programı)KilovoltsKilowatt HoursMegawattMegawatt Hours<strong>Turkish</strong> Privatization Administration (T.C. Basabakanlik OzellestirmeIdaresi Baskanligi)<strong>Market</strong> Financial Reconciliation Center (Piyasa Mali Uzlastirma Merkezi)System Demand Volume<strong>Turkish</strong> Electricity Transmission Company<strong>Turkish</strong> Electricity Trading and Contracting Company<strong>Turkish</strong> LiraTransmission System OperatorUnited States DollarUS Dollar CentsYear Over Year
<strong>Hydropower</strong> Investment Promotion ProjectExecutive Summary<strong>Turkish</strong> <strong>Power</strong> <strong>Market</strong> <strong>Monthly</strong> <strong>Report</strong>USAID’s <strong>Hydropower</strong> Investment Promotion Project (HIPP) intends to help facilitateprivate sector development of at least 400 MW of new, climate friendly hydropowerin Georgia. This report has been published in support of this goal.Turkey has been identified as a potential export market for Georgian electricity.This report provides an analysis of power market prices and developments inTurkey, thereby enabling potential developers, governments, IFIs and otherstakeholders to better understand the economics of investment into the Georgianhydropower market. The number of members registered on the DAM in <strong>June</strong> increased by 1% to 545compared to 539 in May <strong>2012</strong>.Total trading volume in <strong>June</strong> was recorded at 3,659 GWh, an 11% increase onMay.At 299.7 million USD, total turnover in the DAM for <strong>June</strong> was 8.62% lower thanMay.In <strong>June</strong>, trading volume in the DAM accounted for 20.52% of realized physicaldemand compared to 24.52% in May.DAM prices in <strong>June</strong> peaked at 11.10 US c/kWh. The average price during themonth was 7.94 US c/kWh and the minimum price was 0.00 US c/kWh.<strong>June</strong>’s peak hours were recorded during 12:00-18:00 on <strong>June</strong> 27 th and 30 th whenelectricity demand in Turkey reached 30,139 MWh on average during these hourson these two days. Off-peak hours were recorded during 05:00-08:00 on <strong>June</strong> 10 thand 18 th when electricity demand in Turkey was 19,284 MWh on average withinthese hours on these two days.Maximum SDV was 31,486 MWh, whereas minimum and average SDV were17,607 MWh and 24,765 MWh, respectively.Daily trading volumes on the DAM ranged from a low of 3,558 MWh to a high of7,208 MWh; the average daily trading volume was 5,082 MWh.<strong>June</strong> was the seventh full month of activity on the DAM.1 | P a g e
1. IntroductionIn early 2011, the USAID-funded <strong>Hydropower</strong> Investment Promotion Project (HIPP)created the Special Studies Group to provide analysis of the Georgian and regionalelectricity markets as well as to support the electricity market research needed for theInvestment Promotion Group within HIPP. The <strong>Turkish</strong> electricity market is the focal pointof energy sales from new Georgian HPPs and there appears to be strong interest in powermarket developments in Turkey from many potential HPP developers, governments, IFIsand others. By examining the hourly prices and volumes of the <strong>Turkish</strong> DAM, this reportintends to provide stakeholders such as these with a better understanding of theeconomics of investment into the Georgian hydropower market.The report analyzes the hourly prices and volumes of the <strong>Turkish</strong> DAM for the examinedmonth. Historical data on final day-ahead production volume, peak, off-peak and shoulderpeakprices used in this report are based on data available from the TEIAS/PMUMwebsite 1 . TL/USD exchange rates have been calculated using data from the Central Bankof Turkey’s website, including weekend exchange rates that are calculated using the lastpreceding working days’ exchange rate. In addition, The <strong>Turkish</strong> <strong>Power</strong> <strong>Market</strong> <strong>Monthly</strong><strong>Report</strong> examines total turnover changes together with DAM’s share in total forecasteddemand. The figures on economic parameters are based on Central Bank of Turkey’s<strong>Monthly</strong> Price Development <strong>Report</strong> for <strong>June</strong> <strong>2012</strong> and its Inflation <strong>Report</strong> for Quarter II.The remainder of this report is structured as follows. Section 2 provides a brief overview ofthe <strong>Turkish</strong> energy economy and its main parameters. Section 3 provides an overview ofthe <strong>Turkish</strong> DAM and basic statistical information for <strong>June</strong> <strong>2012</strong>. In addition, a comparisonwith May <strong>2012</strong> is conducted. Section 4 provides analysis of the <strong>Turkish</strong> DAM prices andvolumes within monthly, weekly and hourly intervals, together with DAM volume dataanalysis. Finally, data sources and other relevant materials are provided in the appendix.1 <strong>Market</strong> Financial Reconciliation Center, http://dgpys.teias.gov.tr/dgpys/2 | P a g e
2. Synopsis of <strong>Turkish</strong> Energy EconomyIn <strong>June</strong>, inflation in Turkey continued its upward trend. Consumer prices went down by0.9% over the month and the Consumer Price Index (CPI) increased to an annualized8.87%, compared to 8.28% in May. According to the Central Bank of Turkey and the<strong>Turkish</strong> Statistical Institute, favorable changes in energy prices helped contain the baseeffect-drivenrise in inflation. In <strong>June</strong>, energy prices went down by 1.65% over May whichwas attributed to domestic fuel prices that fell by 4.85% upon the decline in international oilprices. The ongoing decline in cylindered gas prices accelerated in this period, whilemunicipal water tariffs increased. Overall, annualized energy group inflation went down to11.23%.In <strong>June</strong>, there were several developments in the <strong>Turkish</strong> energy sector which are worthy ofmention. According to press reports, Turkey has completed a synchronous parallel link tothe European electricity grid. The “Mediterranean Ring Project” will enable Turkey to getaccess to the European electricity market. In the next phase of the project, it is envisagedthat the electricity network will include countries from Iraq to Tunisia, forming a circularelectricity line across the Mediterranean, helping to bring an end to electricity cuts. Turkeyhas been working for several years to connect with the European electricity system, whichwill help to enhance the quality and security of electricity. The <strong>Turkish</strong> power system wassynchronized to the European electricity grid in 2010. The trial parallel interconnection ofthe <strong>Turkish</strong> power system with ENTSO-E was organized in three phases. Phase 1 was astabilization period with no scheduled exchange of energy. During Phase 2, physical andnon-commercial energy exchanges were carried out between TEIAS, the Bulgarian andGreek TSOs, respectively. After successful completion of the first two phases, commercialelectricity exchanges were carried out by connecting two 400 kV lines from Turkey to theBulgarian system and another 400 kV line to the Greek system, in line with EU rules andENTSO-E procedures.Turkey’s government has stated it is willing to soon sell three further major distributioncompanies. According to the Privatization Board (OIB), preparation is underway in order tocarry out tendering of Akdeniz, Gediz and Bogazici distribution companies by the end of<strong>2012</strong>. OIB also aims to privatize Seyitomer coal-fired power plant this year. Seyitomer hasinstalled capacity of 600 megawatts and is located in the western <strong>Turkish</strong> province ofKutahya. Earlier privatization attempts for these distribution companies failed becauseawarded bidders did not make payments. Bogazici EDAS, which operates in the Europeanside of Istanbul, was subject to a winning bid of 2.75 billion USD, while the winning bid forAkdeniz EDAS, which operates in the southern city of Antalya, was 1.2 billion USD.However, bidders found they were unable to secure the necessary funding to complete thepurchases.The beginning of the summer period and an increase in air temperature increasedelectricity consumption for the use of air conditioning in Turkey. Hot weather also led<strong>Turkish</strong> farmers to prevent damage to their crops through increased agricultural irrigation,meaning higher power consumption. These developments were significant in producing an3 | P a g e
8-10% increase in electricity demand, mostly accounted for by industrial and residentialsectors.EEX and TEIAS have signed an agreement to establish an energy exchange in Turkey.The establishment of a <strong>Turkish</strong> energy exchange, with liquid power spot and derivativesmarkets, will be crucial for the successful liberalization and further growth of the electricitymarkets in Turkey. EEX states it is glad to contribute to the development of the <strong>Turkish</strong>energy market and share its expertise with <strong>Turkish</strong> partners. EEX is the leading energyexchange in Europe. It develops, operates and connects secure, liquid and transparentmarkets for energy and related products on which power, natural gas, CO 2 emissionallowances and coal are traded. Clearing and settlement of all trading transactions areprovided by the clearing house European Commodity Clearing AG (ECC). Signing of theagreement is expected to foster and support further development of the <strong>Turkish</strong> electricitymarket.3. Synopsis of <strong>Turkish</strong> DAMThe number of participants in the DAM increased by 1% during <strong>June</strong> to 545 compared tothe 0.93% increase observed in May <strong>2012</strong>.Table 2. Distribution of DAM ParticipantsLicense TypeMay <strong>2012</strong> <strong>June</strong> <strong>2012</strong>Public Private Public PrivateProduction 6 289 6 294Auto Producers 1 113 1 113Wholesale 1 108 1 108Retail 9 12 9 12Auto Producers Group 0 1 0 1Total 17 522 17 528In <strong>June</strong>, total turnover amounted to 299.7 million USD compared to 327.9 million USD in<strong>June</strong> <strong>2012</strong>. Total trading volume in the DAM was recorded at 3,659,328 MWh compared to4,111,387 MWh in May <strong>2012</strong>. The relatively small decrease in DAM’s numbers can beexplained by EMRA’s having not changed TETAS’s wholesale electricity tariffs. Thisattracted market participants and reduced activity slightly on the DAM.4 | P a g e
Table 3. Summary of Prices and TurnoverDescription 05/<strong>2012</strong> 06/<strong>2012</strong> ChangeBase Average (US c/kWh) 7.85 7.94 1.15%Peak Average Price (US c/kWh) 8.45 9.07 7.34%Off-Peak Average Price (US c/kWh) 6.26 5.27 -15.81%Shoulder-Peak Average Price(US c/kWh)8.32 8.64 3.85%Highest Price (US c/kWh) 9.71 11.10 14.32%Table 4. Summary of VolumesDescription 05/<strong>2012</strong> 06/<strong>2012</strong> ChangeTotal Volume (MWh) 4,111,387 3,659,328 -11.00%Highest Trading Volume (MWh) 7,185 7,208 0.32%Lowest Trading Volume (MWh) 3,963 3,558 -10.22%Average Trading Volume (MWh) 5,526 5,082 -8.03%Highest System Demand Volume(MWh)27,359 31,486 15.08%Lowest Price (US c/kWh) 0.19 0.00 -100%Total Turnover (USD) 327,984,671 299,705,113 -8.62%Average Hourly Turnover (USD) 440,839 416,257 -5.58%Maximum Hourly Turnover (USD) 660,515 759,502 14.99%Minimum Hourly Turnover (USD) 8,394 0.00 -100%Average Weekdays Price (US c/kWh) 7.92 8.21 3.66%Average Weekdays Turnover (USD) 458,135 441,682 -99.90%Average Weekend Price (US c/kWh) 7.65 7.33 -4.18%Average Weekend Turnover (USD) 391,112 356,931 -8.74%Lowest System Demand Volume(MWh)Average System Demand Volume(MWh)Average Weekdays Trading Volume(MWh)Average Weekend Trading Volume(MWh)DAM’s share in total forecasteddemand (%)17,016 17,607 3.47%22,530 24,765 9.92%5,694 5,224 -8.25%5,041 4,750 -5.77%24.52 20.52 -16.31%Note:Base average price contains an average of all the hourly prices in the examined period. Peak, off-peak, and shoulder-peak averageprices and the highest and lowest price contain prices for already determined peak, off-peak and shoulder-peak hours and maximumand minimum prices during the examined period. Total volume determines the volume of electricity traded in the DAM. System demandvolume represents the total volume of electricity consumed in Turkey.5 | P a g e
4. Analysis of <strong>Turkish</strong> DAM Activities in <strong>June</strong> <strong>2012</strong>The <strong>Turkish</strong> DAM is characterized by hourly and even weekly fluctuations in pricespikes and production volumes. However, in the aggregate, trading volumes andclearing prices continue to grow. In <strong>June</strong> <strong>2012</strong>, monthly electricity production increasedby 10% compared with the previous year. Based on HIPP’s previous studies, this reportuses three price clusters: peak, shoulder-peak and off-peak hours. During daytime,peak hours were categorized between 11:00-19:00 hours, whereas off-peak hours werebetween 02:00-08:00 and shoulder peak hours were 08:00-11:00 and 19:00-02:00.PMUM’s web site provides day-ahead demand and production forecasts. Data is alsoprovided on KGUP that is the final schedule of the next day’s production after dayaheadbidding 2 . HIPP uses KGUP as a proxy for demand on the <strong>Turkish</strong> power market.Table 5. Comparison of DAM variablesYearDAM Price(US c/kWh)TradingVolume onthe DAM(MWh)SystemDemandVolume(MWh)Variables onHourly Basis<strong>June</strong>, 2011 <strong>June</strong>, <strong>2012</strong> ChangeMax 11.54 11.10 -3.81%Average 5.96 7.94 33.22%Min 0.1 0.00 -100.00%Max 4,091 7,208 76.19%Average 1,318 5,082 285.58%Min 81 3,558 4292.59%Max 29,560 31,486 6.52%Average 23,290 24,765 6.33%Min 17,300 17,607 1.77%The data in Table 5 shows there were considerable y-o-y change in key marketvariables. Despite the stable electricity supply and prices in <strong>June</strong> <strong>2012</strong>, key marketvariables continued to show y-o-y increases. On average, SDV demand increased by6.33% in <strong>June</strong> <strong>2012</strong> while trading volumes and prices on the DAM tended to increaseas well. In the examined month, DAM’s trading volume almost tripled compared to <strong>June</strong>2011, while prices showed a 33.22% y-o-y increase on average.2 We estimated the difference between actual monthly production and KGUP monthly production at around 11% in <strong>June</strong>. (Total sumof KGUP production for <strong>June</strong> was 17,831 GWh, while for the same time period actual production was 19,858 GWh).6 | P a g e
US c/kWh00:00-01:0001:00-02:0002:00-03:0003:00-04:0004:00-05:0005:00-06:0006:00-07:0007:00-08:0008:00-09:0009:00-10:0010:00-11:0011:00-12:0012:00-13:0013:00-14:0014:00-15:0015:00-16:0016:00-17:0017:00-18:0018:00-19:0019:00-20:0020:00-21:0021:00-22:0022:00-23:0023:00-24:00GWhUS c/KWhFigure 1. Average System Load and Prices by Hours302520151050109876543210Average System Load in 2011 Average System Load in <strong>2012</strong>Average DAM Price in 2011 Average DAM Price in <strong>2012</strong>Figure 1 compares variations in average system loads and prices between <strong>June</strong> 2011and <strong>June</strong> <strong>2012</strong>. As can be seen, hourly system volume was higher in <strong>June</strong> <strong>2012</strong> than in<strong>June</strong> 2011. On average, DAM prices are also significantly higher, peaking smoothly at09:00-24:00 hours, compared to prices in <strong>June</strong> 2011 which demonstrates several pricesspikes during a day.Figure 2. Daily Minimum, Average and Maximum Prices in the DAM1211109876543210Daily Min Prices Daily Average Prices Daily Max Prices7 | P a g e
00:00-01:0001:00-02:0002:00-03:0003:00-04:0004:00-05:0005:00-06:0006:00-07:0007:00-08:0008:00-09:0009:00-10:0010:00-11:0011:00-12:0012:00-13:0013:00-14:0014:00-15:0015:00-16:0016:00-17:0017:00-18:0018:00-19:0019:00-20:0020:00-21:0021:00-22:0022:00-23:0023:00-24:00US c/kWhAs can be seen in Figure 2, there were considerable price spikes during <strong>June</strong> <strong>2012</strong>.While DAM prices in <strong>June</strong> followed the trend of May’s price development, electricityprices were characterized by minor fluctuations. <strong>June</strong>’s peak hours were recordedduring 12:00-18:00 on <strong>June</strong> 27 th and 30 th when electricity demand in Turkey reached30,139 MWh on average for these two days. Off-peak hours were recorded during04:00-08:00 when electricity demand was 19,342 MWh on <strong>June</strong> 10 th and 18 th onaverage for these days within those hours. Furthermore, on <strong>June</strong> 18 th during 05:00-07:00 hours, the electricity price fell to zero. Even though extreme hot weather causedelectricity price increase during daytime hours, on the morning of <strong>June</strong> 18 th , for twohours, electricity demand equalized to zero. During this period, electricity producerscontinued to produce and distribution companies were buying free of charge.Figure 3. Hourly Minimum, Average and Maximum Price in the DAM, <strong>June</strong> <strong>2012</strong>1211109876543210Hourly Min Prices Hourly Average Prices Hourly Max PricesAs shown in Figure 3, electricity spot prices in the DAM followed typical hourly trends,however some fluctuations were experienced. Peak hours were between 12:00-18:00when the highest electricity price was between 10.24-11.10 US c/kWh. Maximum hourlyprices was characterized by a smooth trend and ranged between 7.3 – 11.10 US c/kWh.Average hourly prices ranged between 3.76 – 9.32 US c/kWh and also followed thistrend. Minimum hourly prices demonstrate considerable downturn during off-peak hourswhile within shoulder-peak and peak hours, prices hike significantly ranging from 4.05 –8.07 US c/kWh. In general, maximum and average prices were noticeably high in <strong>June</strong><strong>2012</strong> compared to previous months.8 | P a g e
4.1. Price Sub Groups on the <strong>Turkish</strong> DAMIn Figure 4, we use PMUM data to group <strong>June</strong>’s hourly prices in four price bands.Based on our analysis, prices below 3 US c/kWh were only recorded during off-peakand shoulder-peak hours, and accounted for the smallest share of the four bands.Prices between 3-6 US c/kWh were recorded in all hours but mostly contributed to offpeakhours. Prices between 6-9 US c/kWh accounted for the largest share of marketvolume. Sales in this price band mostly occurred during working hours and had asignificantly higher share of total volume. Prices above 9 US c/kWh demonstrated thesecond largest share of the four price bands, and were recorded solely during shoulderpeakand peak hours.Figure 4. Distribution of Price Ranges, <strong>June</strong> <strong>2012</strong>80%70%60%50%40%30%20%10%0%0 to 3 US c/kWh 3 to 6 US c/kWh 6 to 9 US c/kWh More than 9 US c/kWhBelow 3 US c/kWh. The total number of hours when prices were below 3 US c/kWhwas only 33 out of a total 720 hours under study. This price range was recorded duringoff-peak and shoulder-peak hours where the main contributor was off-peak hours with31 hours in that price range.3 to 6 US c/kWh. The number of hours electricity traded in this range was 88. This priceband was recorded within 24 hours however the main contributor in this range was theoff-peak period when prices between 3 to 6 US c/kWh were recorded 76 times. Thenumber of hours when prices for shoulder-peak and peak periods were recorded were 9and 3, respectively.6 to 9 US c/kWh. Prices in this band accounted for 329 hours during <strong>June</strong> <strong>2012</strong>, 73 ofwhich occurred during off-peak, 102 during shoulder-peak, and 154 during peak hours.It was the largest contributor in the price bands.9 | P a g e
US c/kWhPercet of TimeOver 9 US c/kWh. There were 270 hours in this price band. This price range had thesecond largest share of the four price ranges. During off-peak hours this price band wasnot recorded. Consequently, the total numbers of peak and shoulder-peak hours in thisprice band were 135 and 135, respectively.Overall, shoulder-peak and peak prices were dominant during the examined period.Figure 5 provides distribution of price bands for the period under study.Figure 5. Distribution by Price Range, <strong>June</strong> <strong>2012</strong>50%45.69%45%40%37.50%35%30%25%20%15%12.22%10%4.58%5%0%0 to 3US c/kWh3 to 6US c/kWh6 to 9US c/kWhMore than 9US c/kWh4.2. Price Curve Dynamics by Week-DaysFigure 6 shows that maximum and average electricity prices are high during weekdays,while electricity prices decrease during weekends, as electricity demand softens.Figure 6. Price Dynamics by Weekdays, <strong>June</strong> <strong>2012</strong>1211109876543210Mon Tue Wed Thu Fri Sat SunMinimum Average Maximum10 | P a g e
Figure 7 provides a comparision of price bands within weekdays. Prices below 3US c/kWh were recorded on almost all weekdays, however an insignificant amount ofthe time. Prices between 3-6 USc/kWh occurred on all weekdays and had a minor shareof total volume, as did prices below 3 US c/kWh. Prices between 6-9 US c/kWh andprices above 9 Us c/kWh were the mainstay of the market, occuring around 50% of thetime.Figure 7. Price Range Breakdown by Weekdays, <strong>June</strong> <strong>2012</strong>Sun 14.58% 16.67%Sat 2.50% 15.00%50.00%Fri 11.67%47.50%Thu 9.38%41.67%Wed 2.08% 9.38%41.67%Tue 12.50%41.67%Mon 14.58% 10.42%41.67%0%20%40%54.17%60%14.58%32.50%40.83%48.96%46.88%45.83%33.33%80%100%0 to 3 US c/kWh 3 to 6 US c/kWh 6 to 9 US c/kWh More than 9 US c/kWh4.3. DAM Volume Data AnalysisFigure 8 illustrates daily production in the entire <strong>Turkish</strong> power market and the share ofthe DAM. As can be seen, system loads are significantly lower during weekends inTurkey. However, trading volumes in the DAM did not follow this trend in <strong>June</strong> <strong>2012</strong>.This explains why the dashed line on the graph is acyclic to the system load, therebyindicating an increasing share of trading volume as a portion of total system load duringweekends.11 | P a g e
GWhPercent of TimePercentFigure 8. Daily Electricity Production and Share of the DAM, <strong>June</strong> <strong>2012</strong>70060050040030020010002322212019181716System Daily ProductionShare of DAMFigure 9 provides distribution of trading volume by MWh groups in the <strong>Turkish</strong> DAM.Figure 9. Trading Volume by MWh Group in the DAM, <strong>June</strong> <strong>2012</strong>2102<strong>2012</strong>45%40%35%30%25%20%15%10%5%0%0%9.44%41.53%30.56%17.92%0.56% 0%Volume in Single Hour (MWh)12 | P a g e
MWh00:00-01:0001:00-02:0002:00-03:0003:00-04:0004:00-05:0005:00-06:0006:00-07:0007:00-08:0008:00-09:0009:00-10:0010:00-11:0011:00-12:0012:00-13:0013:00-14:0014:00-15:0015:00-16:0016:00-17:0017:00-18:0018:00-19:0019:00-20:0020:00-21:0021:00-22:0022:00-23:0023:00-24:00MWhFigure 10 represents minimum, average and maximum volume dynamics within 24hours.Figure 10. Hourly Minimum, Average and Maximum Volumes in the DAM,<strong>June</strong> <strong>2012</strong>7500700065006000550050004500400035003000Min DAM Volume Average DAM Volume Max DAM VolumeFigure 11 represents daily minimum, average and maximum volume dynamics withinthe examined period.Figure 11. Daily Minimum, Average and Maximum Volumes in the DAM, <strong>June</strong><strong>2012</strong>7500700065006000550050004500400035003000Min DAM Volume Average DAM Volume Max DAM Volume13 | P a g e
AppendixSource materials used in this report can be found at the following locations.1. <strong>Hydropower</strong> Investment Promotion Project, www.hydropower.ge2. Energy <strong>Market</strong> Regulatory Authority, www.emra.gov.tr3. <strong>Market</strong> Financial Reconciliation Center (PMUM), dgpys.teias.gov.tr/dgpys/4. <strong>Market</strong> Financial Reconciliation Center (PMUM), www.pmum.gov.tr5. <strong>Turkish</strong> Electricity Transmission Corporation, www.teias.gov.tr14 | P a g e
USAID <strong>Hydropower</strong> Investment Promotion Project (USAID-HIPP)Deloitte Consulting Overseas Projects - HIPP13 th floor, 11, Apakidze str, Tiflis Business Center,Tbilisi, 0171, Georgia15 | P a g e


