Turkish Power Market Monthly Report (June 2012) - Hydropower ...
Turkish Power Market Monthly Report (June 2012) - Hydropower ...
Turkish Power Market Monthly Report (June 2012) - Hydropower ...

Create successful ePaper yourself
Turn your PDF publications into a flip-book with our unique Google optimized e-Paper software.
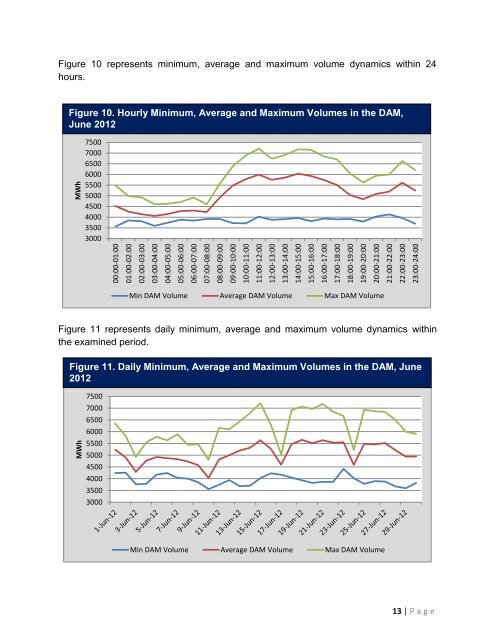
MWh00:00-01:0001:00-02:0002:00-03:0003:00-04:0004:00-05:0005:00-06:0006:00-07:0007:00-08:0008:00-09:0009:00-10:0010:00-11:0011:00-12:0012:00-13:0013:00-14:0014:00-15:0015:00-16:0016:00-17:0017:00-18:0018:00-19:0019:00-20:0020:00-21:0021:00-22:0022:00-23:0023:00-24:00MWhFigure 10 represents minimum, average and maximum volume dynamics within 24hours.Figure 10. Hourly Minimum, Average and Maximum Volumes in the DAM,<strong>June</strong> <strong>2012</strong>7500700065006000550050004500400035003000Min DAM Volume Average DAM Volume Max DAM VolumeFigure 11 represents daily minimum, average and maximum volume dynamics withinthe examined period.Figure 11. Daily Minimum, Average and Maximum Volumes in the DAM, <strong>June</strong><strong>2012</strong>7500700065006000550050004500400035003000Min DAM Volume Average DAM Volume Max DAM Volume13 | P a g e