Turkish Power Market Monthly Report (June 2012) - Hydropower ...
Turkish Power Market Monthly Report (June 2012) - Hydropower ...
Turkish Power Market Monthly Report (June 2012) - Hydropower ...

You also want an ePaper? Increase the reach of your titles
YUMPU automatically turns print PDFs into web optimized ePapers that Google loves.
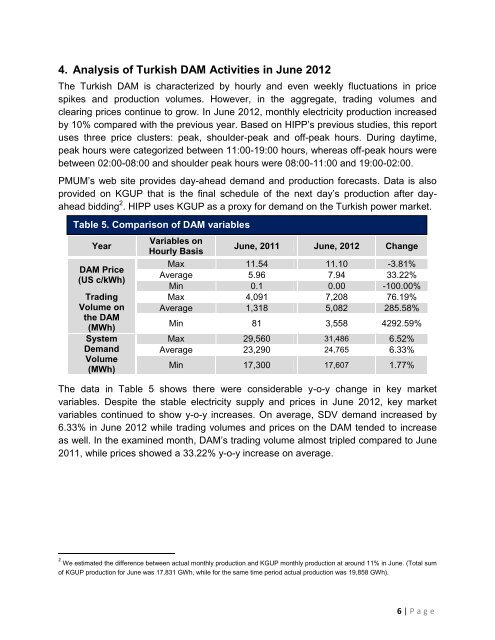
4. Analysis of <strong>Turkish</strong> DAM Activities in <strong>June</strong> <strong>2012</strong>The <strong>Turkish</strong> DAM is characterized by hourly and even weekly fluctuations in pricespikes and production volumes. However, in the aggregate, trading volumes andclearing prices continue to grow. In <strong>June</strong> <strong>2012</strong>, monthly electricity production increasedby 10% compared with the previous year. Based on HIPP’s previous studies, this reportuses three price clusters: peak, shoulder-peak and off-peak hours. During daytime,peak hours were categorized between 11:00-19:00 hours, whereas off-peak hours werebetween 02:00-08:00 and shoulder peak hours were 08:00-11:00 and 19:00-02:00.PMUM’s web site provides day-ahead demand and production forecasts. Data is alsoprovided on KGUP that is the final schedule of the next day’s production after dayaheadbidding 2 . HIPP uses KGUP as a proxy for demand on the <strong>Turkish</strong> power market.Table 5. Comparison of DAM variablesYearDAM Price(US c/kWh)TradingVolume onthe DAM(MWh)SystemDemandVolume(MWh)Variables onHourly Basis<strong>June</strong>, 2011 <strong>June</strong>, <strong>2012</strong> ChangeMax 11.54 11.10 -3.81%Average 5.96 7.94 33.22%Min 0.1 0.00 -100.00%Max 4,091 7,208 76.19%Average 1,318 5,082 285.58%Min 81 3,558 4292.59%Max 29,560 31,486 6.52%Average 23,290 24,765 6.33%Min 17,300 17,607 1.77%The data in Table 5 shows there were considerable y-o-y change in key marketvariables. Despite the stable electricity supply and prices in <strong>June</strong> <strong>2012</strong>, key marketvariables continued to show y-o-y increases. On average, SDV demand increased by6.33% in <strong>June</strong> <strong>2012</strong> while trading volumes and prices on the DAM tended to increaseas well. In the examined month, DAM’s trading volume almost tripled compared to <strong>June</strong>2011, while prices showed a 33.22% y-o-y increase on average.2 We estimated the difference between actual monthly production and KGUP monthly production at around 11% in <strong>June</strong>. (Total sumof KGUP production for <strong>June</strong> was 17,831 GWh, while for the same time period actual production was 19,858 GWh).6 | P a g e