Turkish Power Market Monthly Report (June 2012) - Hydropower ...
Turkish Power Market Monthly Report (June 2012) - Hydropower ...
Turkish Power Market Monthly Report (June 2012) - Hydropower ...

You also want an ePaper? Increase the reach of your titles
YUMPU automatically turns print PDFs into web optimized ePapers that Google loves.
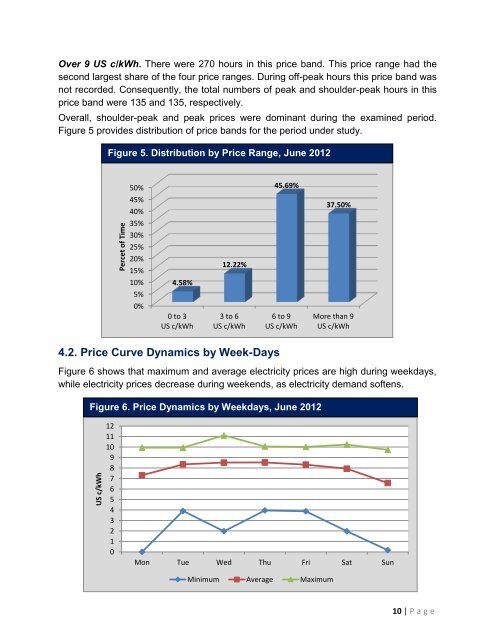
US c/kWhPercet of TimeOver 9 US c/kWh. There were 270 hours in this price band. This price range had thesecond largest share of the four price ranges. During off-peak hours this price band wasnot recorded. Consequently, the total numbers of peak and shoulder-peak hours in thisprice band were 135 and 135, respectively.Overall, shoulder-peak and peak prices were dominant during the examined period.Figure 5 provides distribution of price bands for the period under study.Figure 5. Distribution by Price Range, <strong>June</strong> <strong>2012</strong>50%45.69%45%40%37.50%35%30%25%20%15%12.22%10%4.58%5%0%0 to 3US c/kWh3 to 6US c/kWh6 to 9US c/kWhMore than 9US c/kWh4.2. Price Curve Dynamics by Week-DaysFigure 6 shows that maximum and average electricity prices are high during weekdays,while electricity prices decrease during weekends, as electricity demand softens.Figure 6. Price Dynamics by Weekdays, <strong>June</strong> <strong>2012</strong>1211109876543210Mon Tue Wed Thu Fri Sat SunMinimum Average Maximum10 | P a g e