NOAA Technical Memorandum NMFS-SEFSC-xxx
NOAA Technical Memorandum NMFS-SEFSC-xxx
NOAA Technical Memorandum NMFS-SEFSC-xxx

Create successful ePaper yourself
Turn your PDF publications into a flip-book with our unique Google optimized e-Paper software.
Clinical Use of Extended-Release Injectable Naltrexone in the Treatment of Opioid Use Disorder: A Brief GuideASSESSING THE NEED FOR TREATMENT Patient AssessmentA patient who is identified with a potential opioiduse disorder should undergo a thoroughassessment to confirm the diagnosis. 16 Theobjectives of the assessment are to determinethe patient’s need for treatment, to develop atreatment plan, and to establish a baselinemeasure for evaluating the patient’s progress.Accordingly, the patient assessment should:Confirm the opioid use disorder diagnosisEstablish current opioid use—when, what,and how much opioid the patient used mostrecentlyDocument the patient’s substance use history,including alcohol and other drugs of abuseIdentify patients who require medicallysupervised detoxification from alcohol,benzodiazepines, or other sedatives, inaddition to opioidsDetermine where and when suchdetoxification should be accomplishedIdentify comorbid medical and psychiatricconditions and disorders and prioritize andcoordinate their managementScreen for infectious diseases for whichpeople who misuse opioids are at elevatedrisk, such as hepatitis B , hepatitis C andHIV/AIDSAssess the patient’s access to socialsupports, family, friends, employment,housing, finances, and assistance with legalproblemsEvaluate the patient’s degree of motivation forbehavior change and readiness to participatein treatmentThe physical examination should focus onproblems the patient is experiencing andinclude screening for common consequences orco-occurring problems associated with thepatient’s current and past substance use.Substance Use History. A completesubstance use history is essential to developmentof a safe and appropriate treatment plan. 17 Indepthinterviews, combined with the use ofstandardized assessment instruments, areeffective methods of gathering this information.Ideally, the substance use history should includethe nature of the patient’s substance usedisorders, underlying or co-occurring diseases orconditions, the effect of opioid use on the patient’sphysical and psychological functioning, and theoutcomes of past treatment episodes.It is essential to find out whether the patient iscurrently taking (or recently took) methadone orother long-acting opioids. 18,19 Urine toxicologyscreens must also be completed. It also isadvisable to access the patient’s prescriptiondrug use history through the state’s prescriptiondrug monitoring program (PDMP) 20 whereavailable, both to confirm compliance in takingprescribed medications and to detectunreported use of other prescriptionmedications. 17 Information about PDMPs andhow to access them is available from stateboards of medicine and pharmacy.Information about PDMPs and how toaccess them is available from stateboards of medicine and pharmacy.In addition to securing the patient’s PDMPrecord, obtaining information from familymembers and significant others can provideuseful perspectives on the patient’s behaviorand level of function, so consent to speak withfamily members and other providers must beobtained. Contact with or records from clinicianswho have treated the patient in the past andinformation from the prescription benefitprovider should also be sought out. 10Physical Examination. The physicalexamination of a patient who is being evaluatedfor a substance use disorder should focus onphysical findings related to addiction and itscomplications. For example, examination of skininjection sites can provide useful informationabout the duration of injection drug use. Recentinjection marks are small and red and sometimesare inflamed or surrounded by slight bruising.Older injection sites typically are not inflamed butsometimes show pigmentation changes (eitherlighter or darker), and the skin may have anatrophied or sunken appearance. A combinationof recent and old injection sites suggests that the2
INTRODUCTIONGeographically widespread (e.g. Aronson and Precht 2001) and locally intense(e.g. Miller et al. in press) declines in populations of the only two fast-growing reefbuildingcorals in the Caribbean, the elkhorn coral Acropora palmata and the staghorncoral Acropora cervicornis, led to their designation in 1999 as Candidate Species underthe US Endangered Species Act (Diaz-Soltero 1999). Aronson and Precht (2001) offeran extensive review of this regional decline and argue that white band disease was theprimary culprit on the Caribbean-wide regional scale, with more localized losses beingcaused by hurricane damage. Jamaica was an area devastated by Hurricane Allen in1980. A. cervicornis suffered a 100-fold decrease in density, whereas the densities of itspredator, the gastropod Coralliophila abbreviata remained close to pre-storm levels(Knowlton et al. 1981, 1990). Live coral fragments, potentially able to reattachthemselves and form new, healthy stands, were eaten by surviving C. abbreviatapopulations, arresting the recovery process of the staghorn corals.As recently emphasized by the Florida Keys National Marine Sanctuary(FKNMS) Science Advisory Panel(http://www.fknms.nos.noaa.gov./research_monitoring/sap2000.html), declining coralpopulations in the Florida Keys demand attention to identifying causes and implementingmanagement strategies aimed at arresting this decline. Given the documented decline inAcroporid coral abundance throughout the Sanctuary, the current study was begun in1998 to monitor remnant Acropora palmata patches in the upper Keys and the status ofresident corallivorous snails, Coralliophila abbreviata, as one of these causal threats.Snail feeding has been shown to remove an average of 3.37 cm -2 colony -1 day -1 of live A.palmata tissue on FKNMS reefs (Miller 2001).HYPTOTHESESThe primary hypothesis that instigated the study was that snail impact on A.palmata had been enhanced over time due to fishery removal of predators of the snail.With no-take reserves established in FKNMS in 1997, the opportunity arose to comparesnail populations in reserves where predation should resume and in reference sites.Similarly, we hypothesized that declining snail populations would result in A. palmata1
3. Ultimately our initial hypotheses must be evaluated in the context of both achange in management regime and major disturbance:a. Is ‘recovery’ (increased A. palmata cover, decreased snail abundance)from the 1998 disturbance enhanced in the reserves compared to thereference sites?METHODSField Surveys:The study sites were offshore bank reefs in the northern sector of the Florida KeysNational Marine Sanctuary (FKNMS), Florida, USA (Fig 1, Table 1) where A. palmatapopulations were known to persist. A. palmata and their resident Coralliophilaabbreviata populations were surveyed at 6 offshore sites, three no-take reserves, calledSanctuary Protected Areas (SPAs), and three reference (fished) sites.Annual surveys of A. palmata patches at each site were undertaken in May eachyear from 1998 to 2001. At the southern study sites, A. palmata patches were small andof low density in which case all colonies were sampled and the area of the patch wasmeasured (fully censused). These sites (French, Molasses, and Pickles) are subsequentlyreferred to as “low density,” or LD, A. palmata stands (Fig. 1). The three northern siteshad extensive patches of higher colony density which we termed “thickets” (Fig. 1). Thelarge thickets at South Carysfort and Horseshoe were subsampled using haphazard belttransects. At Little Grecian, the thicket was small and so this patch was fully censused,like the LD sites. In all years but 2000, each standing colony was measured (length andwidth to nearest decimeter) and its condition assessed by estimating percent of colonysurface with live tissue (% in five categories 0-10, 10-25, 25-50, 50-75, 75-100) as wellas the presence of disease, damselfish, etc. From these measurements a live area index(LAI) was calculated (Length * Width * % live / 100) as a rough estimate of live coralcover (or size) for the irregular, arborescent colonies. Each colony was then searched forsnails, Coralliophila abbreviata, which, when found, were counted, measured, andreturned to the colony (n= 21-165 snails per site per year). Loose fragments were notmeasured but were classified as small/medium/large (100cm)counted, and searched for snails. Thus, fragments are included in the reported snail3
parameters (e.g. snails per colony) but not in the parameters of A. palmata size andcondition. In 2000, only snail counts and measurements were conducted, not A. palmatasize and condition. An additional survey of A. palmata size and condition was conductedat two sites (Little Grecian and Horseshoe) in Oct 1998 to assess the impact of HurricaneGeorges.Several Montastraea spp. colonies (n=5-24 colonies) were haphazardly chosen inthe vicinity of the A. palmata patches at each site. These colonies were also measured tothe nearest decimeter (length, width, height), live surface cover was estimated, andresident snail populations were surveyed (n=20-168) for comparison to A. palmata snailpopulations (Table 1).Statistical Methods:Acropora palmataThe effect of Hurricane Georges on the LAI of standing colonies (n=62-118) atLittle Grecian and Horseshoe was tested by 2-way ANOVA (SITE and HURRICANE)on transformed (X’=ln(X)) data (to achieve normality and equal variances). Change overtime (YEAR) in the total “amount” of A. palmata at the four fully censused sites (as bothtotal number of colonies + fragments or as total LAI) was tested by Repeated MeasuresANOVA on Ranks. Repeated Measures analysis was used in this case because the siteswere considered replicates (n=4) and the same sites were sampled each year. The changein average condition (estimated % live surface) of all standing colonies (sites pooled,n=472-333) was tested by one-way ANOVA (YEAR) after verifying normality and equalvariance assumptions.The incidence of specific conditions of A. palmata colonies (i.e. ThreespotDamselfish, or white band disease) was expressed as a proportion of colonies at each site.Overall snail prevalence on the A. palmata population was expressed as the mean numberof snails per sampled colony. This parameter did not meet normality and equal varianceassumptions and was not aided by standard transformations. Hence, temporal trendswere tested by 1-way ANOVA on Ranks followed by Dunn’s pairwise post-hoccomparisons. Though there is not adequate site-replication to statistically test the effects4
of LD versus thicket and reserve vs. reference sites with any sort of power, these groupmeans were plotted for inspection.Coralliophila abbreviataThe lengths of snails infesting different hosts (LD A. palmata, thicket A. palmataand Montastraea spp.), were compared between years (1998 through 2001) and betweenno-take reserve and reference sites. Length data were transformed (X’=X 1/2 ) and analysisof variance (ANOVA) using general linear model (GLM, Statsoft Inc., 1995) wasperformed to evaluate the effects of host, year and reserve status on the mean length ofsnails on A. palmata. Pair-wise contrasts were considered significantly different whenthe least squares mean " 95% confidence interval did not overlap.In this ‘reserve’ model both the reserve and host effects are potentiallyconfounded by a ‘site effect’ caused by unbalanced design. Thus a ‘site specific’ modelwas also run to isolate site differences (sites: SC, LG, HS, ML, FR, PI), and included yearand host factors to identify any significant interactions. Size frequency distributions wereconstructed using 1mm size intervals to visually compare the size-structure of thepopulations between hosts, years, and sites.RESULTS:Acropora palmataAcropora palmata suffered dramatic losses between the May 1998 and the May1999 survey, coinciding with a severe bleaching incident associated with the 1997-98ENSO event and the passage of Hurricane Georges along the Florida reef tract (25 Sept1998). In the initial survey of May 1998, a total of nine isolated patches were sampled atthe six sites. Two of these nine patches (22%) had undergone complete mortality by theMay 1999 survey and are excluded from the data presented here. An additional reservesite (Grecian Rocks) where ~100 colonies were lost from additional between 1998 and1999 is also excluded from the following presentation. These disappearing patches (oneat French and one at Little Grecian, and the Grecian Rocks site) represents a loss of ~220A. palmata colonies between 1998 and 1999.5
Supplemental surveys of A. palmata at two thicket sites (LG and HS) in Oct. 1998suggest that Hurricane George increased the proportion and abundance of small andmedium fragments and decreased the size of standing colonies at both of these sites (Fig.2). In contrast, very few fragments were found in qualitative observations (andsubsequent surveys) at the LD sites suggesting that the thicket structure aided in retaininghurricane-generated fragments.At all four fully-censused sites (PI, FR, ML, LG), the total “amount” of A.palmata, expressed either as total colony abundance or total LAI, showed drastic declinebetween 1998 and 1999 and has shown only marginal recovery from 1999 to 2000 (Fig.3). Repeated measures ANOVA on ranks showed significant decline in total LAI overthe three survey years (p=0.042). However, total A. palmata abundance (standingcolonies + fragments) at LG, the only thicket in this comparison, remained quite stable(Fig. 3A).The average condition (estimated % live surface) of all A. palmata coloniesdeclined slightly but significantly (p=0.034) from 1998 to 1999, but had recovered by2001 to the original level of ~ 60% (Fig. 4). The prevalence of specific conditions suchas infestation by threespot damselfishes (Stegastes planifrons) or of white band disease(WBD) are shown in Fig. 5. WBD prevalence is
Host EffectInspection of the size structure of snail populations living on different hosts (Fig.7) reveals predominantly smaller snails (15 to 20 mm quartile range in shell length) onMontastraea spp. compared to A. palmata. Further, within A. palmata, thicket standshosted relatively larger snails (22 to 34 mm quartile range in shell length) than the LDstands (18-28 mm quartile range in shell length). Snail length was significantly differentamong the three host levels (ANOVA, p
Site EffectsIn a second ANOVA model which treated sites separately, significant differenceswere found between sites (ANOVA Table 3, p LD A. palmata > Montastraea spp.) was consistent acrosssites.The size structure of the population reflects the host and site trends (Fig. 13), butalso shows that the larger mean length of snails on LD A. palmata at FR is due to arelatively high number of large individuals (rather than a shift in mode length),uncharacteristic of snails inhabiting LD A. palmata stands.DISCUSSION:Previous work, along with our initial survey indicated that Acropora palmatapopulations in the Florida Keys were likely in a remnant state at the beginning of thecurrent study (Dustan and Halas 1987, Jaap et al. 1988, Porter and Meier 1992). It isclear that A. palmata populations in the upper Florida Keys have undergone furtherdecline since 1998, likely the combined result of the 1998 severe bleaching episode andHurricane Georges. Several measured parameters as well as informal observationssuggest that some recovery from this major disturbance has occurred between 1999 and2001. For example, the average estimated proportion of live surface for standingcolonies had resumed its 1998 level by 2001 (Fig. 4). Also, snail densities appear to havepeaked and begun to decline by 2001 (Fig. 6). Observations of individual A. palmatabranches at Little Grecian and Horseshoe reefs from which small tissue samples had beencollected for population genetic analysis showed vigorous growth during summer 2001(Miller & Baums, pers. obs.).In contrast, the more comprehensive parameters which we calculated to representthe total amount of A. palmata at the fully censused sites do not show this clear recoverypattern. The total number of A. palmata colonies (including fragments) and the total LAI8
at the three LD stand sites do not show any recognizable recovery since a precipitous 98-99 drop (Fig. 3). In contrast, Little Grecian, the only thicket site that was fully censused,did not show much decline in either total LAI nor total number of A. palmata colonies.This contrast may be attributable to differential retention of hurricane-generatedfragments between thickets and LD stands. Fragment retention after Hurricane Georges(Fig. 2) likely resulted in the stability of total A. palmata at Little Grecian (Fig 3) and,perhaps, other thicket sites, whereas at LD sites, hurricane-generated fragments appearedto have been completely exported from the site (Miller, pers. obs.). This stability of A.palmata at Little Grecian also suggests that bleaching mortality was a secondary factorwith hurricane disturbance being the dominant cause of A. palmata loss.Corallivorous snails also showed significant temporal trends in density (# colony -1 ) and length frequency, seemingly in direct or indirect (i.e. to changes in host coralpopulation structure) response to the 1998 disturbances (hurricane and/or bleaching).Increase in density between 1998 and 1999 was likely due to loss of available habitat (A.palmata live area), though abundance has subsequently shown a gradual return toward1998 levels. The decline in mean snail size from 1998 to 1999 may have moderated theirdamage to depressed A. palmata populations that would be expected to accrue fromincreased snail abundance.Host coral species and stand density are consistent predictors of snail populationcharacteristics across sites. Comparisons of snail populations at no-take reserve sitesversus reference sites did not support the predictions of our original hypothesis that therewould be increased predation on snails in no-take reserves, at least in the time frame ofthe current study.Snail damage on A. palmata colonies is difficult to quantify and was not measuredsystematically throughout the current study. However, average snail aggregations of 2-3individuals consumed 3.37 cm 2 d -1 of A. palmata tissue on colonies within the surveyedpopulations at French and Pickles (Miller 2001). Hence, the overall densities (snails percolony averaged across all colonies, infested and uninfested) of 0.5 in 1998 to a high ofalmost 1.5 in 2000 represent a substantial threat to remnant populations of A. palmata (i.ethe loss of over 1 cm 2 of live tissue per colony per day). This chronic loss of A. palmatalive area to predation is compounding what can clearly be dramatic losses to acute9
disturbances such as bleaching or hurricane damage.Overall, during the study period, substantial loss of A. palmata has occurred in theupper FKNMS and no meaningful recovery in abundance is evident.10
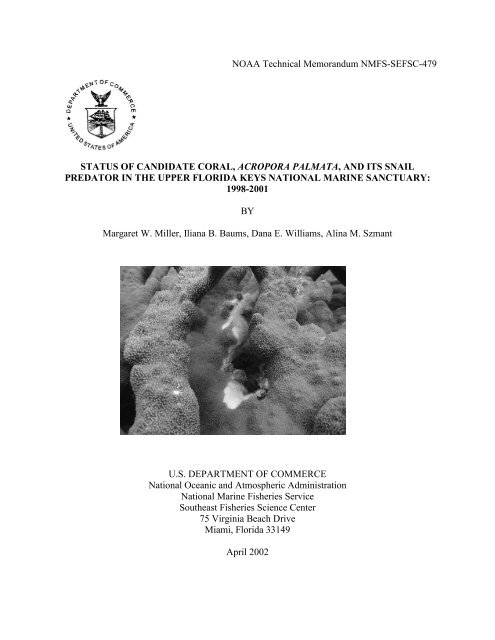
FIGURE LEGENDSFigure 1. Map (A)showing the study sites in the Key Largo area of the Florida KeysNational Marine Sanctuary. Site abbreviations as in Table 1, and those inside a boxindicate no-take reserve status. Photos illustrate a thicket stand of Acropora palmatacharacteristic of the three northern sites (B) and an isolated colony from a low-density(LD) stand characteristic of the three southern sites (C).Figure 2. A. palmata fragments and standing colonies surveyed at two thicket sites (240m 2 at Horseshoe and 80m 2 at Little Grecian) before (May 1998) and after (October 1998)Hurricane Georges. Mean (+ 1SE) Live Area Index (LAI, see METHODS) for standingcolonies (A; p-values from two-way ANOVA on ln-transformed data) and abundance offragments in different size classes (B) found in May and Oct. 98.Figure 3. Total “amount” of A. palmata at the four sites where A. palmata patches werefully censused. A) A. palmata abundance and B) sum of LAI for all standing colonies (pvaluefor Repeated Measures ANOVA on Ranks).Figure 4. Mean (+ 1SE) estimated condition (live surface area of each colony) of allsurveyed A. palmata colonies. P-value from one-way ANOVA; n is given in each bar.Figure 5. Proportion of sampled corals at each site observed to display threespotdamselfish (Stegastes planifrons, df) occupation (A) and white band disease (WBD, B).The red symbols with error bars represent the mean of all the sites and 1 standard error(n=6 sites).Figure 6. Coralliophila abbreviata density expressed as number of snails per surveyedcoral. Panel A) shows means for colonies at individual sites with the overall mean (SE) inred (n=395-947 colonies). Years with the same letter designation do not differstatistically by Dunn’s post-hoc pairwise comparisons following Kruskall-WallaceANOVA. The other panels show the same site means averaged (SE) according to stand11
structure (B) and reserve status (C) of the sites (n=3 sites).Figure 7. Size-frequency distribution of snails resident on A. palmata low density (LD)and thicket stands, and Montastraea spp. colonies from all sites censused between 1998and 2001. Median (◊) length and inter-quartile range (├─┤) shown on figure along withtotal number of snails measured.Figure 8. Square-root transformed length of snails (least squares mean ± 95% confidenceinterval) found resident on different host corals (low density (LD) and thicket A. palmatastands, and Montastraea spp.) from all sites censused between 1998 and 2001.Figure 9. Size-frequency distributions of snail populations by year and host. Number ofsnails measured shown on figure. Note different scales on the y-axes.Figure 10. Two-way interaction between the effects of year and host (pooled all sites) onthe length (square root-transformed) of snails (least squares mean ± 95% confidenceinterval). See Table 2 for significance levels and Figure 9 for number of snails measured.Figure 11. Three-way interaction (Table 2) between the effects of year, host and reserveon the length of snails (square-root transformed).Figure 12. Two way interaction between the effects of site and host (pooled years) on thelength (square root transformed) of snails (least squares mean ± 95% confidenceinterval). Circled sites are those located within no-take reserves. See Table 3 forsignificance levels and Figure 14 for number of snails measured.Figure 13. Size-frequency distributions of snail populations by host and site (pooledyears 1998 through 2001). Number of snails measured shown on figure.12
Table 1. Study sites and summary of A. palmata and Montastraea spp. surveys. Initial A.palmata area denotes the reef area surveyed in 1998 (band transects in thickets and rougharea estimated for area occupied by low density (LD) patches). All the low densitystands had regressed in area substantially by 1999. SC=South Carysfort Reef,HS=Horseshoe Reef, LG=Little Grecian Reef, FR=French Reef, ML=Molasses Reef,PI=Pickles Reef. Na=not applicable. Reserve sites are within no-take SanctuaryPreservation Areas (SPA’s) while the Reference sites are fished. Montastraea spp. snailsurveys were discontinued at Little Grecian after the first year because a large collectionof Montastraea spp. snails was made at this site for laboratory studies in Jan 1999.SiteReserveA. palmata StandInitial A. palmata# Montastraea Colonies SurveyedStatusStructureArea Surveyed (m 2 )1998 1999 2000 2001SC Reserve Thicket 240 24 22 19 15HS Reference Thicket 240 18 9 9 13LG Reference Thicket 80 14 NA NA NAFR Reserve LD 308 5 19 40 20ML Reserve LD 552 21 14 22 18PI Reference LD 440 9 11 20 1513
Table 2. Full ‘reserve’ model ANOVA table for year, host (3 levels: LD A. palmata,thicket A. palmata, or Montastraea spp.) and reserve (no-take reserve orreference) effects on snail length (square root transformed).Factor SS df MS F pYear 43.0 3 14.35 34.90
REFERENCES:Aronson RB, Precht W (2001) White band disease and the changing face of Caribbeancoral reefs. Hydrobiologia 460:25-38.Baums IB, Miller MW, Szmant AM (in revision, a) Ecology of a corallivorous gastropodon two scleractinian hosts I: Population structure of snails and corals. Marine Biology.Baums IB, Miller MW, Szmant AM (in revision, b) Ecology of a corallivorous gastropodon two scleractinian hosts II: feeding, respiration and growth. Marine Biology.Causey, B, and 11 others (2000) Status of coral reefs in the US Caribbean and the Gulf ofMexico: Florida, Texas, Puerto Rico, US Virgin Islands, and Navassa. Pages 239-258 inWilkinson, C. (ed) Status of coral reefs of the World: 2000. Australian Institute of MarineScience, Cape Ferguson, Queensland.Diaz-Soltero H (1999) Endangered and threatened species; a revision of candidatespecies list under the Endangered Species Act. Federal Register 64(210):33466-33468.Dustan P, Halas J (1987) Changes in the reef-coral community of Carysfort Reef, KeyLargo, Florida: 1974-1982. Coral Reefs 6:91-106.Jaap WC, Halas JC, Muller RG (1988) Community dynamics of stony corals(Millerporina and Scleractinia) at Key Largo National Marine Sanctuary, Florida, during1981-1986. Proc. 6 th Int. Coral Reef Symp. 2:237-243.Knowlton N, Lang JC, Keller BD (1990) Case study of natural population collapse: posthurricanepredation on Jamaican staghorn corals. Smiths Contrib Mar Sci 31.Smithsonian Institution Press, Washington DC. 25 ppKnowlton N, Lang JC, Rooney MC, Clifford P (1981) Evidence for delayed mortality inhurricane-damaged Jamaican staghorn corals. Nature 294: 251-25215
Miller MW (2001) Corallivorous snail removal: evaluation of impact on Acroporapalmata. Coral Reefs 19:293-295.Miller MW, Bourque AS, Bohnsack JA (in press) An analysis of the loss of Acroporidcorals at Looe Key, Florida, USA: 1983 – 2000. Coral Reefs.Porter JW, Meier OW (1992) Quantification of loss and change in Floridian reef coralpopulations. Am Zool 32: 625-640.16
ACBFig. 117
Live Area Index15000125001000075005000A107118SITE p=0.042HURRICANE p
Total # Colonies + Fragments25020015010050AFRMLPILG0700000600000B1998 1999 2000 2001p=0.042n=4500000Total LAI40000030000020000010000001998 1999 2000 2001Fig.319
Mean Estimated Live Surface (%)70 p=0.0346050403020100476 432 3331998 1999 2001Fig 420
Proportion of Ap with df0.80.70.60.50.40.30.2FRMLPILGHSSCMEAN + 1 SE0.10.101998 1999 2000 2001Proportion of Ap with WBD0.090.080.070.060.050.040.030.020.010.001998 1999 2000 2001Fig. 521
3.53.02.52.01.51.00.5AFRMLPILGHSSCmean + 1SESnail density (#/sampled colony)0.03.53.02.52.01.51.00.50.03.53.02.52.01.51.00.50.0BC(A) (B) (C) (BC)1998 1999 2000 20011998 1999 2000 2001Fig. 6ThicketsLD Stands1998 1999 2000 2001ReserveReference22
Snail length (mm 1/2 )6.05.65.24.84.44.03.6Thicket A. palmataLD A. palmataMontastraea spp.1998 1999 2000 2001Fig. 106.56.0ReserveReferenceSnail length (mm 1/2 )5.55.04.54.03.53.01998 1999 2000 20011998 1999 2000 20011998 1999 2000 2001Thicket A. palmataLD A. PalmataMontastraea spp.Fig. 1125
Snail length (mm 1/2 )5.85.65.45.25.04.84.64.44.24.03.83.6SC HS LG ML FR PISiteThicket A. palmataLD A. palmataMontastraea spp.Fig. 1226
Number of snails by hostAcropora palmataMontastraea spp.18161412108642090807060504030201002045353022Thicket N=229 18 Thicket N=208 Thicket40 N=518 LD N=280 LD N=353 20 LD30162518351425163020141225201210152081510156108106410255542000005 12 19 26 33 40 47SC262422201816141210864205 12 19 26 33 40 47HS7N=498 N=147N=41N=15065432105 12 19 26 33 40 47LG26242220181614121086420Snail length (mm)5 12 19 26 33 40 47ML353025201510505 12 19 26 33 40 47FRN=22440353025201510505 12 19 26 33 40 47PIN=181N=251Fig. 1327


![Right Whale Fact Sheet [PDF] - Southeast Regional Office - NOAA](https://img.yumpu.com/28432664/1/190x245/right-whale-fact-sheet-pdf-southeast-regional-office-noaa.jpg?quality=85)