Quasi-stationary numerical model of the dielectric barrier discharge
Quasi-stationary numerical model of the dielectric barrier discharge
Quasi-stationary numerical model of the dielectric barrier discharge

You also want an ePaper? Increase the reach of your titles
YUMPU automatically turns print PDFs into web optimized ePapers that Google loves.
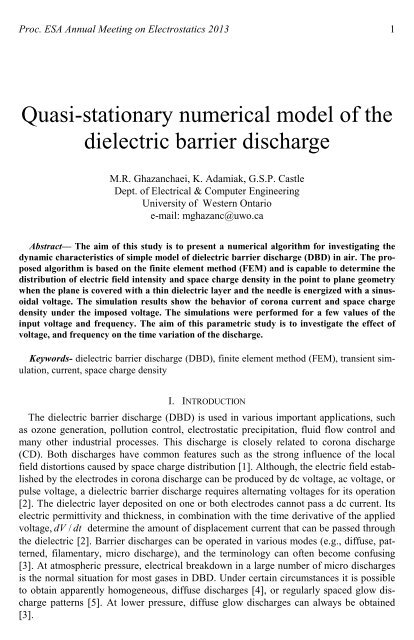
Proc. ESA Annual Meeting on Electrostatics 2013 1<strong>Quasi</strong>-<strong>stationary</strong> <strong>numerical</strong> <strong>model</strong> <strong>of</strong> <strong>the</strong><strong>dielectric</strong> <strong>barrier</strong> <strong>discharge</strong>M.R. Ghazanchaei, K. Adamiak, G.S.P. CastleDept. <strong>of</strong> Electrical & Computer EngineeringUniversity <strong>of</strong> Western Ontarioe-mail: mghazanc@uwo.caAbstract— The aim <strong>of</strong> this study is to present a <strong>numerical</strong> algorithm for investigating <strong>the</strong>dynamic characteristics <strong>of</strong> simple <strong>model</strong> <strong>of</strong> <strong>dielectric</strong> <strong>barrier</strong> <strong>discharge</strong> (DBD) in air. The proposedalgorithm is based on <strong>the</strong> finite element method (FEM) and is capable to determine <strong>the</strong>distribution <strong>of</strong> electric field intensity and space charge density in <strong>the</strong> point to plane geometrywhen <strong>the</strong> plane is covered with a thin <strong>dielectric</strong> layer and <strong>the</strong> needle is energized with a sinusoidalvoltage. The simulation results show <strong>the</strong> behavior <strong>of</strong> corona current and space chargedensity under <strong>the</strong> imposed voltage. The simulations were performed for a few values <strong>of</strong> <strong>the</strong>input voltage and frequency. The aim <strong>of</strong> this parametric study is to investigate <strong>the</strong> effect <strong>of</strong>voltage, and frequency on <strong>the</strong> time variation <strong>of</strong> <strong>the</strong> <strong>discharge</strong>.Keywords- <strong>dielectric</strong> <strong>barrier</strong> <strong>discharge</strong> (DBD), finite element method (FEM), transient simulation,current, space charge densityI. INTRODUCTIONThe <strong>dielectric</strong> <strong>barrier</strong> <strong>discharge</strong> (DBD) is used in various important applications, suchas ozone generation, pollution control, electrostatic precipitation, fluid flow control andmany o<strong>the</strong>r industrial processes. This <strong>discharge</strong> is closely related to corona <strong>discharge</strong>(CD). Both <strong>discharge</strong>s have common features such as <strong>the</strong> strong influence <strong>of</strong> <strong>the</strong> localfield distortions caused by space charge distribution [1]. Although, <strong>the</strong> electric field establishedby <strong>the</strong> electrodes in corona <strong>discharge</strong> can be produced by dc voltage, ac voltage, orpulse voltage, a <strong>dielectric</strong> <strong>barrier</strong> <strong>discharge</strong> requires alternating voltages for its operation[2]. The <strong>dielectric</strong> layer deposited on one or both electrodes cannot pass a dc current. Itselectric permittivity and thickness, in combination with <strong>the</strong> time derivative <strong>of</strong> <strong>the</strong> appliedvoltage, dV / dt determine <strong>the</strong> amount <strong>of</strong> displacement current that can be passed through<strong>the</strong> <strong>dielectric</strong> [2]. Barrier <strong>discharge</strong>s can be operated in various modes (e.g., diffuse, patterned,filamentary, micro <strong>discharge</strong>), and <strong>the</strong> terminology can <strong>of</strong>ten become confusing[3]. At atmospheric pressure, electrical breakdown in a large number <strong>of</strong> micro <strong>discharge</strong>sis <strong>the</strong> normal situation for most gases in DBD. Under certain circumstances it is possibleto obtain apparently homogeneous, diffuse <strong>discharge</strong>s [4], or regularly spaced glow <strong>discharge</strong>patterns [5]. At lower pressure, diffuse glow <strong>discharge</strong>s can always be obtained[3].
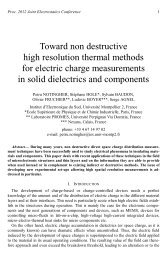
Proc. ESA Annual Meeting on Electrostatics 2013 2One interesting application <strong>of</strong> DBD is in an electrostatic precipitator (ESP) [6]. Electricalbehavior <strong>of</strong> <strong>the</strong> precipitator has been investigated in an experimental set up, and <strong>the</strong> currentwaveform <strong>of</strong> <strong>the</strong> <strong>discharge</strong> was recorded. Effects <strong>of</strong> voltage and AC frequency on <strong>the</strong>extent and propagation velocity <strong>of</strong> <strong>the</strong> <strong>discharge</strong> have been investigated experimentally.Sensitivity analysis showed that <strong>the</strong> particle collection efficiency <strong>of</strong> <strong>the</strong> ESP increaseswith <strong>the</strong> applied voltage. However, it depends on <strong>the</strong> frequency and for both low and veryhigh frequency <strong>the</strong> precipitation efficiency decreases. A few geometric and parametricstudies have been done in order to investigate <strong>the</strong> effect <strong>of</strong> <strong>discharge</strong> channel geometry.Studies were carried out for different thicknesses, lengths and numbers <strong>of</strong> tubes. The dissipatedpower has been calculated in <strong>the</strong> system. Although <strong>the</strong>se results look promising,<strong>the</strong>re is no equivalent circuit <strong>model</strong> or <strong>numerical</strong> algorithm presented in this study and all<strong>the</strong> works are based on experimental results [7]. Very little work has been carried out inorder to analyze <strong>the</strong> effect <strong>of</strong> <strong>the</strong> ionic wind on <strong>the</strong> particle collection efficiency, and toinvestigate <strong>the</strong> correlation between <strong>the</strong> EHD flow and <strong>the</strong> collection efficiency [8]. Theeffects <strong>of</strong> <strong>the</strong> geometry <strong>of</strong> <strong>the</strong> <strong>dielectric</strong> <strong>barrier</strong> <strong>discharge</strong> have been investigated by a fewauthors [9]. Despite <strong>the</strong>se widespread applications, <strong>the</strong>re is no reliable and accurate <strong>numerical</strong><strong>model</strong> for <strong>the</strong> computer simulation <strong>of</strong> this phenomenon. A few <strong>numerical</strong> techniquesfor <strong>model</strong>ing DBD have been reported in <strong>the</strong> literature and <strong>the</strong>y vary ei<strong>the</strong>r withrespect to <strong>the</strong> applications or <strong>the</strong> memory requirements, computation speed and accuracy.A 1D <strong>model</strong> for <strong>the</strong> DBD has been developed based on <strong>the</strong> <strong>numerical</strong> solution <strong>of</strong> <strong>the</strong> electronand ion continuity and momentum transfer equations coupled to Poisson’s equation[10]. This <strong>model</strong> gave space and time variations in <strong>the</strong> electric field, and <strong>the</strong> electron andion densities. The charge accumulation on <strong>the</strong> <strong>dielectric</strong> and <strong>the</strong> voltage boundary conditionsfor <strong>dielectric</strong>s have been derived by considering an equivalent circuit <strong>of</strong> <strong>the</strong> gas gapin series with <strong>the</strong> equivalent capacitor <strong>of</strong> <strong>the</strong> <strong>dielectric</strong>. Complications in <strong>model</strong>ing <strong>the</strong><strong>dielectric</strong> <strong>barrier</strong> <strong>discharge</strong> are generally related to <strong>the</strong> complexity <strong>of</strong> reactions in <strong>the</strong> ionizationlayer and randomness <strong>of</strong> <strong>the</strong> <strong>discharge</strong> regime in some configurations. In order toovercome <strong>the</strong>se problems, a single species DBD <strong>model</strong> for a point to plane configurationis presented in this paper. The Finite Element Method (FEM) was used to solve <strong>the</strong> governingequations for both <strong>the</strong> electric field and distribution <strong>of</strong> unipolar space charge using<strong>the</strong> COMSOL multi-physics commercial s<strong>of</strong>tware. The basic characteristics <strong>of</strong> <strong>the</strong> <strong>discharge</strong>,including <strong>the</strong> total current, electric field distribution, surface charge accumulation,and space charge density distributions are reported. In addition a sensitivity analysis wascarried out to show <strong>the</strong> effect <strong>of</strong> <strong>the</strong> voltage frequency and amplitude on <strong>the</strong> <strong>discharge</strong>characteristics. In section II, <strong>the</strong> governing equation and ma<strong>the</strong>matical <strong>model</strong> for DBD ispresented, in section III, <strong>the</strong> <strong>numerical</strong> algorithm is described. Simulation results are illustratedin section IV, and finally <strong>the</strong> conclusions are presented.A. Governing EquationsII. MATHEMATICAL MODELFig.1 shows a typical configuration for <strong>dielectric</strong> <strong>barrier</strong> <strong>discharge</strong> in <strong>the</strong> point toplane geometry.
Proc. ESA Annual Meeting on Electrostatics 2013 3Fig.1. Typical configuration for DBD investigated in this studyA hemispherical needle is perpendicular to an infinitely large plate at a distance D with atip radius curvature R and length L. A sinusoidal electric potential with <strong>the</strong> maximum value<strong>of</strong> V max is applied to <strong>the</strong> needle. The ambient gas is air at room temperature and atmosphericpressure. As this is a single species <strong>model</strong>, it is assumed that <strong>the</strong> ionization layercan be neglected and positive or negative ions with constant mobility are assumed to beinjected from <strong>the</strong> corona electrode. In <strong>the</strong> absence <strong>of</strong> magnetic fields, <strong>the</strong> equations governing<strong>the</strong> electric field are [11]:∇. D → = ρ(1)∂ρ. J = −∂t∇ →→ →D = 0 Eε(3)→E = −∇Vwhere → D is <strong>the</strong> electrostatic displacement, ρ is <strong>the</strong> space charge density, → J is <strong>the</strong> electriccurrent density, ε is <strong>the</strong> gas permittivity, E → is <strong>the</strong> electric field and V is <strong>the</strong> electric potential.The electric field is thus governed by Poisson’s0equation:ρε2∇ V = −(5)0The ionic charges are accelerated by <strong>the</strong> Coulomb force and move towards <strong>the</strong> groundplates. The charge drift creates an electric current with a density defined as:→→ →J = ρ⎛µ⎞⎜ E+u⎟ − D∇ρ(6)⎝ ⎠2where J → 22( A/ m ) is <strong>the</strong> current density, µ ( m / V.s)is <strong>the</strong> mobility <strong>of</strong> ions, D ( m / s)→<strong>the</strong> ions diffusion coefficient and u ( m / s)is <strong>the</strong> gas velocity. Three terms on <strong>the</strong> righthand side <strong>of</strong> Eq. (6) are drift, convection and diffusion currents, respectively. D is <strong>the</strong>(2)(4)is
Proc. ESA Annual Meeting on Electrostatics 2013 4diffusion coefficient and is equal to:wherek T.µBD = (7)eB0k is <strong>the</strong> Boltzmann constant equal to 1.38065×10 -23 2 2( m k g/ s . K ), T is <strong>the</strong> absolutetemperature, e is <strong>the</strong> electron charge, equal to 1.602×10 -19 (C).0Since <strong>the</strong> drift velocity <strong>of</strong> ions in Eq. (6) is usually about two orders <strong>of</strong> magnitude largerthan <strong>the</strong> typical velocity <strong>of</strong> <strong>the</strong> gas flow, <strong>the</strong> convective component in <strong>the</strong> ionic currentdensity can be neglected, so:→→J = ρµ E−D∇ρ(8)Eq. (8) can be substituted into (2) to derive <strong>the</strong> continuity equation,→∂ρ+ ∇. ⎛⎞⎜ ρµ E−D∇ρ⎟ = 0∂t⎝⎠Therefore, <strong>the</strong> electric problem <strong>of</strong> <strong>the</strong> corona <strong>discharge</strong> is governed by a set <strong>of</strong> two partialdifferential equations with two unknown distributions: Eq. (5) with <strong>the</strong> unknown potentialV and Eq. (9) with <strong>the</strong> unknown space charge density ρ .B. Complementary equations for <strong>model</strong>ing <strong>dielectric</strong> <strong>barrier</strong> <strong>discharge</strong>The main point in simulating DBD is to include surface charge accumulation on <strong>the</strong><strong>dielectric</strong> surface. This surface charge produces a field directed against <strong>the</strong> electric fielddue to <strong>the</strong> voltage source to an extent that <strong>the</strong> ionization eventually stops. To include thischoking action <strong>of</strong> <strong>the</strong> <strong>dielectric</strong> <strong>barrier</strong> it is necessary to introduce an additional boundarycondition which can treat charge accumulation at <strong>the</strong> <strong>dielectric</strong> surface and <strong>the</strong> resultinglocal reduction <strong>of</strong> <strong>the</strong> electric field in <strong>the</strong> <strong>discharge</strong> gap. As soon as <strong>the</strong> field falls below<strong>the</strong> value necessary to sustain ionization <strong>the</strong> <strong>discharge</strong> ceases. The critical interfaceboundary condition for DBD is accentuated by <strong>the</strong> dominant electrical field. The surfacecharge accumulation plays a controlling role for <strong>the</strong> self-limiting feature <strong>of</strong> DBD for transitionfrom <strong>discharge</strong> to spark. According to Maxwell equations, <strong>the</strong> tangential and normalcomponents <strong>of</strong> <strong>the</strong> electrical intensity and electrical displacement at <strong>the</strong> interface <strong>of</strong>air and <strong>dielectric</strong> material must satisfy <strong>the</strong> following conditions [12]:→×( − ) = 0n E dE a(10)→n×( D d− D a) = ρsIn <strong>the</strong> above equations, <strong>the</strong> subscripts d and a, correspond to <strong>dielectric</strong> or air. The timederivative <strong>of</strong> surface charge density is related to <strong>the</strong> normal current density:(9)(11)ρ→ →s(12)∂∂t= n.JThe current density → J is defined in Eq. (8), so, <strong>the</strong> surface charge accumulation is calculatedby:
Proc. ESA Annual Meeting on Electrostatics 2013 5ρ s= ∫ J n. dt + C0(13)C. Boundary ConditionsThe boundary conditions for <strong>the</strong> potential are very straightforward: a given electricpotential (V ap ) on <strong>the</strong> corona electrode and zero on <strong>the</strong> ground plane [13]:V = V ap on <strong>the</strong> corona electrode,V = 0 on <strong>the</strong> ground plate.The value <strong>of</strong> space charge density at different points <strong>of</strong> <strong>the</strong> corona electrode is <strong>the</strong> onlyrequired boundary condition for space charge density. However, formulation <strong>of</strong> properboundary conditions for <strong>the</strong> space charge density is not so easy because <strong>the</strong> ionizationlayer has been neglected. One possible approach is to use Kaptzov’s hypo<strong>the</strong>sis, whichcan be used to create a simple algorithm, which helps to establish <strong>the</strong> charge injectionlaw. Kaptzov suggested that if <strong>the</strong> corona <strong>discharge</strong> occurs at some point on <strong>the</strong> electrodeand charge is injected, <strong>the</strong> electric field at this point remains at <strong>the</strong> value it takes at <strong>the</strong>corona onset.The potential <strong>of</strong> <strong>the</strong> electrode at <strong>the</strong> point where <strong>the</strong> very first time charge is injected to<strong>the</strong> domain defines <strong>the</strong> corona onset level, and <strong>the</strong> corresponding value <strong>of</strong> <strong>the</strong> electricfield will be <strong>the</strong> critical electric field, which remains nearly constant during <strong>the</strong> <strong>discharge</strong>.In highly symmetrical arrangements <strong>of</strong> electrodes, for example hemispherical ones, <strong>the</strong>reexists an analytical solution for <strong>the</strong> onset electric field. The result is known as Peek’sequation and in air it has <strong>the</strong> following form:⎛ ⎞= ×4 0.308(14)E 3.1 10 δ⎜1+⎟0⎝ 0.5δR⎠where δ = T P /TP , R is <strong>the</strong> electrode radius in cm, T0 00 <strong>the</strong> standard temperature, T <strong>the</strong>actual temperature, P 0 <strong>the</strong> standard pressure and P <strong>the</strong> actual pressure <strong>of</strong> gas. It must beemphasized that Peek’s equation can be used only, if <strong>the</strong> electric field is <strong>the</strong> same at allpoints <strong>of</strong> <strong>the</strong> <strong>discharge</strong> electrodes.The values <strong>of</strong> <strong>the</strong> charge density should be selected in order to satisfy <strong>the</strong> Kaptzov condition.The electrode tip has a spherical shape, but <strong>the</strong> electric field is not constant andslightly varies from one point <strong>of</strong> <strong>the</strong> surface to ano<strong>the</strong>r. Formally speaking <strong>the</strong> coronaonset voltage and critical electric field would have to be different at all points. However,for <strong>the</strong> simplification <strong>of</strong> <strong>the</strong> algorithm, a constant critical electric field has been assumed.The initial density <strong>of</strong> <strong>the</strong> space charge has to be guessed, or taken from a previous solutionat similar conditions. After <strong>the</strong> problem is solved <strong>the</strong> electric field on <strong>the</strong> electrodesurface is compared with Peek’s value and <strong>the</strong> electric charge updated. While some wellfoundedtechniques are <strong>of</strong>ten advised <strong>the</strong> following simple formula proved to be very effective[13]:( E − )ρ = ρ + β × Enew old0(15)where β is an experimentally found constant. Practically speaking, this approach providesan indirect boundary condition for space charge density. Its distribution on <strong>the</strong> coronaelectrode surface is iterated until <strong>the</strong> corona electrode electric field is sufficientlyclose to Peek’s value.
Proc. ESA Annual Meeting on Electrostatics 2013 6III. NUMERICAL ALGORITHMThe processes occurring in <strong>the</strong> <strong>dielectric</strong> <strong>barrier</strong> <strong>discharge</strong> during a cycle <strong>of</strong> AC voltageare more complicated than that for a corona <strong>discharge</strong>. By applying an electric fieldlarger than <strong>the</strong> breakdown field local ionization in <strong>the</strong> gap is formed, which initiates <strong>the</strong>current in <strong>the</strong> domain. During <strong>the</strong> positive half cycle this current causes negative ions todeposit on <strong>the</strong> needle, and positive ions to accumulate on <strong>the</strong> <strong>dielectric</strong>. So, <strong>the</strong> total electricfield intensity is a combination <strong>of</strong> <strong>the</strong> electric field produced by <strong>the</strong> voltage sourceand <strong>the</strong> field produced by <strong>the</strong> space charge collected on <strong>the</strong> <strong>dielectric</strong> surface. As <strong>the</strong><strong>discharge</strong> progresses <strong>the</strong> charge accumulated on <strong>the</strong> <strong>dielectric</strong> surface reduces <strong>the</strong> localelectric field to such an extent that ionization stops and <strong>the</strong> current is choked. When <strong>the</strong>sign <strong>of</strong> voltage reverses, <strong>the</strong> source field reinforces <strong>the</strong> field due to surface accumulation.This enhanced field at <strong>the</strong> beginning <strong>of</strong> <strong>the</strong> new half cycle initiates a new current, whichtransfers charge to <strong>the</strong> <strong>dielectric</strong> surface until <strong>the</strong> opposing space-charge field once againextinguishes <strong>the</strong> ionic current across <strong>the</strong> gap [14].Following this description, a <strong>numerical</strong> algorithm for <strong>the</strong> <strong>dielectric</strong> <strong>barrier</strong> <strong>discharge</strong> simulationwas developed. The algorithm for solving <strong>the</strong> space charge density follows aniterative approach. The simulation starts from some initial guess <strong>of</strong> <strong>the</strong> space charge density,and <strong>the</strong>n <strong>the</strong> conventional FEM procedure is employed to obtain <strong>the</strong> Poisson component<strong>of</strong> <strong>the</strong> electric potential in Eq.(5) while a high voltage is applied to corona needleand <strong>the</strong> ground plate is kept at zero potential. After calculating V, <strong>the</strong> electric field is calculatedby differentiating <strong>the</strong> potential distribution. Using <strong>the</strong> values <strong>of</strong> electric field, <strong>the</strong>new charge density distribution is obtained by solving Eq. (15). This process continuesand <strong>the</strong> iterative algorithm updates <strong>the</strong> injected charge density on <strong>the</strong> corona electrodesurface until <strong>the</strong> electric field values are sufficiently close to Peek’s value. Finally, alllocal parameters <strong>of</strong> <strong>the</strong> electric <strong>dielectric</strong> <strong>barrier</strong> <strong>discharge</strong>, including <strong>the</strong> space chargedensity, <strong>the</strong> current density, <strong>the</strong> electric field and <strong>the</strong> potential for every point in <strong>the</strong> simulationdomain can be obtained. It should be noted that <strong>the</strong> electric field varies strongly inboth space and time. Near <strong>the</strong> <strong>discharge</strong> electrode <strong>the</strong> electric field variation is particularlysteep which demands a very fine spatial mesh, while in <strong>the</strong> remaining region <strong>the</strong> electricfield variation is more uniform. A non-uniform spatial mesh is <strong>the</strong>refore essential foran accurate <strong>numerical</strong> treatment near <strong>the</strong> electrodes and <strong>the</strong> air gap. In addition, <strong>the</strong> <strong>numerical</strong>algorithm for determining space charge density should fulfill few requirements[11]. It should give positive, accurate results, free from nonphysical density fluctuationand <strong>numerical</strong> diffusion, should be computationally efficient, and should be easily adoptedfor any geometry.A. CurrentThe formula for <strong>the</strong> <strong>discharge</strong> current induced due to <strong>the</strong> motion <strong>of</strong> ions between electrodeshas been derived from an energy balance equation. In this study, a formula for <strong>the</strong><strong>discharge</strong> current is derived for general electrode geometry from <strong>the</strong> energy balanceequation in which <strong>the</strong> displacement current is explicitly taken into account. → E is electricfield modified by <strong>the</strong> space charge:→→→'E = E s+E(16)
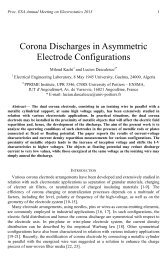
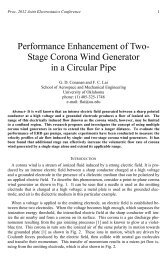
Proc. ESA Annual Meeting on Electrostatics 2013 7where → E s is <strong>the</strong> static applied field without effect <strong>of</strong> charge transport and → E ' is <strong>the</strong> fieldproduced by <strong>the</strong> space charge. It is already assumed that this study is based on singlespecies <strong>model</strong> without <strong>the</strong> effect <strong>of</strong> electrons. By doing few simplifications <strong>the</strong> currentequation could be calculated as follow [15]:1'→ →I = ∫∫∫ ρµ E.E s dv(17)V apThe sinusoidal voltage (V ap ) was defined based on <strong>the</strong> following equation:V ap= Vmaxsin( 2πft)Fig. 2 shows <strong>the</strong> distribution <strong>of</strong> electric field intensity on <strong>the</strong> tip <strong>of</strong> <strong>the</strong> needle for differenttime steps. As it is obvious for all <strong>the</strong> times and voltages, <strong>the</strong> maximum value forV / m .electric field intensity is close to Peek’s value <strong>of</strong> 1.623×10 7 ( )Fig.2. Electric field intensity on <strong>the</strong> tip <strong>of</strong> needle for different values <strong>of</strong> voltage above onset with effect <strong>of</strong>charge injectionTo have a better understanding <strong>of</strong> this issue, distribution <strong>of</strong> <strong>the</strong> electric field intensity on<strong>the</strong> tip <strong>of</strong> <strong>the</strong> needle without injecting <strong>the</strong> charge (<strong>the</strong> Laplace equation) is shown in Fig.3. The main point in Fig. 3 is that for Laplacian <strong>model</strong> <strong>the</strong> maximum electric field intensityis a function <strong>of</strong> <strong>the</strong> applied voltage. A larger value <strong>of</strong> <strong>the</strong> applied voltage results in agreater value for electric field.Fig.3. Electric field intensity on <strong>the</strong> tip <strong>of</strong> needle for different values <strong>of</strong> voltages above onset without effect <strong>of</strong>charge injection
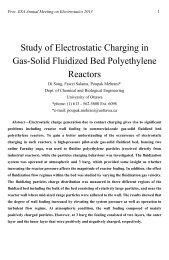
Proc. ESA Annual Meeting on Electrostatics 2013 8IV. SIMULATION RESULTSIn this study, a hemispherical needle L=1cm, is placed perpendicular to <strong>the</strong> aluminum platewith 25 cm radius at <strong>the</strong> distance D = 3.1cm. The radius curvature R <strong>of</strong> <strong>the</strong> tip <strong>of</strong> <strong>the</strong> needle is95µm. A <strong>dielectric</strong> layer with thickness <strong>of</strong> 1mm is assumed to be placed on <strong>the</strong> ground plate,and <strong>the</strong> relative permittivity <strong>of</strong> this material is 6. At <strong>the</strong> room temperature and atmosphericpressure <strong>the</strong> corona onset voltage for this configuration is evaluated to be 3.1kV. The highvoltage supplied to <strong>the</strong> needle varied between <strong>the</strong> corona onset level and 8 kV. The frequency<strong>of</strong> <strong>the</strong> basic <strong>model</strong> is 5 kHz.The first simulation was done for <strong>the</strong> maximum input voltage <strong>of</strong> 7.5 kV and <strong>the</strong> frequency <strong>of</strong> 5kHz. Total corona current between both electrodes and <strong>the</strong> distribution <strong>of</strong> <strong>the</strong> charge densityon <strong>the</strong> ground plate were calculated. The waveform <strong>of</strong> injected voltage is shown in Fig. 4.Fig.4. Applied voltageFig. 5 shows <strong>the</strong> distribution <strong>of</strong> <strong>the</strong> electric field intensity with and without <strong>the</strong> effect <strong>of</strong>accumulated charges in space and on <strong>the</strong> surface <strong>of</strong> <strong>the</strong> <strong>dielectric</strong>:Fig.5. Electric field intensity with and without effect <strong>of</strong> injected charge on <strong>the</strong> needle’s tipTwo observations are dominant in <strong>the</strong> figure above. First, <strong>the</strong> electric field is distorted dueto effect <strong>of</strong> injected space charge from <strong>the</strong> tip <strong>of</strong> <strong>the</strong> needle and <strong>the</strong> accumulated surfacecharge on <strong>the</strong> <strong>dielectric</strong>. The major effect <strong>of</strong> such distortion at this level <strong>of</strong> voltage is on
Proc. ESA Annual Meeting on Electrostatics 2013 9<strong>the</strong> electric field intensity above Peek’s value before voltage zero crossing. So, it wasobserved that for this level <strong>of</strong> voltage and frequency <strong>the</strong> current is shifted with respect to<strong>the</strong> voltage and it has been shown in Fig. 6:Fig.6. Waveform <strong>of</strong> <strong>the</strong> <strong>discharge</strong> currentThe second one is that although <strong>the</strong> electric field magnitude is not exactly equal to Peek’svalue at all <strong>the</strong> points on <strong>the</strong> needle’s tip, but, as stated before, <strong>the</strong> iterative algorithm isused to modify <strong>the</strong> injected charge and as a result <strong>the</strong> difference between <strong>the</strong> highest valueabove onset value is very small.In Fig. 7 <strong>the</strong> total space charge in <strong>the</strong> air gap is shown as a function <strong>of</strong> time:Fig.7. Distribution <strong>of</strong> space charge in <strong>the</strong> air gapIn first positive half cycle since <strong>the</strong>re is no charge in <strong>the</strong> system, <strong>the</strong>re is a short time delaybefore <strong>the</strong> charge injection occurs to <strong>the</strong> domain. This charge reaches its maximumand after that <strong>the</strong> negative ions are injected in <strong>the</strong> negative half cycle. There is a zerocrossing in this figure that shows <strong>the</strong> net amount <strong>of</strong> negative and positive ions is equal.This is really important to note that this point does not coincide with <strong>the</strong> zero crossing in<strong>the</strong> absorbed current. Also <strong>the</strong> sign <strong>of</strong> <strong>the</strong> current follows <strong>the</strong> sign <strong>of</strong> <strong>the</strong> electric field intensitieswith and without effect <strong>of</strong> charge and in a specific point equals to zero. It is obviousthat after couple <strong>of</strong> periods <strong>the</strong> total space charge in <strong>the</strong> domain for both negativeand positive cycles stabilizes.
Proc. ESA Annual Meeting on Electrostatics 2013 10By using <strong>the</strong> surface charge accumulation output from <strong>the</strong> COMSOL program, and applying<strong>the</strong> integral on <strong>the</strong> surface <strong>of</strong> <strong>the</strong> <strong>dielectric</strong>, <strong>the</strong> total surface charge on <strong>the</strong> <strong>dielectric</strong> isshown in Fig. 8.Fig.8. Accumulated surface charge on <strong>dielectric</strong> layerFig. 9 shows <strong>the</strong> space charge density distribution in <strong>the</strong> air gap along <strong>the</strong> axis <strong>of</strong> symmetry.It is an important note in <strong>the</strong> <strong>model</strong> that at high frequencies, <strong>the</strong> transition timefrom positive to negative cycle is smaller than <strong>the</strong> time that is needed for charge transport,so, at some points in <strong>the</strong> simulation <strong>the</strong>re are negative charges already in <strong>the</strong> domain andpositive charges start to be injected from <strong>the</strong> needle and vice versa. At a frequency <strong>of</strong> 50Hz <strong>the</strong> importance <strong>of</strong> this note is not that much, because ions with specific polarity haveenough time to settle on <strong>the</strong> collector before <strong>the</strong> needle starts to inject ions with oppositepolarity on <strong>the</strong> next half cycle <strong>of</strong> voltage.Fig.9. Distribution <strong>of</strong> space charge along <strong>the</strong> axis <strong>of</strong> symmetryNote that at t=4.01×10 -5 (s) (<strong>the</strong> positive half-cycle) just positive ions in <strong>the</strong> domain exist.For o<strong>the</strong>r values (for example t=1.15×10 -4 (s), and t=2.15×10 -4 (s)), both positive andnegative are present. For t=1.95×10 -4 (s) negative ions are dominant.
Proc. ESA Annual Meeting on Electrostatics 2013 11If all <strong>the</strong> parameters are kept <strong>the</strong> same as previous <strong>model</strong> but <strong>the</strong> level <strong>of</strong> voltage changesto lower values (V max = 3.2 kV) which is around <strong>the</strong> onset voltage, <strong>the</strong> shape <strong>of</strong> current isshown in Fig 10.Fig.10. Shape <strong>of</strong> current just above onset voltage at 5 kHzThis figure is very interesting, as <strong>the</strong> maximum voltage is just above onset level, so, after<strong>the</strong> voltage goes above <strong>the</strong> onset a small amount <strong>of</strong> charges are injected to <strong>the</strong> domain,and after that injection stops. As a result, current starts to decrease and <strong>the</strong> convectioncurrent still continues until <strong>the</strong> next half cycle when <strong>the</strong>re is a charge injection in <strong>the</strong> oppositedirection. Fig. 11 shows <strong>the</strong> total space charge for <strong>the</strong> above case:Fig.11. Total space charge in domain just above onset voltage at 5 kHzAs it is shown <strong>the</strong> shape <strong>of</strong> <strong>the</strong> total charge in <strong>the</strong> domain is nearly <strong>the</strong> same as <strong>the</strong> basic<strong>model</strong>, but <strong>the</strong> maximum value for positive and negative ions after few cycles is few timesless than <strong>the</strong> previous case. For V max =3.2 [kV], and frequency 50 Hz <strong>the</strong> simulation resultsare shown in Fig. 12.
Proc. ESA Annual Meeting on Electrostatics 2013 12Fig.12. Shape <strong>of</strong> current just above onset voltage at 50 HzHere <strong>the</strong>re is charge injection, and some current in <strong>the</strong> domain. However after <strong>the</strong> field at<strong>the</strong> tip falls below <strong>the</strong> onset value <strong>the</strong>re is only convection current in <strong>the</strong> domain and <strong>the</strong>charge has enough time to be all absorbed by <strong>the</strong> <strong>dielectric</strong> layer. Here, almost all <strong>the</strong>charges in <strong>the</strong> domain are accumulated on <strong>the</strong> surface before <strong>the</strong> needle starts to injectcharge in next half cycle voltage. In Fig. 13 <strong>the</strong> shape <strong>of</strong> total charge in domain is shown.Two differences are observed in this one in compared to <strong>the</strong> two previous cases. First <strong>of</strong>all <strong>the</strong> settling time, in this case is almost one cycle, and <strong>the</strong> second one is about <strong>the</strong> sign<strong>of</strong> space charge in domain. As it has been shown, in positive half cycle, positive ions areinjected to <strong>the</strong> domain, after <strong>the</strong> point that voltage drops below onset voltage, up to <strong>the</strong>next half cycle, all charges in domain have enough time to accumulate on <strong>the</strong> <strong>dielectric</strong>layer and <strong>the</strong>re is almost no charge with opposite sign in <strong>the</strong> domain. Because <strong>of</strong> this <strong>the</strong>current rises abruptly and <strong>the</strong>n decays, and at some points in <strong>the</strong> cycle <strong>the</strong>re is no chargein <strong>the</strong> system to produce current, and <strong>the</strong> current drops to zero.Fig.13. Total space charge just above onset voltage at 50 Hz
Proc. ESA Annual Meeting on Electrostatics 2013 13Fig. 14 shows <strong>the</strong> variation <strong>of</strong> <strong>the</strong> total space charge and maximum current at <strong>the</strong> fixedfrequency and for different level <strong>of</strong> voltages. As was expected at <strong>the</strong> voltage levels below<strong>the</strong> onset voltage almost <strong>the</strong>re is no charge injection and as a result <strong>the</strong>re is no current indomain. But when <strong>the</strong> voltage is increased above <strong>the</strong> onset level <strong>the</strong> total corona currentincreases faster than linearly with <strong>the</strong> voltage. The total charge curve is almost linear.Fig.14. Maximum current (left hand side) and maximum space charge (right hand side) in domain at differentvoltages and at 5 kHzFig. 15 shows <strong>the</strong> variation <strong>of</strong> <strong>the</strong> total space charge and maximum current at <strong>the</strong> fixedvoltage and for different level <strong>of</strong> frequencies. As <strong>the</strong> level <strong>of</strong> frequency goes up, <strong>the</strong> currentlevel increases due to <strong>the</strong> fact that transition time from positive cycle to negative cyclegets smaller and continuous clouds <strong>of</strong> positive and negative ions are going to beformed. But, <strong>the</strong> net charge in whole domain is smaller at higher frequencies, because atlower frequencies ions with <strong>the</strong> same polarity are dominant in a half cycle, and startingfrom following cycle almost all <strong>the</strong> ions are settled on <strong>dielectric</strong> layer.Fig.15. Maximum current (left hand side) and maximum space charge (right hand side) in domain at differentfrequencies and at 7.5 kVV. CONCLUSIONSIn this paper, a quasi-<strong>stationary</strong> single-species FEM <strong>model</strong> for simulating <strong>the</strong> <strong>dielectric</strong><strong>barrier</strong> <strong>discharge</strong> has been proposed. The governing equations considering <strong>the</strong> effect <strong>of</strong>surface charge accumulation was developed. For <strong>the</strong> charge transport <strong>model</strong> a partialdifferential equation with <strong>the</strong> effect <strong>of</strong> diffusion coefficient was employed and artificialdiffusion has been added to obtain a stable algorithm. The main objectives <strong>of</strong> this studyare <strong>the</strong> investigation on <strong>the</strong> electrical behavior <strong>of</strong> <strong>the</strong> system including electric field in-
Proc. ESA Annual Meeting on Electrostatics 2013 14tensity, space charge distribution, surface charge accumulation, and total absorbed current.Sensitivity analysis <strong>of</strong> voltage and frequency level has been carried out in order toinvestigate <strong>the</strong> time variation <strong>of</strong> <strong>the</strong> <strong>discharge</strong>. The results show <strong>the</strong> behavior <strong>of</strong> <strong>the</strong> coronacurrent and space charge density for sinusoidal voltage at different frequencies andvoltage levels. In <strong>the</strong> basic <strong>model</strong>, <strong>the</strong> current shifting in a system with a <strong>dielectric</strong><strong>barrier</strong>l was shown based on <strong>the</strong> effect <strong>of</strong> <strong>the</strong> reverse electric field produced by surfacecharge accumulation. Also it was shown that for higher frequencies a combination <strong>of</strong>positive and negative ions have contributions on to <strong>the</strong> current generation. In this study<strong>the</strong> shape <strong>of</strong> <strong>the</strong> current waveform for both positive and negative voltage half cycles have<strong>the</strong> same shape because <strong>of</strong> <strong>the</strong> fact that this is based on <strong>the</strong> single species glow <strong>dielectric</strong><strong>discharge</strong>. So, <strong>the</strong>re is no sign <strong>of</strong> fast rise Trichel like pulses in <strong>the</strong> negative half cycle.By sensitivity analysis on <strong>the</strong> voltage level, it was also shown that as expected, largerinput voltage results in a larger current in <strong>the</strong> circuit. The average current depends on <strong>the</strong>frequency as well and increases as <strong>the</strong> frequency <strong>of</strong> input voltage increases.REFERENCES[1] Ulrich Kogelschatz, Dielectric-<strong>barrier</strong> Discharges: Their History, Discharge Physics, and Industrial Applications,Plasma Chemistry and Plasma Processing, Vol. 23, No. 1, March 2003.[2] B. Eliasson, U. Kogelschatz, Non-equilibrium Volume Plasma Chemical Processing, IEEE Transactionon Plasma science, Vol. 19, No. 6, December 1991.[3] Ulrich Kogelschatz, Filamentary, Patterned, and Diffuse Barrier Discharges, IEEE Transactions on PlasmaScience, Vol. 30, No. 4, August 2002.[4] S. Kanazawa, M. Kogoma, T. Moriwaki, S. Okazaki, Stable glow plasma at atmospheric pressure, Journal<strong>of</strong> Physics D: Applied Physics Vol. 21, No. 5, 1988.[5] L. Yang, Y. Hao, E. Tu, X. Wang, J. Chen, Mechanism and Characteristic <strong>of</strong> Dielectric Barrier MultipulseGlow Discharge in Helium at Atmospheric Pressure, Proceedings <strong>of</strong> <strong>the</strong> 9th International Conferenceon Properties and Applications <strong>of</strong> Dielectric Materials, July 2009.[6] R. Gouri, N. Zouzou, A. Tilmatine, L. Dascalescu, Enhancement <strong>of</strong> submicron particle electrostatic precipitationusing <strong>dielectric</strong> <strong>barrier</strong> <strong>discharge</strong> in wire to square tube configuration, Journal <strong>of</strong> electrostatic,2012.[7] B. Dramane, N. Zouzou, E. Moreau, G. Touchard, Electrostatic precipitation <strong>of</strong> submicron particles usinga DBD in axisymmetric and planar configurations, IEEE transactions on Dielectrics and Electrical Insulation,Vol. 6, No. 2, April 2009.[8] H. Tsubone, J. Ueno, B. Komeili, S. Minami, G.D. Harvel, K. Urashima, C.Y. Ching, J.S. Chang, Flowcharacteristics <strong>of</strong> dc wire-non-parallel plate electro-hydrodynamic gas pumps, Journal <strong>of</strong> Electrostatics,September 2008.[9] J.S. Chang, H. Tsubone, Y.N. Chun, A.A. Berezin, K. Urashima, Mechanism <strong>of</strong> eletrohydrodynamicallyinduced flow in a wire-non-parallel plate electrode type gas pump, Journal <strong>of</strong> Electrostatics, 2009.[10] F. Massines, A. Rabehi, P. Decomps, R. B. Gadri, P. Ségur, C. Mayoux, Experimental and <strong>the</strong>oreticalstudy <strong>of</strong> a glow <strong>discharge</strong> at atmospheric pressure controlled by <strong>dielectric</strong> <strong>barrier</strong>, J. Appl. Phys., 1998.[11] P. Sattari, G.S.P. Castle, K. Adamiak, FEM-FCT Based Dynamic Simulation <strong>of</strong> Corona Discharge inPoint-Plane Configuration, Conf. Presentation – P1.17[12] J. S. Shanga, P. G. Huang, Modeling <strong>of</strong> ac <strong>dielectric</strong> <strong>barrier</strong> <strong>discharge</strong>, Journal <strong>of</strong> Applied Physics, June2010.[13] K. Adamiak and P. Atten, “Simulation <strong>of</strong> corona <strong>discharge</strong> in point-plane configuration,” J. <strong>of</strong>Electrostat., vol. 61, 2004.[14] W. Breazeal, K. M. Flynn, and E. G. Gwinn, Static and dynamic two-dimensional patterns in selfextinguishing<strong>discharge</strong> avalanches , Physical Review, Vol. 52, No. 2, August 1995.[15] N. Sato, Discharge current induced by <strong>the</strong> motion <strong>of</strong> charged particles, J. Phys. D: Appl. Phys., 1980.