Comparative Assessment of QSAR Models for Aquatic Toxicity
Comparative Assessment of QSAR Models for Aquatic Toxicity
Comparative Assessment of QSAR Models for Aquatic Toxicity

Create successful ePaper yourself
Turn your PDF publications into a flip-book with our unique Google optimized e-Paper software.
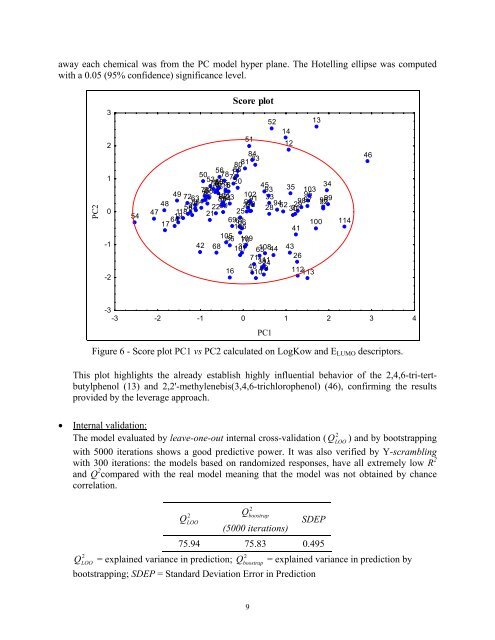
away each chemical was from the PC model hyper plane. The Hotelling ellipse was computedwith a 0.05 (95% confidence) significance level.PC23210-1-254Score plot518480 81 8356 11 8550 7853 797781015 5 20 6 4534733549 795574 75 8887 7693 10372633 2 4 59 101 8223102 3348 868911819 21 22 2790252829 32585760 61 919510492 94 98 97 96 996230314764691767 66100 11410641105 36 109 7042 68 107 3765 108444371 26111 38244016 39110 112 1135214121346-3-3 -2 -1 0 1 2 3 4Figure 6 - Score plot PC1 vs PC2 calculated on LogKow and E LUMO descriptors.This plot highlights the already establish highly influential behavior <strong>of</strong> the 2,4,6-tri-tertbutylphenol(13) and 2,2'-methylenebis(3,4,6-trichlorophenol) (46), confirming the resultsprovided by the leverage approach.PC1• Internal validation:The model evaluated by leave-one-out internal cross-validation ( Q2LOO) and by bootstrappingwith 5000 iterations shows a good predictive power. It was also verified by Y-scramblingwith 300 iterations: the models based on randomized responses, have all extremely low R 2and Q 2 compared with the real model meaning that the model was not obtained by chancecorrelation.2QLOO2Qboostrap(5000 iterations)SDEP75.94 75.83 0.49522QLOO= explained variance in prediction; Qboostrap= explained variance in prediction bybootstrapping; SDEP = Standard Deviation Error in Prediction9