Comparative Assessment of QSAR Models for Aquatic Toxicity
Comparative Assessment of QSAR Models for Aquatic Toxicity
Comparative Assessment of QSAR Models for Aquatic Toxicity

Create successful ePaper yourself
Turn your PDF publications into a flip-book with our unique Google optimized e-Paper software.
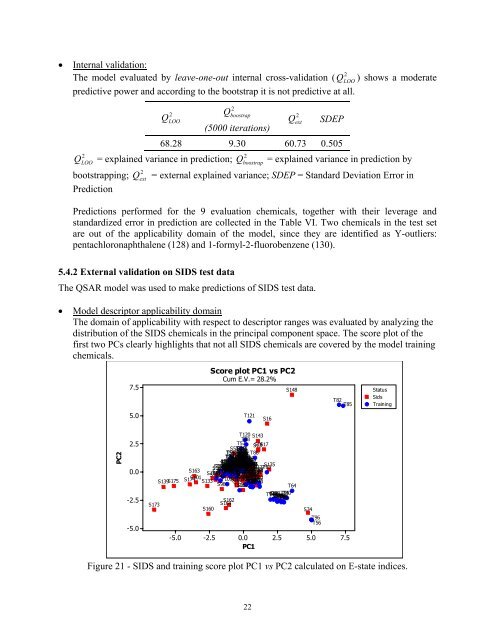
• Internal validation:2The model evaluated by leave-one-out internal cross-validation ( QLOO) shows a moderatepredictive power and according to the bootstrap it is not predictive at all.2QLOO2QLOO= explained variance in prediction;bootstrapping;Prediction2Qboostrap(5000 iterations)2Qext SDEP68.28 9.30 60.73 0.5052Qboostrap= explained variance in prediction by2Qext= external explained variance; SDEP = Standard Deviation Error inPredictions per<strong>for</strong>med <strong>for</strong> the 9 evaluation chemicals, together with their leverage andstandardized error in prediction are collected in the Table VI. Two chemicals in the test setare out <strong>of</strong> the applicability domain <strong>of</strong> the model, since they are identified as Y-outliers:pentachloronaphthalene (128) and 1-<strong>for</strong>myl-2-fluorobenzene (130).5.4.2 External validation on SIDS test dataThe <strong>QSAR</strong> model was used to make predictions <strong>of</strong> SIDS test data.• Model descriptor applicability domainThe domain <strong>of</strong> applicability with respect to descriptor ranges was evaluated by analyzing thedistribution <strong>of</strong> the SIDS chemicals in the principal component space. The score plot <strong>of</strong> thefirst two PCs clearly highlights that not all SIDS chemicals are covered by the model trainingchemicals.7.5Score plot PC1 vs PC2Cum E.V.= 28.2%S148T82T85StatusSidsTraining5.0T121S16PC22.50.0-2.5-5.0T120 S143T98T57S55S161 S131S28S126S118 S50S13 S14S17T119T55 T54 S157S90S144T65T118 S22S170S176S129 S158S20 T117 S99S132 S151S165S177S169 S159 S156 S154S145 S141 S113S142 S124 S125 S122S138 S147S150 S120 S137 S119 S117 S136S163S167 S168S146 S123 S135S130 S116 S107 S103 S106 S97S75 S78S96 S12 S89S100S72 S49 S86 S64 S51 S21 S81 S74 S15S11S92S112 S114 S110S91 S84S3 T86T110 T63T97T99T100S95S88S68S83S73 S53 S37 S36S48 S43 S52 S32 S27 S26 S30S24T84T66 T68T67T36 T35 T7T8 T6 T5 T34T101 T111 T88T71T53T113 T112T79 T80 T81T108 S18 S8 S70S121 S108S111 S76 S94 S23T106 T107 T105 T104 T103 T102S87S134 S77S40 S56 S65 S63 S29 S127S115 S31T114T39 T69 T37 T10 T38 T9 T61T76 T72 T78S47 S82 T75S175 S174S171 S140S59S58S60 S69 S57 S149 S54 S71S128S4 S155S5S6 S109 S7S101 T115 S66 S44T89T74 T83T41T19T18 T17 T15 T14 T13 T3 T12T11 T4T2 T58S102 S39 S62 S67S139S133 S166S45S35S38S41T109S46S61 T91 T90 T93 T16T22 T21 T20T92T62S42 T87T70S98T25 T26 T30 T28 T24 T29 T27T73T116 S152T64T94 T46 T43 T44 T23S172 S33 T48T95 T40 T45 T42 T47 T52 T49 T51 T50S162S173S164S160-5.0 -2.5 0.0 2.5PC1S34T96T565.07.5Figure 21 - SIDS and training score plot PC1 vs PC2 calculated on E-state indices.22