Long-Term Cyclic Performance Assessment of Micropile Systems ...
Long-Term Cyclic Performance Assessment of Micropile Systems ...
Long-Term Cyclic Performance Assessment of Micropile Systems ...

You also want an ePaper? Increase the reach of your titles
YUMPU automatically turns print PDFs into web optimized ePapers that Google loves.
<strong>Long</strong>-<strong>Term</strong> <strong>Performance</strong> <strong>Assessment</strong><strong>of</strong> <strong>Micropile</strong>s Subject to<strong>Cyclic</strong> Axial LoadingGary M. WeinsteinISM 2007 Toronto, CanadaSeptember 27, 2007
Summary1. Problem Definition & Research Needs2. Model: Creep & <strong>Cyclic</strong> Displacement3. Model Validation• * Structural Laboratory (New York)• Calibration Chamber (Paris)4. Conclusions
Industry ApplicationsBridges & HighwaysRailwaysLand-based Arresting Gear(Courtesy <strong>of</strong> U.S. Navy)Waterfront/HarborsPower
<strong>Cyclic</strong> StrainA timedependentphenomenaq ,δ , nThe effect <strong>of</strong> number <strong>of</strong> load cycles on anchordisplacement for a range <strong>of</strong> load amplitudes(After Al-Mosawe, 1979)The effect <strong>of</strong> load cycleson the rate <strong>of</strong> anchor displacement(After Al-Mosawe, 1979)
Strain Rate Model for <strong>Cyclic</strong> Strainq , ε , t dεdtacb. . .dε = ε = ε o* ε -β + ε resε(t) =[ ε o (β +1)] 1/ (β+1) x t1/ (β+1)dtThe procedure charts including (a) stress, σ, vs. strain, ε, at constant strain rate (b) strain rate vs. strain, ε atconstant stress (c) residual strain rate vs. stress, σ and (d) strain, ε, vs. cycle number, n at constant stressd
Ecole Nationale des Ponts et ChausséesCERMESCentre d’Enseignement det de Recherche en Mécanique Mdes Sols
CERMESCalibration ChamberFOREVER (1992-2002)- Physical modeling <strong>of</strong> micropiles and micropile systems- Controlled testing conditions (stress level, density, etc.)- Monotonic & cyclic loading
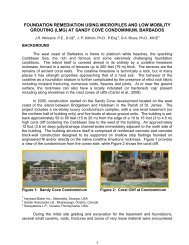
Calibration ChamberUpper baseplateLateralconfinement Chambred’étalonnageTrancheélémentaired ’un massif avecdesconditions initialesSoil MassifDouble cellwallI D,Lower baseplateσ h et σ v1. Preparation <strong>of</strong> massif2. Implementation <strong>of</strong> test protocol3. Initialize data acquisition system4. Jacking <strong>of</strong> instrumented pile5. Loading <strong>of</strong> micropile6. Demounting massifSand reservoir(plexiglass)Double grillDiffuser reeldeviceUpper reservoirVerticalconfinementDiffuser (doublegrill)<strong>Micropile</strong>Lower reservoirCalibration Chamber - SchematicSystem <strong>of</strong> Pluviation
Preassembly <strong>of</strong> Chamber
Fontainebleau SoilGradation PropertiesSt Rémy-lès-ChevreuseSand D 50 (mm) e max e min ρ s ( g/cm 3 ) ρ d ( g/cm 3 ) ρ dmax ( g/cm 3 )AF 0.21 0.94 0.54 2.65 1.37 1.72
MassifTest No. Designation M s (Kg) I(g/cm 2 /s) I D1 MDRC-02 MDRC-1 225.38 2.72 0.4053 MDRC-1b 224.96 2.71 0.3964 MDRC-1c 224.06 2.70 0.3785 MDRC-3 221.92 2.67 0.3356 MDRC-3a 222.96 2.69 0.3567 MDRC-3b 224.38 2.70 0.3858 CDRC-1 223.96 2.70 0.3769 CDRC-2 224.56 2.70 0.38810 CDRC-3 224.24 2.70 0.38211 FDRC-1 223.94 2.70 0.37612 FDRC-2 225.54 2.72 0.40813 FDRC-2a 223.96 2.70 0.37614 FDRC-3 224.22 2.70 0.38215 FDRC-4 224.64 2.71 0.39016 FDRC-4a 225.28 2.71 0.40317 FDRC-5 225.82 2.72 0.41418 FDRC-6 225.72 2.72 0.41219 FDRC-8 225.83 2.72 0.41420 FLC-1 225.52 2.72 0.40821 FLC-2 225 2.71 0.397ID10.90.80.70.60.50.40.30.20.10y = 0.0851x 2 - 0.4318x + 0.938R 2 = 0.95070 1 2 3I(g/cm2/s)20 testsDensity Index vs. Deposition IntensityMassif Calibration
Pluviation
Application <strong>of</strong> Vacuum/Counterpressure
Application <strong>of</strong> Stresses
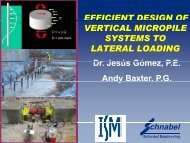
Principle SchematicJacking pistonTracks fortranslationMTS loadingpistonCellMobile base -translation androtation
Jacking & LoadingHydraulic jackSingle stroke(force transducer)Loading jack(Displacement & forcetransducer at head)Loading <strong>of</strong> micropileJacking <strong>of</strong> micropile
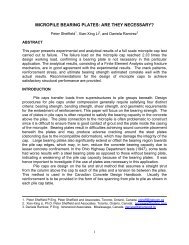
Instrumented <strong>Micropile</strong>Measure <strong>of</strong> friction atthe sleeve200 mmForce transducer4 kNInstrumented micropileφ20 mmForce transducer (5kN) –Measure <strong>of</strong> load at the tip
Test ScheduleTest Number Designation Applied Displacement Rate <strong>Cyclic</strong> Displacement Rate Frequency Rate Q Peak q p Peak f s Peak δ max δ e δ p q p,res f s,res(mm/min) (mm/cycle) (cycle/min) (kN) (MPa) (kPa) (mm) (mm) (mm) (MPa) (kPa)1 MDRC-0 1 na na 5.06 6.85 68.37 5.13 4.64 4.64 0.88 -0.442 MDRC-1 1 na na 4.38 6.26 60.96 59.80 59.80 59.80 1.13 -1.863 MDRC-1b 1 na na 4.34 6.58 43.06 24.92 24.92 24.92 0.90 -2.484 MDRC-1c 1 na na 4.59 6.31 62.52 24.90 24.90 24.90 0.89 -1.765 MDRC-3 0.2 na na 4.14 5.22 54.22 24.91 24.91 24.91 0.75 -0.486 MDRC-3a 0.2 na na 5.01 5.98 73.07 19.93 19.93 19.93 0.69 -1.547 MDRC-3b 0.2 na na 4.38 5.45 66.03 19.92 19.92 19.92 1.03 -0.638 CDRC-1 1 0.2 5 4.84 4.84 75.91 3.58 3.23 3.23 0.57 0.619 CDRC-2 0.25 0.05 5 4.61 4.01 86.43 2.49 2.23 2.23 0.56 1.1810 CDRC-3 0.02 0.004 5 3.40 3.13 0.96 0.78 0.78 0.5911 FDRC-1 1 1 1 4.69 5.82 67.10 10.98 10.63 10.6312 FDRC-2 1 0.1 10 4.21 4.50 57.57 9.99 9.72 9.72 0.13 0.1813 FDRC-2a 1 0.1 10 1.10 1.1014 FDRC-3 1 0.02 50 3.56 3.89 56.47 10.86 10.66 10.6615 FDRC-4 1 0.004 250 2.55 2.88 54.95 1.07 0.94 0.94 0.83 0.8316 FDRC-4a 1 0.004 250 1.20 1.2017 FDRC-5 1 0.002 500 2.29 2.92 55.34 1.02 0.83 0.83 0.79 0.7918 FDRC-6 1 0.001 1000 2.04 2.79 51.74 1.00 1.00 1.00 0.22 0.2219 FDRC-8 1 0.0004 2500 1.87 2.64 47.63 0.53 0.45 0.4520 FLC-1 1 na na 3.17 4.21 45.07 17.47 17.29 17.2921 FLC-2 1 na na 1.82 3.05 52.22 0.77 0.67 0.67Testing Summary1. Monotonic displacement rate control – Effect <strong>of</strong> rate2. <strong>Cyclic</strong> displacement rate control – Effect <strong>of</strong> frequency3. <strong>Cyclic</strong> load control – Validation <strong>of</strong> testing methodology & modelEstablishment <strong>of</strong> Critical <strong>Cyclic</strong> Load
Test Control & Data AcquisitionMission ControlLABView EnvironmentMTS FlexTest System
Repeatibility & Rate EffectsForce (kN)432100 100 200 300 400 500 600Displacement <strong>of</strong> the Point (mm)FDRC-1FDRC-2FDRC-3FDRC-4FDRC-5FDRC-6FDRC-8JackingForce (kN)54.543.532.521.510.500 0.2 0.4 0.6 0.8 1 1.2 1.4 1.6 1.8 2Displacement (mm)ADR = 1mm/min (MDRC-1)ADR = 1mm/min (MDRC-1c)ADR = 0.02mm/min (MDRC-3)ADR = 0.02mm/min (MDRC-3b)Loading
Initial Stiffness (Rate Effects)Force (kN)65432101mm/min.0.1mm/min.0.01mm/min.0 1 2 3 4 5 6 7Displacement (mm)Force (kN)65432101mm/min.0.1mm/min.0.01mm/min.0 0.1 0.2 0.3Relative Displacement (mm)y = 10.416x + 0.8116R 2 = 0.9915y = 10.374x + 0.2936R 2 = 0.9982y = 8.144x - 0.0338R 2 = 0.9986Loading
<strong>Cyclic</strong> Displacement Rate ControlSleeve Friction (kPa)Tip Resistance (MPa)Force (kN)5100 790648070 5360 450240 330 21201010000 1 2 3 400 1 Displacement 2 (mm)3 44Displacement (mm)MDRC-1c (ADR = 1.0 mm/min)MDRC-1c CDRC-1 (ADR(ADR = 1.01.0 mm/min;mm/min)CDR = 0.20 mm/cycle; F = 5 cpm; N =18 cyclesCDRC-1 CDRC-2(ADR (ADR= =1.0 0.25mm/min;mm/min; CDR CDR= 0.20= 0.05mm/cycle; mm/cycle;F =F 5= cpm;5 cpm;N N=18 = 50cyclescyclesCDRC-2 (ADR = 0.25mm/min; CDR = 0.05 mm/cycle; F = 5 cpm; N = 50 cyclesVariable Applied Displacement Rate
<strong>Cyclic</strong> Displacement Rate ControlTip Resistance (MPa)Force (kN)7806575705 654 604 55503 453 40352230251 201 15100 5000 1 2 3 4 5 6 7 8 9 10001122334Displacement 45 (mm) 5667788991010DisplacementDisplacement(mm)(mm)MDRC-1c (ADR = 1 mm/min)FDRC-1 MDRC-1cMDRC-1c (ADR (ADR = (ADR 1 = mm/min; = 1 mm/min)1 mm/min) CDR = 1 mm/cycle; F = 1 cpm; N = 11 cycles)FDRC-2 FDRC-1FDRC-1(ADR (ADR(ADR==1 = 1 mm/min; CDR = 1 mm/cycle; F = 1 cpm; N = 11 1mm/min;mm/min;CDRCDR==0.11 mm/cycle;mm/cycle; F =110cpm;cpm;NN==11100cycles)cycles)FDRC-3 FDRC-2 (ADR = 1 mm/min; CDR = 0.1 mm/cycle; F = 10 cpm; N = 100 cycles)FDRC-2 (ADR (ADR = = 11 mm/min; mm/min; CDR CDR = = 0.02 0.1 mm/cycle; F = 50 10 cpm; N = 58 100 cycles) cycles)FDRC-3 (ADR = 1 mm/min; CDR = 0.02 mm/cycle; F = 50 cpm N = 58 cycles)FDRC-3 (ADR = 1 mm/min; CDR = 0.02 mm/cycle; F = 50 cpm N = 58 cycles)Sleeve Friction (kPa)Variable <strong>Cyclic</strong> Displacement Rate
<strong>Cyclic</strong> Displacement Rate ControlForce vs. DisplacementForce vs. Displacement (cyclicenvelope)
<strong>Cyclic</strong> Displacement Rate Control90Sleeve Friction (kPa) .7560453015MDRC-1 (Mono)CDRC-1 (5cpm)FDRC-1 (1cpm)FDRC-2 (10cpm)FDRC-3 (50cpm)FDRC-4 (250cpm)FDRC-5 (500cpm)FDRC-6 (1000cpm)FDRC-8 (2500cpm)FLC-1FLC-200 1 2 3 4 5 6 7 8 9 10 11 12Displacement (mm)Sleeve Friction vs. DisplacementSleeve Friction vs. Displacement
Load Control20Displacement (mm15105FLC-1 (3.15kN)FLC-2 (1.80 kN)01 100 10000Cycle NumberDisplacement vs. Cycle NumberRate <strong>of</strong> Displacemen(mm/100 cycles)10.10.01FLC-1 (3.15kN)FLC-2 (1.80 kN)0.001100 1000 10000Number <strong>of</strong> CyclesDisplacement Rate vs. Cycle Number
Load & Rate ControlForce (kN)<strong>Cyclic</strong> DisplacementRate (mm/cycle)0.10.080.060.040.0200 0.2 0.4 0.6 0.8 1 1.2 1.4Displacement (mm)Displacement Rate vs. DisplacementEstablishment <strong>of</strong> Critical <strong>Cyclic</strong> Load0.250.500.751.001.251.501.752.002.252.502.753.003.253.503.754.003.15kN1.80 kN
Conclusions• Experimental Model Evaluation illustrates that model predictions agree with the experimentalresults indicating that long-term behavior <strong>of</strong> strain-rate dependent and frequency dependent materialsand phenomena such as soil-pile interaction can be predicted using short-term strain rate controlledcyclic compression test results.• The cyclic strain model predicts a Cycle Limit at which the cyclic strain process ends for loads thatare smaller then the Critical <strong>Cyclic</strong> load. For loads that are greater than the Critical <strong>Cyclic</strong> Load, themodel predicts linear long-term strain-cycle behavior.• Further research is now required to better understand the effect <strong>of</strong> in-situ testing conditions (i.e. soilconfinement, ground water, etc.) on the long-term cyclic behavior <strong>of</strong> micropiles. Full scale loadingtests would be required in order to provide a relevant database for the field evaluation <strong>of</strong> the strainrate – cyclic creep model and the development <strong>of</strong> reliable design methods for the assessment <strong>of</strong> thelong-term performance <strong>of</strong> rate and frequency dependent phenomena.• Impact on Engineering Practice Existing pile load testing equipment could be used to conduct fullscalefield loading tests using the suggested testing protocol. If successful, testing standards could bedeveloped which could lead to adopting the proposed cyclic strain testing procedure and strain ratecontrolled cyclic strain model as a base line for industry pile testing standards
Research Program SupportSchnabel EngineeringPolytechnic UniversityInternational Association <strong>of</strong> Foundation Drilling (ADSC)Applied Geotechnical Engineering (AGE)Branlow Piling SolutionsCAT Construction/Traylor GroupCon-Tech <strong>Systems</strong> LTD.DBM ConstructionGeosystems LPHayward Baker, Inc.IschebeckLayne GeoConstructionMoretrench American Corp.Nicholson ConstructionTEI Rock Drills
Thank You