Chapter 13 - Children in need of special protection - Children's ...
Chapter 13 - Children in need of special protection - Children's ...
Chapter 13 - Children in need of special protection - Children's ...
You also want an ePaper? Increase the reach of your titles
YUMPU automatically turns print PDFs into web optimized ePapers that Google loves.
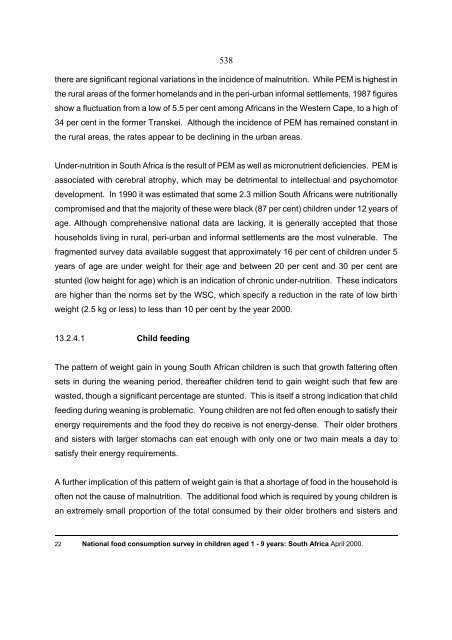
538there are significant regional variations <strong>in</strong> the <strong>in</strong>cidence <strong>of</strong> malnutrition. While PEM is highest <strong>in</strong>the rural areas <strong>of</strong> the former homelands and <strong>in</strong> the peri-urban <strong>in</strong>formal settlements, 1987 figuresshow a fluctuation from a low <strong>of</strong> 5.5 per cent among Africans <strong>in</strong> the Western Cape, to a high <strong>of</strong>34 per cent <strong>in</strong> the former Transkei. Although the <strong>in</strong>cidence <strong>of</strong> PEM has rema<strong>in</strong>ed constant <strong>in</strong>the rural areas, the rates appear to be decl<strong>in</strong><strong>in</strong>g <strong>in</strong> the urban areas.Under-nutrition <strong>in</strong> South Africa is the result <strong>of</strong> PEM as well as micronutrient deficiencies. PEM isassociated with cerebral atrophy, which may be detrimental to <strong>in</strong>tellectual and psychomotordevelopment. In 1990 it was estimated that some 2.3 million South Africans were nutritionallycompromised and that the majority <strong>of</strong> these were black (87 per cent) children under 12 years <strong>of</strong>age. Although comprehensive national data are lack<strong>in</strong>g, it is generally accepted that thosehouseholds liv<strong>in</strong>g <strong>in</strong> rural, peri-urban and <strong>in</strong>formal settlements are the most vulnerable. Thefragmented survey data available suggest that approximately 16 per cent <strong>of</strong> children under 5years <strong>of</strong> age are under weight for their age and between 20 per cent and 30 per cent arestunted (low height for age) which is an <strong>in</strong>dication <strong>of</strong> chronic under-nutrition. These <strong>in</strong>dicatorsare higher than the norms set by the WSC, which specify a reduction <strong>in</strong> the rate <strong>of</strong> low birthweight (2.5 kg or less) to less than 10 per cent by the year 2000.<strong>13</strong>.2.4.1 Child feed<strong>in</strong>gThe pattern <strong>of</strong> weight ga<strong>in</strong> <strong>in</strong> young South African children is such that growth falter<strong>in</strong>g <strong>of</strong>tensets <strong>in</strong> dur<strong>in</strong>g the wean<strong>in</strong>g period, thereafter children tend to ga<strong>in</strong> weight such that few arewasted, though a significant percentage are stunted. This is itself a strong <strong>in</strong>dication that childfeed<strong>in</strong>g dur<strong>in</strong>g wean<strong>in</strong>g is problematic. Young children are not fed <strong>of</strong>ten enough to satisfy theirenergy requirements and the food they do receive is not energy-dense. Their older brothersand sisters with larger stomachs can eat enough with only one or two ma<strong>in</strong> meals a day tosatisfy their energy requirements.A further implication <strong>of</strong> this pattern <strong>of</strong> weight ga<strong>in</strong> is that a shortage <strong>of</strong> food <strong>in</strong> the household is<strong>of</strong>ten not the cause <strong>of</strong> malnutrition. The additional food which is required by young children isan extremely small proportion <strong>of</strong> the total consumed by their older brothers and sisters and22 National food consumption survey <strong>in</strong> children aged 1 - 9 years: South Africa April 2000.


