esistivity log, Rt(Sw), followed by several injection steps withsolvent to miscibly displace all remaining oil and then injectingformation water with a known resistivity, Rw, and finally re-loggingthe resistivity, Rt(Sw=1)=Ro. With this procedure, formationwater salinity information is available, but not necessarilyneeded. The saturation exponent is needed, as is informationon how it might be altered after the injection process. The accuracyof this procedure heavily relies on the effectiveness ofthe injection process and the miscible displacement of the remainingoil, which can be quite challenging.NUCLEAR MAGNETIC RESONANCE (NMR)NMR technology was first introduced for ROS application 13, 14 .The main advantage of NMR is the independence it offers fromwater salinity and saturation exponent. The NMR technologymeasures relaxation times, which tend to overlap the oil andwater signals in a pore space, hindering any identification or obviouslyany quantification efforts, Fig. 2a. Therefore, Robinsondeveloped a procedure that results in splitting the water signalfrom the oil signal in the relaxation time domain, allowingquantification of remaining oil 13, 14 , Fig. 2b.This procedure is what is known in the industry as doping orLIL 8, 15, 16 . A chemical material, manganese chloride (MnCl 2 ),is added to the drilling fluid before drilling the zones of interest.When the MnCl 2 invades the formation during the drillingprocess, the paramagnetic ions, Mn ++ , dissolve only in water,which shortens its relaxation time, shifting it away from that ofoil, which remains unchanged. Concentration of the dopantshould be carefully designed to widen the split between oil andwater just enough but not cause a relaxation time so short thatit goes beyond the tool’s detection limits.A relaxation time cutoff is later applied to quantify the volumesof water and oil. Likewise, the injection procedure forthe resistivity-based approach, the ROS accuracy from theNMR approach is determined by the success of the dopant injectionin splitting the water and oil signal.DIELECTRIC TECHNOLOGYDielectric technology has had a long history of developmentFig. 2. Typical NMR measurements before and after doping. Plot A shows NMRrelaxation time before doping, on the base log, with a given pore size distributionand irreducible water information; the oil and water signal cannot be differentiatedas they tend to overlap. Plot B demonstrates the effect of the doping process on theNMR signal: with a clear shift in water signal from the oil signal the oil volumecan be computed after applying a simple cutoff.since its early introduction 17 . Over the years, dielectric technologyhas advanced, following technological developments in itshardware and software. The capabilities and limitations of thetechnology have been improved in the new generation of dielectrictools 18 .Similar to NMR technology, the dielectric logging providesan answer that is independent of water salinity and saturationexponent. Additionally, it is a direct measurement; no specialprocedure is required prior to logging, i.e., doping for theNMR. It measures water-filled porosity near the wellbore. Thedielectric measurement is based on the electromagnetic wavepropagation in porous media that is governed by conductivityand dielectric permittivity. The dielectric permittivity of waterstands out among any other common minerals or fluids in petroleumsystems, Table 1. This physical phenomenon featuresthe dielectric measurements to be sensitive only to the aqueousphase. Therefore, coupled with total porosity information andmatrix permittivity, oil saturation in invaded zones can be calculated18 .FIELD EXAMPLESThis section looks at field examples from <strong>Saudi</strong> <strong>Aramco</strong> fieldsthat are undergoing waterflooding recovery. Over the years,water with different salinities have been injected for pressuremaintenance. Together with the original formation water, allhave resulted in a mixed salinity environment ranging from230 kppm to as low as 10 kppm. The subject reservoirs arecarbonates, mainly limestone with localized dolomitization.The reservoir quality ranges from highly porous and permeablegrainstones at the top, degrading downward to tight faciesmudstones and wackestones at the bottom. In the followingexamples, all the wells are located behind waterfronts, inswept areas, and near water injectors.Well #1The LIL procedure was followed. The well was drilled with a8½” bit and conventional mud across the interest zone, andMaterialQuartz 4.4Sandstone 4.65PermittivityLimestone 7.5 to 9.2Dolomite 6.8Clay (dry colloids) 5.0 to 5.8Anhydrite 6.4Halite 5.9Gypsum 4.16Oil 2.2Air, Gas 1Water* 50 to 78Table 1. Reservoir mineral and fluid relative dielectric permittivity*Dependent on frequency, pressure, temperature and salinity.48 WINTER 2011 SAUDI ARAMCO JOURNAL OF TECHNOLOGY
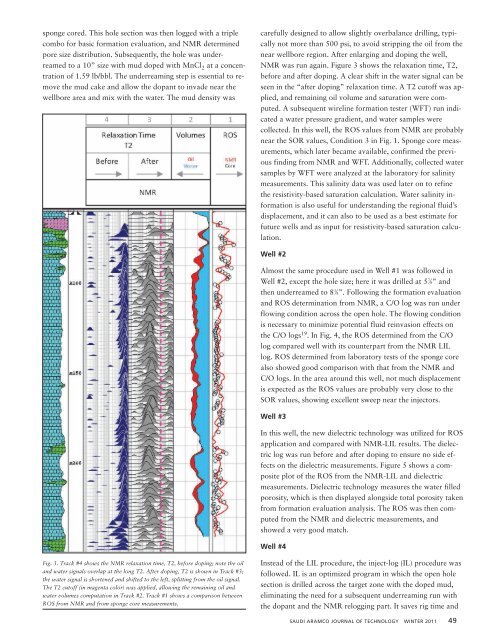
sponge cored. This hole section was then logged with a triplecombo for basic formation evaluation, and NMR determinedpore size distribution. Subsequently, the hole was underreamedto a 10” size with mud doped with MnCl 2 at a concentrationof 1.59 lb/bbl. The underreaming step is essential to removethe mud cake and allow the dopant to invade near thewellbore area and mix with the water. The mud density wascarefully designed to allow slightly overbalance drilling, typicallynot more than 500 psi, to avoid stripping the oil from thenear wellbore region. After enlarging and doping the well,NMR was run again. Figure 3 shows the relaxation time, T2,before and after doping. A clear shift in the water signal can beseen in the “after doping” relaxation time. A T2 cutoff was applied,and remaining oil volume and saturation were computed.A subsequent wireline formation tester (WFT) run indicateda water pressure gradient, and water samples werecollected. In this well, the ROS values from NMR are probablynear the SOR values, Condition 3 in Fig. 1. Sponge core measurements,which later became available, confirmed the previousfinding from NMR and WFT. Additionally, collected watersamples by WFT were analyzed at the laboratory for salinitymeasurements. This salinity data was used later on to refinethe resistivity-based saturation calculation. Water salinity informationis also useful for understanding the regional fluid’sdisplacement, and it can also to be used as a best estimate forfuture wells and as input for resistivity-based saturation calculation.Well #2Almost the same procedure used in Well #1 was followed inWell #2, except the hole size; here it was drilled at 5 7 ⁄8” andthen underreamed to 8 3 ⁄8”. Following the formation evaluationand ROS determination from NMR, a C/O log was run underflowing condition across the open hole. The flowing conditionis necessary to minimize potential fluid reinvasion effects onthe C/O logs 19 . In Fig. 4, the ROS determined from the C/Olog compared well with its counterpart from the NMR LILlog. ROS determined from laboratory tests of the sponge corealso showed good comparison with that from the NMR andC/O logs. In the area around this well, not much displacementis expected as the ROS values are probably very close to theSOR values, showing excellent sweep near the injectors.Well #3In this well, the new dielectric technology was utilized for ROSapplication and compared with NMR-LIL results. The dielectriclog was run before and after doping to ensure no side effectson the dielectric measurements. Figure 5 shows a compositeplot of the ROS from the NMR-LIL and dielectricmeasurements. Dielectric technology measures the water filledporosity, which is then displayed alongside total porosity takenfrom formation evaluation analysis. The ROS was then computedfrom the NMR and dielectric measurements, andshowed a very good match.Well #4Fig. 3. Track #4 shows the NMR relaxation time, T2, before doping; note the oiland water signals overlap at the long T2. After doping, T2 is shown in Track #3;the water signal is shortened and shifted to the left, splitting from the oil signal.The T2 cutoff (in magenta color) was applied, allowing the remaining oil andwater volumes computation in Track #2. Track #1 shows a comparison betweenROS from NMR and from sponge core measurements.Instead of the LIL procedure, the inject-log (IL) procedure wasfollowed. IL is an optimized program in which the open holesection is drilled across the target zone with the doped mud,eliminating the need for a subsequent underreaming run withthe dopant and the NMR relogging part. It saves rig time andSAUDI ARAMCO JOURNAL OF TECHNOLOGY WINTER 2011 49