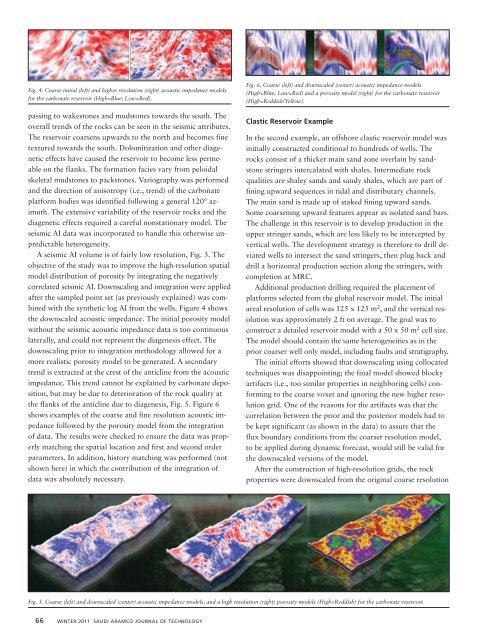
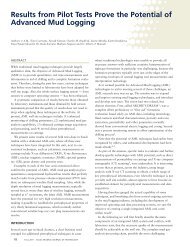
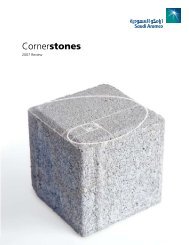
Fig. 4. Coarse initial (left) and higher resolution (right) acoustic impedance modelsfor the carbonate reservoir (High=Blue; Low=Red).passing to wakestones and mudstones towards the south. Theoverall trends of the rocks can be seen in the seismic attributes.The reservoir coarsens upwards to the north and becomes finetextured towards the south. Dolomitization and other diageneticeffects have caused the reservoir to become less permeableon the flanks. The formation facies vary from peloidalskeletal mudstones to packstones. Variography was performedand the direction of anisotropy (i.e., trend) of the carbonateplatform bodies was identified following a general 120° azimuth.The extensive variability of the reservoir rocks and thediagenetic effects required a careful nonstationary model. Theseismic AI data was incorporated to handle this otherwise unpredictableheterogeneity.A seismic AI volume is of fairly low resolution, Fig. 3. Theobjective of the study was to improve the high-resolution spatialmodel distribution of porosity by integrating the negativelycorrelated seismic AI. Downscaling and integration were appliedafter the sampled point set (as previously explained) was combinedwith the synthetic log AI from the wells. Figure 4 showsthe downscaled acoustic impedance. The initial porosity modelwithout the seismic acoustic impedance data is too continuouslaterally, and could not represent the diagenesis effect. Thedownscaling prior to integration methodology allowed for amore realistic porosity model to be generated. A secondarytrend is extracted at the crest of the anticline from the acousticimpedance. This trend cannot be explained by carbonate deposition,but may be due to deterioration of the rock quality atthe flanks of the anticline due to diagenesis, Fig. 5. Figure 6shows examples of the coarse and fine resolution acoustic impedancefollowed by the porosity model from the integrationof data. The results were checked to ensure the data was properlymatching the spatial location and first and second orderparameters. In addition, history matching was performed (notshown here) in which the contribution of the integration ofdata was absolutely necessary.Fig. 6. Coarse (left) and downscaled (center) acoustic impedance models(High=Blue; Low=Red) and a porosity model (right) for the carbonate reservoir(High=Reddish/Yellow).Clastic Reservoir ExampleIn the second example, an offshore clastic reservoir model wasinitially constructed conditional to hundreds of wells. Therocks consist of a thicker main sand zone overlain by sandstonestringers intercalated with shales. Intermediate rockqualities are shaley sands and sandy shales, which are part offining upward sequences in tidal and distributary channels.The main sand is made up of staked fining upward sands.Some coarsening upward features appear as isolated sand bars.The challenge in this reservoir is to develop production in theupper stringer sands, which are less likely to be intercepted byvertical wells. The development strategy is therefore to drill deviatedwells to intersect the sand stringers, then plug back anddrill a horizontal production section along the stringers, withcompletion at MRC.Additional production drilling required the placement ofplatforms selected from the global reservoir model. The initialareal resolution of cells was 125 x 125 m 2 , and the vertical resolutionwas approximately 2 ft on average. The goal was toconstruct a detailed reservoir model with a 50 x 50 m 2 cell size.The model should contain the same heterogeneities as in theprior coarser well only model, including faults and stratigraphy.The initial efforts showed that downscaling using collocatedtechniques was disappointing; the final model showed blockyartifacts (i.e., too similar properties in neighboring cells) conformingto the coarse voxet and ignoring the new higher resolutiongrid. One of the reasons for the artifacts was that thecorrelation between the prior and the posterior models had tobe kept significant (as shown in the data) to assure that theflux boundary conditions from the coarser resolution model,to be applied during dynamic forecast, would still be valid forthe downscaled versions of the model.After the construction of high-resolution grids, the rockproperties were downscaled from the original coarse resolutionFig. 5. Coarse (left) and downscaled (center) acoustic impedance models, and a high resolution (right) porosity models (High=Reddish) for the carbonate reservoir.66 WINTER 2011 SAUDI ARAMCO JOURNAL OF TECHNOLOGY
model with additional new wells already existing at the platform.The end results for the sector static models, including thenew, successfully completed wells, are shown in Fig. 1. Thestatistics of the variability (i.e., moments) of heterogeneityshow valid results, which are consistent with the second orderexpectances. These models are being used to place new wellsafter the flow simulations provided a positive match and theexpected flow rates without water encroachment.CONCLUSIONSThe methodology for the integration of seismic AI data intoporosity models has been revisited with a proposal to generatea model AI that combines the low-frequency seismic AI with apredicted high-frequency well AI. Since seismic AI contains onlythe low-frequency components (i.e., within the seismic bandwidth),the high-frequency components have been extracted fromthe synthetic well log AI as residuals, or the difference betweenthe seismic AI and the log AI, after careful depth matching. Thelog AI predicted at inter-well locations is equivalent to the convolutionof the seismic AI and the high frequency unknown geologiccomponent. Predictions of the higher frequency AI maynot have significant correlations with the seismic in practice,but they were performed incorporating the known stratigraphy,facies and/or rock regions to create a nonstationary modelAI. The search for a different integration method is motivatedby some of the current drawbacks in traditional downscalingwith collocated cokriging, mainly the spurious correlationsthat may occur between collocated seismic AI and log AI. Thecorrelations may be spurious in areas where the seismic AI valuesare less representative of the true geology due to a low signal-to-noiseratio. Non-stationarity issues also encouragedsearching for better ways to downscale seismic AI. Downscalingwith signal equalization is implemented in the frequency domain,and conditioning to the wells leads to geostatistical estimatesof the high-frequency component in the final spatialmodel. An advantage of using the approach outlined here isthat it does not require solving systems of equations and resolvingthe stability complications found in full cokriging. Therefore,the proposed parameter estimation via sequential cokrigingfor stochastic simulation is a practical tool for downscalingand integration of seismic attributes into geocellular models.ACKNOWLEDGMENTSThe thoughtful review of <strong>Saudi</strong> <strong>Aramco</strong> and SPE colleagues isdeeply appreciated. The authors would like to thank <strong>Saudi</strong><strong>Aramco</strong> management for granting permission to publish thisarticle.This article was presented at the SPE Reservoir Characterizationand Simulation Conference and Exhibition, Abu Dhabi,U.A.E., October 9-11, 2011.REFERENCES1. Oz, B. and Deutsch, C.V.: “Size Scaling of CrosscorrelationBetween Multiple Variables,” NaturalResources Research, Vol. 11, No. 1, 2002, pp. 1-18.2. Vargas-Guzmán, J.A., Warrick, A.W. and Myers, D.E.:“Multivariate Correlation in the Framework of Supportand Spatial Scales of Variability,” Mathematical Geology,Vol. 31, No. 1, January 1999, pp. 85-103.3. Wang, J. and Dou, Q.: “Integration of 3D SeismicAttributes into Stochastic Reservoir Models Using IterativeVertical Resolution Modeling Methodology,” SPE paper132654, presented at the SPE Western Regional Meeting,Anaheim, California, May 27-29, 2010.4. Xu, W., Tran, T.T., Srivastava, R.M. and Journel, A.G.:“Integrating Seismic Data in Reservoir Modeling: TheCollocated Cokriging Alternative,” SPE paper 24742,presented at the SPE Annual Technical Conference andExhibition, Washington, D.C., October 4-7, 1992.5. Dubrule, O.: Geostatistics for Seismic Data Integration inEarth Models, Tulsa, Oklahoma: Society of ExplorationGeophysicist, 2003.6. Chiles, J.P. and Delfiner, P.: Geostatistics: Modeling SpatialUncertainty, New York: Wiley and Sons Inter-science, 1999.7. Vargas-Guzmán, J.A., 2003. Conditional ComponentRandom Fields, Stochastic Hydrology and Hydraulics,Stochastic Environmental Research and Risk Assessment,Vol. 17, 2003, pp. 260-271.8. González, E.F., Mukerji, T. and Mavko, G.: “SeismicInversion Combining Rock Physics and Multiple PointGeostatistics,” Geophysics, Vol. 73, No. 1, January-February 2008, pp. 11-21.9. Tran, T., Deutsch, C.V. and Xie, Y.: “Direct GeostatisticalSimulation with Multiscale Well, Seismic and ProductionData,” SPE paper 71323, presented at the SPE AnnualTechnical Conference and Exhibition, New Orleans,Louisiana, September 30 - October 3, 2001.10. Close, D., Stirling, S., Cho, D. and Horn, F.: “Tight GasGeophysics: AVO Inversion for ReservoirCharacterization,” CSEG Recorder, May 2010, pp. 29-35.11. Bosch, M., Mukerji, T. and Gonzalez, E.F.: “SeismicInversion for Reservoir Properties Combining StatisticalRock Physics and Geostatistics: A Review,” Geophysics,Vol. 75, No. 5, September - October 2010, pp. 165-176.12. Vargas-Guzmán, J.A., Myers, D.E. and Warrick, A.W.:“Derivatives of Spatial Variances of Growing Windowsand the Variogram,” Mathematical Geology, Vol. 32, No.7, 2000, pp. 851-871.13. Ren, W., Mclennan, J.A., Cunha, L.B. and Deutsch, C.V.:“An Exact Downscaling Methodology in Presence ofHeterogeneity: Application to the Athabasca Oil Sands,”SPE paper 97874, presented at the SPE InternationalThermal Operations and Heavy Oil Symposium. Calgary,Alberta, Canada, November 1-3, 2005.SAUDI ARAMCO JOURNAL OF TECHNOLOGY WINTER 2011 67