Supporting Information: Absorption spectra and photolysis of methyl ...
Supporting Information: Absorption spectra and photolysis of methyl ...
Supporting Information: Absorption spectra and photolysis of methyl ...

You also want an ePaper? Increase the reach of your titles
YUMPU automatically turns print PDFs into web optimized ePapers that Google loves.
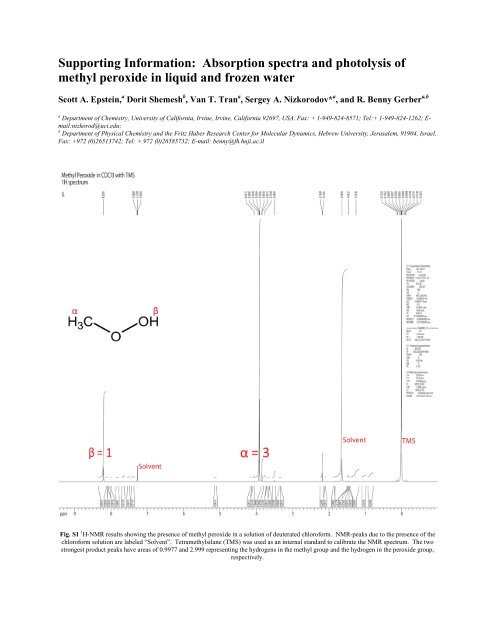
<strong>Supporting</strong> <strong>Information</strong>: <strong>Absorption</strong> <strong>spectra</strong> <strong>and</strong> <strong>photolysis</strong> <strong>of</strong><strong>methyl</strong> peroxide in liquid <strong>and</strong> frozen waterScott A. Epstein, a Dorit Shemesh b , Van T. Tran a , Sergey A. Nizkorodov* a , <strong>and</strong> R. Benny Gerber a,ba Department <strong>of</strong> Chemistry, University <strong>of</strong> California, Irvine, Irvine, California 92697, USA. Fax: + 1-949-824-8571; Tel:+ 1-949-824-1262; E-mail:nizkorod@uci.edu;b Department <strong>of</strong> Physical Chemistry <strong>and</strong> the Fritz Haber Research Center for Molecular Dynamics, Hebrew University, Jerusalem, 91904, Israel.Fax: +972 (0)26513742; Tel: + 972 (0)26585732; E-mail: benny@fh.huji.ac.ilFig. S1 1 H-NMR results showing the presence <strong>of</strong> <strong>methyl</strong> peroxide in a solution <strong>of</strong> deuterated chlor<strong>of</strong>orm. NMR-peaks due to the presence <strong>of</strong> thechlor<strong>of</strong>orm solution are labeled “Solvent”. Tetra<strong>methyl</strong>silane (TMS) was used as an internal st<strong>and</strong>ard to calibrate the NMR spectrum. The twostrongest product peaks have areas <strong>of</strong> 0.9977 <strong>and</strong> 2.999 representing the hydrogens in the <strong>methyl</strong> group <strong>and</strong> the hydrogen in the peroxide group,respectively.
Fig. S2 A) Extinction coefficients <strong>of</strong> <strong>methyl</strong> peroxide at temperatures between 5 <strong>and</strong> 40 o C. Variation in the B) 250 nm, C) 225 nm, <strong>and</strong> D) 300nm extinction coefficients as a function <strong>of</strong> temperature. The lack <strong>of</strong> a trend indicates that variations are due solely to experimental uncertainties<strong>and</strong> are not the result <strong>of</strong> an absorption temperature dependence.Fig. S3 A) liquid aqueous CH 3OOH solution. B) Frozen CH 3OOH solution.
Fig. S4 Predicted concentration <strong>of</strong> a dilute aqueous CH 3OOH solution as a function <strong>of</strong> reaction time using the iodiometric peroxide test. This plotdemonstrates that it is crucial to ensure that the peroxide/KI reaction has reached equilibrium. For certain peroxides, such as <strong>methyl</strong> peroxide,one must observe the reacting solution significantly longer than the one hour timeframe suggested in Banerjee <strong>and</strong> Budke. 1
Table 1 Extinction coefficients <strong>of</strong> liquid <strong>and</strong> frozen aqueous CH 3OOH in units <strong>of</strong> [M -1 cm -1 ] as a function <strong>of</strong> wavelength measured using dilutesolutions [0 to 0.16 M].wavelength [nm]ε[M -1 cm -1 ]wavelength[nm]ε[M -1 cm -1 ] wavelength [nm]ε[M -1 cm -1 ] wavelength [nm]ε[M -1 cm -1 ] wavelength [nm]ε[M -1 cm -1 ]200 126.44 235.5 31.89 271 4.99 306.5 0.62 342 0.09200.5 125.29 236 31.18 271.5 4.84 307 0.61 342.5 0.10201 123.06 236.5 30.48 272 4.70 307.5 0.58 343 0.06201.5 120.89 237 29.78 272.5 4.57 308 0.55 343.5 0.03202 118.78 237.5 29.10 273 4.47 308.5 0.54 344 0.06202.5 116.72 238 28.44 273.5 4.35 309 0.52 344.5 0.09203 114.65 238.5 27.77 274 4.22 309.5 0.48 345 0.11203.5 112.60 239 27.12 274.5 4.09 310 0.47 345.5 0.09204 110.62 239.5 26.49 275 3.98 310.5 0.49 346 0.10204.5 108.72 240 25.85 275.5 3.87 311 0.49 346.5 0.14205 106.88 240.5 25.26 276 3.76 311.5 0.46 347 0.15205.5 105.06 241 24.67 276.5 3.63 312 0.43 347.5 0.12206 103.24 241.5 24.08 277 3.52 312.5 0.43 348 0.07206.5 101.48 242 23.49 277.5 3.44 313 0.42 348.5 0.04207 99.79 242.5 22.92 278 3.35 313.5 0.38 349 0.04207.5 98.11 243 22.38 278.5 3.25 314 0.34 349.5 0.04208 96.40 243.5 21.84 279 3.17 314.5 0.32 350 0.05208.5 94.78 244 21.31 279.5 3.08 315 0.35 350.5 0.06209 93.25 244.5 20.77 280 3.00 315.5 0.36 351 0.09209.5 91.70 245 20.25 280.5 2.91 316 0.33 351.5 0.10210 90.11 245.5 19.76 281 2.81 316.5 0.31 352 0.07210.5 88.51 246 19.29 281.5 2.72 317 0.32 352.5 0.04211 87.03 246.5 18.82 282 2.64 317.5 0.32 353 0.06211.5 85.61 247 18.36 282.5 2.56 318 0.31 353.5 0.08212 84.18 247.5 17.89 283 2.47 318.5 0.28 354 0.00212.5 82.75 248 17.45 283.5 2.39 319 0.27 354.5 0.00213 81.33 248.5 17.01 284 2.33 319.5 0.28 355 0.00213.5 79.90 249 16.59 284.5 2.30 320 0.28 355.5 0.00214 78.54 249.5 16.19 285 2.23 320.5 0.25 356 0.00214.5 77.18 250 15.79 285.5 2.17 321 0.22 356.5 0.00215 75.77 250.5 15.41 286 2.12 321.5 0.23 357 0.00215.5 74.38 251 15.04 286.5 2.05 322 0.26 357.5 0.00216 73.02 251.5 14.66 287 1.99 322.5 0.26 358 0.00216.5 71.69 252 14.30 287.5 1.92 323 0.26 358.5 0.00217 70.38 252.5 13.94 288 1.85 323.5 0.24 359 0.00217.5 69.05 253 13.56 288.5 1.80 324 0.23 359.5 0.00218 67.75 253.5 13.19 289 1.76 324.5 0.23 360 0.00218.5 66.50 254 12.83 289.5 1.71 325 0.21 360.5 0.00219 65.26 254.5 12.48 290 1.65 325.5 0.18 361 0.00219.5 64.02 255 12.15 290.5 1.61 326 0.17 361.5 0.00220 62.76 255.5 11.85 291 1.59 326.5 0.20 362 0.00220.5 61.49 256 11.55 291.5 1.55 327 0.21 362.5 0.00221 60.24 256.5 11.25 292 1.47 327.5 0.17 363 0.00221.5 59.02 257 10.97 292.5 1.40 328 0.17 363.5 0.00222 57.83 257.5 10.71 293 1.35 328.5 0.17 364 0.00222.5 56.63 258 10.43 293.5 1.32 329 0.17 364.5 0.00223 55.43 258.5 10.12 294 1.28 329.5 0.16 365 0.00223.5 54.30 259 9.82 294.5 1.23 330 0.14 365.5 0.00224 53.18 259.5 9.55 295 1.21 330.5 0.14 366 0.00224.5 52.06 260 9.30 295.5 1.19 331 0.17 366.5 0.00225 50.95 260.5 9.03 296 1.17 331.5 0.16 367 0.00225.5 49.89 261 8.78 296.5 1.12 332 0.12 367.5 0.00226 48.87 261.5 8.56 297 1.07 332.5 0.11 368 0.00226.5 47.84 262 8.35 297.5 1.04 333 0.12 368.5 0.00227 46.81 262.5 8.11 298 1.02 333.5 0.15 369 0.00227.5 45.78 263 7.86 298.5 0.97 334 0.14 369.5 0.00228 44.77 263.5 7.66 299 0.91 334.5 0.11 370 0.00228.5 43.79 264 7.47 299.5 0.86 335 0.11 370.5 0.00229 42.82 264.5 7.28 300 0.86 335.5 0.12 371 0.00229.5 41.84 265 7.06 300.5 0.87 336 0.11 371.5 0.00230 40.90 265.5 6.84 301 0.84 336.5 0.10 372 0.00230.5 39.96 266 6.67 301.5 0.82 337 0.10 372.5 0.00231 39.06 266.5 6.49 302 0.82 337.5 0.12 373 0.00231.5 38.20 267 6.30 302.5 0.81 338 0.14 373.5 0.00232 37.35 267.5 6.10 303 0.76 338.5 0.13 374 0.00232.5 36.53 268 5.92 303.5 0.69 339 0.11 374.5 0.00233 35.73 268.5 5.76 304 0.66 339.5 0.14 375 0.00233.5 34.92 269 5.60 304.5 0.65 340 0.15 375.5 0.00234 34.12 269.5 5.44 305 0.63 340.5 0.13 376 0.00234.5 33.37 270 5.26 305.5 0.58 341 0.08 376.5 0.00235 32.63 270.5 5.12 306 0.59 341.5 0.07 377 0.00
Fig. S5 Liquid aqueous CH 3OOH <strong>photolysis</strong> products absorption spectrum relative to the initial CH 3OOH spectrum. At wavelengths greater than230 nm, the equilibrium product signal is no greater than 10% <strong>of</strong> the initial <strong>methyl</strong> peroxide signal supporting the approximation that theabsorption <strong>spectra</strong> <strong>of</strong> the photolyzed CH 3OOH solution is proportional to the concentration <strong>of</strong> CH 3OOH at the limit <strong>of</strong> short <strong>photolysis</strong> times.Vertical excitation calculationsTable 2 shows the vertical excitation energy <strong>of</strong> the bare <strong>and</strong> solvated <strong>methyl</strong> peroxide in the water cluster ascalculated with OM2 <strong>and</strong> with ADC(2).Table 2 Vertical excitation energy for the bare <strong>and</strong> solvated <strong>methyl</strong> peroxide as calculated by ADC(2) <strong>and</strong> OM2.Bare CH 3 OOH Solvated CH 3 OOH SolvatochromicshiftADC(2) vertical excitation energy (in eV) 6.18 6.69 0.51OM2 vertical excitation energy (in eV) 3.43 3.84 0.41OM2 is a semiempirical method that is parameterized for certain systems leading us to believe that this is the cause<strong>of</strong> the differences in the excitation energy. Qualitatively, the excited state described by OM2 is similar to the onedescribed by ADC(2). The solvatochromic shifts predicted by OM2 <strong>and</strong> ADC(2) are similar. The full potentialenergy surface as a function <strong>of</strong> O-O distance calculated with both methods is presented in Figure S6.
Fig S6: Potential energy surface as a function <strong>of</strong> O-O distance as calculated by OM2 <strong>and</strong> ADC(2)Both methods predict that the first excited state is dissociative along the O-O distance. Kamboures et. al 2 find thesame result with the CIS method. Qualitatively, the OM2 method describes the correct photophysical behaviourwhen considering the solvatochromic shift <strong>and</strong> the behaviour <strong>of</strong> the excited state along the O-O distance. Therfore,we are confident that the OM2 method can be used to predict the excitation spectrum <strong>of</strong> the bare <strong>methyl</strong> peroxidecompared to the solvated <strong>methyl</strong> peroxide.References1. D. K. Banerjee <strong>and</strong> C. C. Budke, Analytical Chemistry, 1964, 36, 792-796.2. M. A. Kamboures, S. A. Nizkorodov <strong>and</strong> R. B. Gerber, Proceedings <strong>of</strong> the National Academy <strong>of</strong>Sciences, 2010, 107, 6600-6604.