Technical and Strategic Assessment of Aggregate Supply Options in ...
Technical and Strategic Assessment of Aggregate Supply Options in ...
Technical and Strategic Assessment of Aggregate Supply Options in ...

Create successful ePaper yourself
Turn your PDF publications into a flip-book with our unique Google optimized e-Paper software.
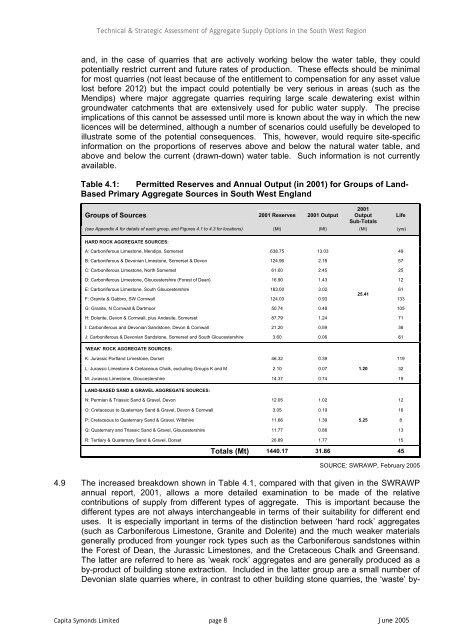
<strong>Technical</strong> & <strong>Strategic</strong> <strong>Assessment</strong> <strong>of</strong> <strong>Aggregate</strong> <strong>Supply</strong> <strong>Options</strong> <strong>in</strong> the South West Region<strong>and</strong>, <strong>in</strong> the case <strong>of</strong> quarries that are actively work<strong>in</strong>g below the water table, they couldpotentially restrict current <strong>and</strong> future rates <strong>of</strong> production. These effects should be m<strong>in</strong>imalfor most quarries (not least because <strong>of</strong> the entitlement to compensation for any asset valuelost before 2012) but the impact could potentially be very serious <strong>in</strong> areas (such as theMendips) where major aggregate quarries requir<strong>in</strong>g large scale dewater<strong>in</strong>g exist with<strong>in</strong>groundwater catchments that are extensively used for public water supply. The preciseimplications <strong>of</strong> this cannot be assessed until more is known about the way <strong>in</strong> which the newlicences will be determ<strong>in</strong>ed, although a number <strong>of</strong> scenarios could usefully be developed toillustrate some <strong>of</strong> the potential consequences. This, however, would require site-specific<strong>in</strong>formation on the proportions <strong>of</strong> reserves above <strong>and</strong> below the natural water table, <strong>and</strong>above <strong>and</strong> below the current (drawn-down) water table. Such <strong>in</strong>formation is not currentlyavailable.Table 4.1: Permitted Reserves <strong>and</strong> Annual Output (<strong>in</strong> 2001) for Groups <strong>of</strong> L<strong>and</strong>-Based Primary <strong>Aggregate</strong> Sources <strong>in</strong> South West Engl<strong>and</strong>Groups <strong>of</strong> Sources 2001 Reserves 2001 Output2001Output LifeSub-Totals(see Appendix A for details <strong>of</strong> each group, <strong>and</strong> Figures 4.1 to 4.3 for locations) (Mt) (Mt) (Mt) (yrs)HARD ROCK AGGREGATE SOURCES: 0 0 0 0A: Carboniferous Limestone, Mendips, Somerset 638.75 13.03 49B: Carboniferous & Devonian Limestone, Somerset & Devon 124.96 2.18 57C: Carboniferous Limestone, North Somerset 61.00 2.45 25D: Carboniferous Limestone, Gloucestershire (Forest <strong>of</strong> Dean) 16.90 1.43 12E: Carboniferous Limestone, South Gloucestershire 183.00 3.02 6125.41F: Granite & Gabbro, SW Cornwall 124.03 0.93 133G: Granite, N Cornwall & Dartmoor 50.74 0.48 105H: Dolerite, Devon & Cornwall, plus Andesite, Somerset 87.79 1.24 71I: Carboniferous <strong>and</strong> Devonian S<strong>and</strong>stone, Devon & Cornwall 21.20 0.59 36J: Carboniferous & Devonian S<strong>and</strong>stone, Somerset <strong>and</strong> South Gloucestershire 3.60 0.0661‘WEAK’ ROCK AGGREGATE SOURCES: 0 0 0 0K: Jurassic Portl<strong>and</strong> Limestone, Dorset 46.32 0.39 119L: Jurassic Limestone & Cretaceous Chalk, exclud<strong>in</strong>g Groups K <strong>and</strong> M 2.10 0.07 1.2032M: Jurassic Limestone, Gloucestershire 14.37 0.7419LAND-BASED SAND & GRAVEL AGGREGATE SOURCES: 0 0 0 0N: Permian & Triassic S<strong>and</strong> & Gravel, Devon 12.05 1.02 12O: Cretaceous to Quaternary S<strong>and</strong> & Gravel, Devon & Cornwall 3.05 0.19 16P: Cretaceous to Quaternary S<strong>and</strong> & Gravel, Wiltshire 11.66 1.39 5.258Q: Quaternary <strong>and</strong> Triassic S<strong>and</strong> & Gravel, Gloucestershire 11.77 0.88 13R: Tertiary & Quaternary S<strong>and</strong> & Gravel, Dorset 26.89 1.77Totals (Mt) 1440.17 31.86 4515SOURCE: SWRAWP, February 20054.9 The <strong>in</strong>creased breakdown shown <strong>in</strong> Table 4.1, compared with that given <strong>in</strong> the SWRAWPannual report, 2001, allows a more detailed exam<strong>in</strong>ation to be made <strong>of</strong> the relativecontributions <strong>of</strong> supply from different types <strong>of</strong> aggregate. This is important because thedifferent types are not always <strong>in</strong>terchangeable <strong>in</strong> terms <strong>of</strong> their suitability for different enduses. It is especially important <strong>in</strong> terms <strong>of</strong> the dist<strong>in</strong>ction between ‘hard rock’ aggregates(such as Carboniferous Limestone, Granite <strong>and</strong> Dolerite) <strong>and</strong> the much weaker materialsgenerally produced from younger rock types such as the Carboniferous s<strong>and</strong>stones with<strong>in</strong>the Forest <strong>of</strong> Dean, the Jurassic Limestones, <strong>and</strong> the Cretaceous Chalk <strong>and</strong> Greens<strong>and</strong>.The latter are referred to here as ‘weak rock’ aggregates <strong>and</strong> are generally produced as aby-product <strong>of</strong> build<strong>in</strong>g stone extraction. Included <strong>in</strong> the latter group are a small number <strong>of</strong>Devonian slate quarries where, <strong>in</strong> contrast to other build<strong>in</strong>g stone quarries, the ‘waste’ by-Capita Symonds Limited page 8 June 2005