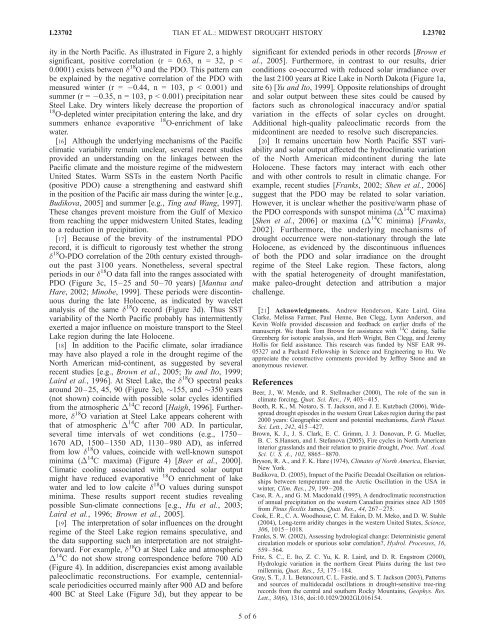
L23702 TIAN ET AL.: MIDWEST DROUGHT HISTORY L23702Figure 4. Comparison <strong>of</strong> d 18 O and detrended atmosphericD 14 C data for <strong>the</strong> last 3100 years. Grey bars highlight<strong>in</strong>tervals with high d 18 O and low D 14 C values. Note that <strong>the</strong>D 14 C scale is reversed. Well-known solar m<strong>in</strong>ima (D 14 Cmaxima) are labeled: Da – Dalton, Ma – Maunder, Sp –Spörer, Wo – Wolf, Oo – Oort, Gr – Greek, and Ho –Homeric.dur<strong>in</strong>g <strong>the</strong> 1988 <strong>drought</strong> (Figure 3a, d1) and 1930s DustBowl (Figure 3a, d2) was m<strong>in</strong>or compared to that dur<strong>in</strong>gmany o<strong>the</strong>r time <strong>in</strong>tervals both before and after 300 AD.Thus <strong>drought</strong> events <strong>of</strong> greater magnitude than <strong>the</strong> aridityextremes <strong>of</strong> <strong>the</strong> 20th century were not uncommon dur<strong>in</strong>g<strong>the</strong> <strong>late</strong> <strong>Holocene</strong>.[10] In addition to <strong>the</strong> broad patterns, our d 18 O recordsuggests that <strong>the</strong> region was relatively dry dur<strong>in</strong>g <strong>the</strong>Medieval Climate Anomaly (MCA; 1400–1100 AD)and relatively wet dur<strong>in</strong>g <strong>the</strong> Little Ice Age (LIA;1850–1500 AD), but that <strong>the</strong> moisture regime variedgreatly with<strong>in</strong> each <strong>of</strong> <strong>the</strong>se two periods. Severe <strong>drought</strong>occurred dur<strong>in</strong>g <strong>the</strong> MCA, as suggested by <strong>the</strong> high averagevalues and dist<strong>in</strong>ct peaks <strong>in</strong> d 18 O (Figure 3a, d5). However,a prolonged wet period (1180–1250 AD) also occurredwith<strong>in</strong> <strong>the</strong> MCA. The lower average values <strong>of</strong> d 18 Obetween 1850 and 1500 AD suggest that <strong>the</strong> LIA wasgenerally wetter. However, <strong>the</strong> LIA was punctuated by<strong>drought</strong> episodes, as evidenced by several pronouncedd 18 O peaks (Figure 3a, d3 and d4).[11] Some <strong>of</strong> <strong>the</strong> <strong>drought</strong> patterns <strong>in</strong>ferred from <strong>the</strong> SteelLake d 18 O record agree with data from o<strong>the</strong>r sites <strong>in</strong> <strong>the</strong><strong>North</strong> <strong>American</strong> midcont<strong>in</strong>ent. For example, <strong>the</strong> occurrence<strong>of</strong> severe <strong>drought</strong> dur<strong>in</strong>g <strong>the</strong> MCA has been documented <strong>in</strong>paleoclimatic records from <strong>the</strong> Great Pla<strong>in</strong>s [Laird et al.,1996] (Figure 1a, site 1 and Figure 3a), western [Cook et al.,2004] (Figure 3a), and midwestern [Booth et al., 2006]United States. Fur<strong>the</strong>rmore, tree-r<strong>in</strong>g records <strong>in</strong>dicate severe<strong>drought</strong> episodes around 1800 AD <strong>in</strong> <strong>the</strong> central Canadianprairie region [Case and MacDonald, 1995] (Figure 1a, site2) and dur<strong>in</strong>g <strong>the</strong> 16th century <strong>in</strong> <strong>the</strong> sou<strong>the</strong>rn RockyMounta<strong>in</strong>s [Gray et al., 2003] (Figure 1a, site 3). Thussome <strong>of</strong> <strong>the</strong>se <strong>drought</strong> events might have been widespreadacross <strong>the</strong> <strong>North</strong> <strong>American</strong> midcont<strong>in</strong>ent.[12] The tim<strong>in</strong>g <strong>of</strong> a mean-state shift <strong>in</strong> a paleoclimaticrecord depends, <strong>in</strong> part, on <strong>the</strong> length <strong>of</strong> <strong>the</strong> record. Because<strong>of</strong> <strong>the</strong> scarcity <strong>of</strong> high-resolution climatic reconstructionsthat extend beyond <strong>the</strong> past 2000 years from <strong>the</strong> region, it isdifficult to assess <strong>the</strong> spatial extent <strong>of</strong> <strong>the</strong> mean-statehydroclimatic shift around 300 AD, as <strong>in</strong>ferred from <strong>the</strong>Steel Lake record. A high-resolution diatom record <strong>of</strong> <strong>the</strong>past 2300 years from Moon lake <strong>in</strong> eastern <strong>North</strong> Dakota[Laird et al., 1996] also shows that <strong>the</strong> regional climate wasgenerally dry before 300 AD but a mean-state shift appearedto have occurred at 1200 AD (Figure 3a). A mean-state shiftat 300 AD did not occur <strong>in</strong> areas far<strong>the</strong>r to <strong>the</strong> west on <strong>the</strong>basis <strong>of</strong> paleoclimatic records from Foy Lake <strong>in</strong> northwesternMontana [Stevens et al., 2006] (Figure 1a, site 4) andKettle Lake <strong>in</strong> northwestern <strong>North</strong> Dakota [Brown et al.,2005] (Figure 1a, site 5). Discrepancies <strong>in</strong> <strong>the</strong> tim<strong>in</strong>g and/ordirection <strong>of</strong> <strong>late</strong>-<strong>Holocene</strong> hydroclimatic change have beenreported previously [Fritz et al., 2000; Laird et al., 2003],although regional coherency <strong>in</strong> terms <strong>of</strong> <strong>the</strong> tim<strong>in</strong>g <strong>of</strong> majorshifts has also been documented among certa<strong>in</strong> sites [Lairdet al., 2003]. These discrepancies may reflect proxy sensitivitydifferences, spatial heterogeneity <strong>of</strong> climatic change,and/or chronological uncerta<strong>in</strong>ties.[13] To assess <strong>the</strong> relative variability <strong>of</strong> <strong>drought</strong> occurrenceat <strong>the</strong> centennial time scale (Figure 3b), we firstresampled <strong>the</strong> d 18 O data at 5-year resolution for <strong>the</strong> past250 years to match <strong>the</strong> resolution for <strong>the</strong> rema<strong>in</strong>der <strong>of</strong><strong>the</strong> record and <strong>the</strong>n detrended <strong>the</strong> d 18 O time series with a100- year time w<strong>in</strong>dow. Relative variability was calcu<strong>late</strong>das: 1 P jx xj, where x is <strong>the</strong> d 18 O value <strong>of</strong> each sample,nand x <strong>the</strong> mean d 18 O value and n <strong>the</strong> number <strong>of</strong> data po<strong>in</strong>tswith<strong>in</strong> <strong>the</strong> mov<strong>in</strong>g w<strong>in</strong>dow. This measure <strong>of</strong> variability doesnot differentiate <strong>the</strong> frequency and magnitude <strong>of</strong> <strong>drought</strong>based on d 18 O. In addition, because our sample resolution atevery 5 years masks <strong>the</strong> <strong>in</strong>ter-annual variation <strong>in</strong> <strong>the</strong> <strong>drought</strong>regime, <strong>the</strong> relative variability, as def<strong>in</strong>ed here, is at best anapproximation <strong>of</strong> <strong>the</strong> real variability <strong>in</strong> <strong>the</strong> moisture regime.[14] Results <strong>in</strong>dicate much greater variability before1900 AD than after, with particularly pronounced variationdur<strong>in</strong>g certa<strong>in</strong> time <strong>in</strong>tervals (e.g. 1100–1700 AD). Some<strong>of</strong> <strong>the</strong>se periods <strong>of</strong> high variability were probably widespread.For example, <strong>drought</strong> variability at Moon Lake[Laird et al., 1996] was high <strong>in</strong> several time <strong>in</strong>tervals whenvariability was also high at Steel Lake (e.g., around 1600AD, 750 AD, 200 AD, and 200 BC; data not shown).Periods with variability similar to that <strong>of</strong> <strong>the</strong> 20th century atSteel Lake spanned a maximum <strong>of</strong> one to two centuries,and <strong>the</strong>y were <strong>in</strong>termittent among multi-centennial <strong>in</strong>tervals<strong>of</strong> greater variability (Figure 3b). In all, 90% <strong>of</strong> <strong>the</strong>variability values dur<strong>in</strong>g <strong>the</strong> last 3100 years were greaterthan <strong>the</strong> average <strong>of</strong> <strong>the</strong> 20th century. Thus <strong>drought</strong> variabilitywas anomalously low dur<strong>in</strong>g <strong>the</strong> 20th century. Thislow variability was atypical <strong>of</strong> <strong>the</strong> last 3100 years, and itprobably should not be expected as <strong>the</strong> prevail<strong>in</strong>g state <strong>of</strong>variability for <strong>the</strong> future.[15] To help elucidate <strong>the</strong> factors controll<strong>in</strong>g <strong>drought</strong>occurrence, we compared <strong>the</strong> 20th-century d 18 O data fromSteel Lake with several <strong>in</strong>dices <strong>of</strong> climatic modes (e.g.,PDO, AMO, PNA, and ENSO) that are known to <strong>in</strong>fluenceatmospheric circulation and <strong>the</strong> moisture regime <strong>of</strong> <strong>the</strong><strong>North</strong> <strong>American</strong> midcont<strong>in</strong>ent today [e.g., McCabe et al.,2004]. d 18 O is not significantly corre<strong>late</strong>d with <strong>the</strong> <strong>in</strong>dices<strong>of</strong> <strong>the</strong>se climatic modes except <strong>the</strong> PDO, a long-lived ElNiño-like pattern <strong>of</strong> sea surface temperature (SST) variabil-4<strong>of</strong>6
L23702 TIAN ET AL.: MIDWEST DROUGHT HISTORY L23702ity <strong>in</strong> <strong>the</strong> <strong>North</strong> Pacific. As illustrated <strong>in</strong> Figure 2, a highlysignificant, positive correlation (r = 0.63, n = 32, p