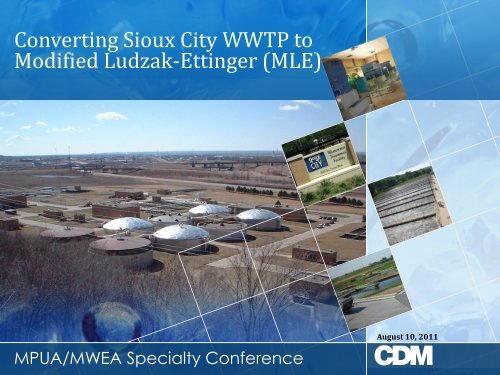
Converting Sioux City WWTP to Modified Ludzak-Ettinger (MLE)
Converting Sioux City WWTP to Modified Ludzak-Ettinger (MLE)
Converting Sioux City WWTP to Modified Ludzak-Ettinger (MLE)
Create successful ePaper yourself
Turn your PDF publications into a flip-book with our unique Google optimized e-Paper software.
<strong>Converting</strong> <strong>Sioux</strong> <strong>City</strong> <strong>WWTP</strong> <strong>to</strong><strong>Modified</strong> <strong>Ludzak</strong>-<strong>Ettinger</strong> (<strong>MLE</strong>)MPUA/MWEA Specialty ConferenceAugust 10, 2011
Existing Wastewater Treatment Facility• Population ~80,000• 320 Miles of Sewers• 12 WW Pump Stations• Primary Treatment 1961• Headworks & DigesterImprovements 2006-8• Secondaries added 1978• (4) 4-pass Step FeedAeration Basins• (4) Final Clarifiers
Recent Facility Planning His<strong>to</strong>ry• Current NPDES Permit (issued Oct. 2006)– Seasonal Ammonia-based effluent limits– Monthly Average 26 <strong>to</strong> 92 mg/L– Daily Maximum 53 <strong>to</strong> 97 mg/L– Compliance schedule thru August 2011• Facility Plan completed in 2008 (Veenstra& Kimm, Inc.)• CDM completed design and constructionpermitting process for recommendedtreatment improvements
Facility Plan Approach <strong>to</strong> NitrogenConventional Activated Sludge(nitrification)vs.<strong>Modified</strong> Ludzack-<strong>Ettinger</strong> (<strong>MLE</strong>)(nitrification/de-nitrification)• Current Industrial loading vs.reduced loading• Wet weather treatment alternatives• More stringent ammonia limits• IDNR Design Criteria
Facility Plan Approach <strong>to</strong> Nitrogen• <strong>MLE</strong> Process Selected:– No reduction in industrial loads– Secondary treatment of peak flow• (2) Add’l AerationBasins – (6) <strong>to</strong>tal• (1) Add’l FinalClarifier – (5) <strong>to</strong>tal• Benefits/Advantages:– Reduced power, alkalinity cost– Comparable capital cost– Reserve capacity via criteriaupdate*– Expansion <strong>to</strong> <strong>to</strong>tal nitrogen/BNR– No de-nitrification in FinalClarifiers.
Biological Nitrification Basics• TKN NO 3-(Nitrate)• O 2 demand 4.5 mg O 2 /mgAmmonia• Alkalinity demand 7.1 mg CaCO3/mg AmmoniaO 2O 2OrganicNitrogenAnaerobic orAerobicBacteriaAmmoniaNitrogenNitrosomonosBacteriaNitriteNitrobacterBacteriaNitrateAlkalinityAlkalinity
De-Nitrification Basics•-Nitrate NO 3 Nitrogen Gas• Occurs in the absence of molecular oxygen• NO 3 used instead of O 2 as an electron accep<strong>to</strong>r• Anoxic contact time (2 <strong>to</strong> 4 hours) w/ Mixing• Carbon source is required for denitrification• O 2 recovery 2.8 mg O 2 /mg NO - 3 reduced•-Alkalinity recovery 3.0 mg CaCO 3 /mg NO 3
<strong>Modified</strong> Ludzack-<strong>Ettinger</strong> (1973)<strong>MLE</strong>Internal RecycleNitrate Rich MLSS
Influent Loading CriteriaDesign Year2021ParameterFlowMGDBODLbs/day(mg/L)TSSLbs/day(mg/L)NH3Lbs/day(mg/L)TKNLbs/day(mg/L)Average DailyFlow(ADF)15.9873,242(550)53,267(400)7,324(55.0)9,721(73.0)Avg. WetWeather (AWW)17.687,208(595)69,676(475)8,540(58.2)12,338(84.1)Max. WetWeather (MWW)28.7390,208(376)74,700(312)8,540(35.7)12,338(51.5)Peak Hour(PHWW)56.54 - - - -*Current Permit Loadings: Ref’nce 2008 Facility Plan by Veenstra & KimmTerminology: AWW = Max Month; MWW = Max Day, PHWW =Peak Hour
BioWin Process Flow ChartPlant InfluentPCsSelec<strong>to</strong>r 1Selec<strong>to</strong>r 2 Selec<strong>to</strong>r 3 AnoxicEffluentFCsPass 4Pass 3Pass 2GBT'sIndustrial InfluentBFP'sAnaerobic DigestersCake<strong>MLE</strong> Secondarytreatment process
BioWin Simulation ResultsFlow(SRT)BODmg/LTSSmg/LNH3mg/LTKNmg/LTotal-Nmg/L16.0 MGD(7.8 days)17.6 MGD(6.8 days)28.73 MGD(6.8 days)Influent 550 400 55 73 73Effluent 2.5 5.0 0.05 2.7 11Influent 595 475 58.2 84.1 84.1Effluent 3.0 5.0 0.05 2.9 13.5Influent 376 312 35.7 51.5 51.5Effluent 4.5 10 0.05 2.2 11.3
Secondary Treatment ImprovementsModifications <strong>to</strong>Existing 4 AerationBasinsBlower, Pumps,and PipingUpgradesLimeSystem(Alkalinity)1 2 345Two New<strong>MLE</strong>AerationBasins656New FinalClarifierFuture FinalClarifier
<strong>MLE</strong> ProcessAeration BasinsEffluentPass 4InternalRecyclePass 3Pass 2InfluentRASMixersPass 1Anoxic
Aeration Basin ConversionModifications <strong>to</strong>Existing 4 AerationBasins1 2 345656Grit Removal
Aeration Basin ConversionModifications <strong>to</strong>Existing 4 AerationBasins1 2 345656Air pipe demo, modifications
Aeration Basin ConversionModifications <strong>to</strong>Existing 4 AerationBasins1 2 345656Fine bubble diffusers,Internal Recycle pump
Aeration Basin ConversionModifications <strong>to</strong>Existing 4 AerationBasins1 2 345656Anoxic Selec<strong>to</strong>r Zones, mixers
New Aeration BasinsConstruct AerationBasins 5 and 61 2 345656
Process Air ImprovementsBlower buildingImprovements1 2 345656(4) New Multi-stage, 1000 HP ea.;(3) Re-built Multi-stage, 400 HP ea.
New Final Clarifier1 2 3412563 456Splitter StructuresWeir brushesConstruct New FinalClarifier #5
Lime Silo1 2 3412563 4Slurry Feed, 1600 CF s<strong>to</strong>rageEst. < 30 days/year usage56
Effluent: pHmoni<strong>to</strong>ring in effluentfor local manual orau<strong>to</strong> lime feed controlDOProcess ControlAeration Basin:Internal Blower Staging Recycle: based onVFD Dissolved w/ Local Oxygen and (DO) atRemote end of Passes Au<strong>to</strong> Control, 2 and 4 andPass Blower 1 DO control 0.3 package mg/lPass 4DODOInternal Recycle:VFD w/ Local andRemote Au<strong>to</strong> Control,Pass 1 DO 0.3 mg/lInfluent: Flow meterw/ Local and Remotemanual valve controlRAS Feed: Flow meter w/Local Manual and Remotemanual and au<strong>to</strong> valve controlPass 3Pass 2Pass 1Anoxic
Multi-Blower SequencingBlower Control ViaMaster DissolvedOxygen ControlSystem (MDOCS)
Construction Results• $27 million construction cost•
Recent PerformanceFlow(SRT)BODmg/LTSSmg/LNH3mg/LTKNmg/LTotal-Nmg/L16.0 MGD(7.8 days)17.6 MGD(6.8 days)28.73 MGD(6.8 days)June 201131.0 MGDInfluent 550 400 55 73 73Effluent 2.5 5.0 0.05 2.7 11Influent 595 475 58.2 84.1 84.1Effluent 3.0 5.0 0.05 2.9 13.5Influent 376 312 35.7 51.5 51.5Effluent 4.5 10 0.05 2.2 11.3Influent 178 247 - 23.4 23.4Effluent 6.1 12.7
Next StepsFACILITY PLANNING• Quantify Actual <strong>WWTP</strong> Capacity– Re-calibrate modeling with actual operational data– Participate in IDNR Criteria revision• Nutrient Removal??– Evaluate improvement alternatives forvarious “Tiers”• Capital Improvement Plan– Asset Renewal– Expansion/Re-rating
Engineering Consulting ServicesThe <strong>City</strong> of <strong>Sioux</strong> <strong>City</strong>, IowaQUESTIONSAugust 2, 2011



![VIA CERTIFIED MAIL (Return Receipt Requested) [DATE] Ms ...](https://img.yumpu.com/43063436/1/190x245/via-certified-mail-return-receipt-requested-date-ms-.jpg?quality=85)
