Thyrotropin (TSH) - Diagnostic Automation : Cortez Diagnostics
Thyrotropin (TSH) - Diagnostic Automation : Cortez Diagnostics
Thyrotropin (TSH) - Diagnostic Automation : Cortez Diagnostics
Create successful ePaper yourself
Turn your PDF publications into a flip-book with our unique Google optimized e-Paper software.
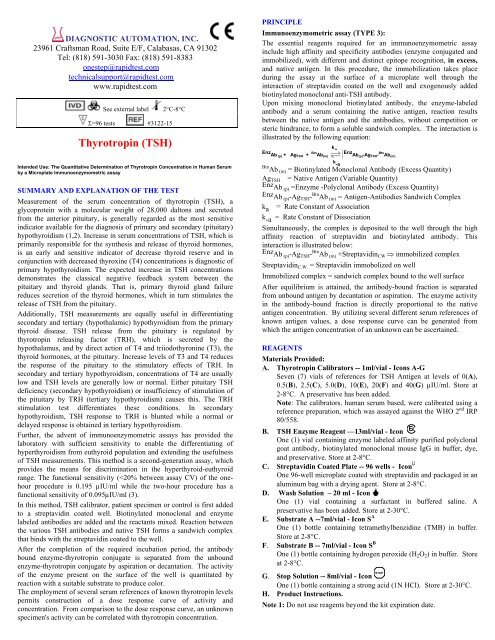
DIAGNOSTIC AUTOMATION, INC.23961 Craftsman Road, Suite E/F, Calabasas, CA 91302Tel: (818) 591-3030 Fax: (818) 591-8383onestep@rapidtest.comtechnicalsupport@rapidtest.comwww.rapidtest.comSee external labelΣ=96 tests #3122-15<strong>Thyrotropin</strong> (<strong>TSH</strong>)2°C-8°CPRINCIPLEImmunoenzymometric assay (TYPE 3):The essential reagents required for an immunoenzymometric assayinclude high affinity and specificity antibodies (enzyme conjugated andimmobilized), with different and distinct epitope recognition, in excess,and native antigen. In this procedure, the immobilization takes placeduring the assay at the surface of a microplate well through theinteraction of streptavidin coated on the well and exogenously addedbiotinylated monoclonal anti-<strong>TSH</strong> antibody.Upon mixing monoclonal biotinylated antibody, the enzyme-labeledantibody and a serum containing the native antigen, reaction resultsbetween the native antigen and the antibodies, without competition orsteric hindrance, to form a soluble sandwich complex. The interaction isillustrated by the following equation:k aEnz Ab (p) + Ag <strong>TSH</strong> + Btn Ab (m)Enz Ab(p) -Ag <strong>TSH</strong> - Btn Ab (m)Intended Use: The Quantitative Determination of <strong>Thyrotropin</strong> Concentration in Human Serumby a Microplate Immunoenzymometric assaySUMMARY AND EXPLANATION OF THE TESTMeasurement of the serum concentration of thyrotropin (<strong>TSH</strong>), aglycoprotein with a molecular weight of 28,000 daltons and secretedfrom the anterior pituitary, is generally regarded as the most sensitiveindicator available for the diagnosis of primary and secondary (pituitary)hypothyroidism (1,2). Increase in serum concentrations of <strong>TSH</strong>, which isprimarily responsible for the synthesis and release of thyroid hormones,is an early and sensitive indicator of decrease thyroid reserve and inconjunction with decreased thyroxine (T4) concentrations is diagnostic ofprimary hypothyroidism. The expected increase in <strong>TSH</strong> concentrationsdemonstrates the classical negative feedback system between thepituitary and thyroid glands. That is, primary thyroid gland failurereduces secretion of the thyroid hormones, which in turn stimulates therelease of <strong>TSH</strong> from the pituitary.Additionally, <strong>TSH</strong> measurements are equally useful in differentiatingsecondary and tertiary (hypothalamic) hypothyroidism from the primarythyroid disease. <strong>TSH</strong> release from the pituitary is regulated bythyrotropin releasing factor (TRH), which is secreted by thehypothalamus, and by direct action of T4 and triiodothyronine (T3), thethyroid hormones, at the pituitary. Increase levels of T3 and T4 reducesthe response of the pituitary to the stimulatory effects of TRH. Insecondary and tertiary hypothyroidism, concentrations of T4 are usuallylow and <strong>TSH</strong> levels are generally low or normal. Either pituitary <strong>TSH</strong>deficiency (secondary hypothyroidism) or insufficiency of stimulation ofthe pituitary by TRH (tertiary hypothyroidism) causes this. The TRHstimulation test differentiates these conditions. In secondaryhypothyroidism, <strong>TSH</strong> response to TRH is blunted while a normal ordelayed response is obtained in tertiary hypothyroidism.Further, the advent of immunoenzymometric assays has provided thelaboratory with sufficient sensitivity to enable the differentiating ofhyperthyroidism from euthyroid population and extending the usefulnessof <strong>TSH</strong> measurements. This method is a second-generation assay, whichprovides the means for discrimination in the hyperthyroid-euthyroidrange. The functional sensitivity (
Note 2:Opened reagents are stable for sixty (60) days when stored at2-8°C.Note 3: Above reagents are for a single 96-well microplate.Required But Not Provided:1. Pipette(s) capable of delivering 50µl and 100µl volumes with aprecision of better than 1.5%.2. Dispenser(s) for repetitive deliveries of 0.100ml and 0.300ml volumeswith a precision of better than 1.5% (optional).3. Microplate washer or a squeeze bottle (optional).4. Microplate Reader with 450nm and 620nm wavelength absorbancecapability.5. Absorbent Paper for blotting the microplate wells.6. Plastic wrap or microplate cover for incubation steps.7. Vacuum aspirator (optional) for wash steps.8. Timer.9. Storage container for storage of wash buffer.10. Distilled or deionized water.11. Quality Control Materials.PRECAUTIONSFor In Vitro <strong>Diagnostic</strong> UseNot for Internal or External Use in Humans or AnimalsAll products that contain human serum have been found to be nonreactivefor Hepatitis B Surface antigen, HIV 1&2 and HCV antibodiesby FDA required tests. Since no known test can offer completeassurance that infectious agents are absent, all human serum productsshould be handled as potentially hazardous and capable of transmittingdisease. Good laboratory procedures for handling blood products canbe found in the Center for Disease Control / National Institute of Health,"Biosafety in Microbiological and Biomedical Laboratories," 2ndEdition, 1988, HHSSPECIMEN COLLECTION AND PREPARATIONThe specimens shall be blood serum in type and the usual precautions inthe collection of venipuncture samples should be observed. For accuratecomparison to established normal values, a fasting morning serumsample should be obtained. The blood should be collected in a plainredtop venipuncture tube without additives or gel barrier. Allow theblood to clot. Centrifuge the specimen to separate the serum from thecells.Samples may be refrigerated at 2-8°C for a maximum period of five (5)days. If the specimen(s) cannot be assayed within this time, the sample(s)may be stored at temperatures of -20°C for up to 30 days. Avoidrepetitive freezing and thawing. When assayed in duplicate, 0.100 ml ofthe specimen is required.REAGENT PREPARATION:1. Wash BufferDilute contents of wash solution to 1000ml with distilled or deionizedwater in a suitable storage container. Store at room temperature 20-27°C for up to 60 days.2. Working Substrate SolutionPour the contents of the amber vial labeled Solution ‘A’ into the clearvial labeled Solution ‘B’. Place the yellow cap on the clear vial foreasy identification. Mix and label accordingly. Store at 2 - 8°C.Note: Do not use the working substrate if it looks blue.TEST PROCEDUREBefore proceeding with the assay, bring all reagents, serum referencesand controls to room temperature (20 - 27° C).1. Format the microplates’ wells for each serum reference, control andpatient specimen to be assayed in duplicate. Replace any unusedmicrowell strips back into the aluminum bag, seal and store at 2-8°C.2. Pipette 0.050 ml (50µl) of the appropriate serum reference, control orspecimen into the assigned well.3. Add 0.100 ml (100µl) of the <strong>TSH</strong> Enzyme Reagent to each well. It isvery important to dispense all reagents close to the bottom of thecoated well.4. Swirl the microplate gently for 20-30 seconds to mix and cover.5. Incubate 60 minutes at room temperature. **6. Discard the contents of the microplate by decantation or aspiration. Ifdecanting, tap and blot the plate dry with absorbent paper.7. Add 300µl of wash buffer (see Reagent Preparation Section) decant(tap and blot) or aspirate. Repeat two (2) additional times for a total ofthree (3) washes. An automatic or manual plate washer can beused. Follow the manufacturer’s instruction for proper usage. If asqueeze bottle is employed, fill each well by depressing thecontainer (avoiding air bubbles) to dispense the wash. Decant thewash and repeat two (2) additional times.8. Add 0.100 ml (100µl) of working substrate solution to all wells (seeReagent Preparation Section). Always add reagents in the sameorder to minimize reaction time differences between wells.DO NOT SHAKE THE PLATE AFTER SUBSTRATE ADDITION9. Incubate at room temperature for fifteen (15) minutes.10. Add 0.050ml (50µl) of stop solution to each well and mix gently for15-20 seconds. Always add reagents in the same order to minimizereaction time differences between wells.11. Read the absorbance in each well at 450nm (using a referencewavelength of 620-630nm to minimize well imperfections) in amicroplate reader. The results should be read within thirty (30)minutes of adding the stop solution.** For better low-end sensitivity (< 0.5µIU/ml), incubate 120 minutes atroom temperature. The 40µIU/ml calibrator should be excluded sinceabsorbance over 3.0 units will be experienced. Follow the remainingsteps.QUALITY CONTROLEach laboratory should assay controls at levels in the low, normal, andelevated range for monitoring assay performance. These controls shouldbe treated as unknowns and values determined in every test procedureperformed. Quality control charts should be maintained to follow theperformance of the supplied reagents. Pertinent statistical methods shouldbe employed to ascertain trends. The individual laboratory should setacceptable assay performance limits. Other parameters that should bemonitored include the 80, 50 and 20% intercepts of the dose responsecurve for run-to-run reproducibility. In addition, maximum absorbanceshould be consistent with past experience. Significant deviation fromestablished performance can indicate unnoticed change in experimentalconditions or degradation of kit reagents. Fresh reagents should be usedto determine the reason for the variations.
CALCULATION OF RESULTSA dose response curve is used to ascertain the concentration ofthyrotropin in unknown specimens.1. Record the absorbance obtained from the printout of the microplatereader as outlined in Example 12. Plot the absorbance for each duplicate serum reference versus thecorresponding <strong>TSH</strong> concentration in µIU/ml on linear graph paper(do not average the duplicates of the serum references beforeplotting).3. Draw the best-fit curve through the plotted points.4. To determine the concentration of <strong>TSH</strong> for an unknown, locate theaverage absorbance of the duplicates for each unknown on thevertical axis of the graph, find the intersecting point on the curve, andread the concentration (in µIU/ml) from the horizontal axis of thegraph (the duplicates of the unknown may be averaged as indicated).In the following example, the average absorbance (0.775) intersectsthe dose response curve at (7.66 µIU/ml) <strong>TSH</strong> concentration (SeeFigure 1).SampleI.D.Cal ACal BCal CCal DCal ECal FCal GControlPatientWellNumberAbsA1 0.018B1 0.021C1 0.076D1 0.082E1 0.302F1 0.293G1 0.556H1 0.577A2 0.926B2 0.916C2 1.610D2 1.629E2 2.694F2 2.647G2 0.800H2 0.751A3 1. 391B3 1.375AbsEXAMPLE 1Mean(µIU/ml)0.019 00.079 0.50.298 2.50.567 5.00.921 101.619 202671 400.775 7.661.383 16.65*The data presented in Example 1 and Figure 1 are for illustration only and should not be used in lieu of adose response curve prepared with each assay..Absorbance(s)3.0002.5002.0001.5001.0000.500Figure 1PatientValue0.0000 5 10 15 20 25 30 35 40<strong>TSH</strong> Values in µIU/mlQ.C. PARAMETERSIn order for the assay results to be considered valid the following criteriashould be met:1. The absorbance of calibrator ‘G’ (40 µIU/ml) should be > 1.3.2. Four out of six quality control pools should be within the establishedranges.LIMITATIONS OF PROCEDUREA. Assay Performance1. It is important that the time of reaction in each well is held constant forreproducible results.2. Pipetting of samples should not extend beyond ten (10) minutes toavoid assay drift.3. If more than one (1) plate is used, it is recommended to repeat the doseresponse curve.4. Addition of the substrate solution initiates a kinetic reaction, which isterminated by the addition of the stop solution. Therefore, the additionof the substrate and the stopping solution should be added in the samesequence to eliminate any time-deviation during reaction.5. Plate readers measure vertically. Do not touch the bottom of the wells.6. Failure to remove adhering solution adequately in the aspiration ordecantation wash step(s) may result in poor replication and spuriousresults.7. Use components from the same lot. No intermixing of reagents fromdifferent batches8. Highly lipemic, hemolyzed or grossly contaminated specimen(s)should not be usedB. Interpretation1. If computer controlled data reduction is used to interpret the results ofthe test, it is imperative that the predicted values for the calibrators fallwithin 10% of the assigned concentrations.2. Serum <strong>TSH</strong> concentration is dependent upon a multiplicity of factors:hypothalamus gland function, thyroid gland function, and theresponsiveness of pituitary to TRH. Thus, thyrotropin concentrationalone is not sufficient to assess clinical status.3. Serum <strong>TSH</strong> values may be elevated by pharmacological intervention.Domperiodone, amiodazon, iodide, phenobarbital, and phenytoin havebeen reported to increase <strong>TSH</strong> levels.4. A decrease in thyrotropin values has been reported with theadministration of propranolol, methimazol, dopamine and d-thyroxine(4)..5. Genetic variations or degradation of intact <strong>TSH</strong> into subunits mayaffect the binding characteristics of the antibodies and influence thefinal result. Such samples normally exhibit different results amongvarious assay systems due to the reactivity of the antibodies involved.."NOT INTENDED FOR NEWBORN SCREENING"EXPECTED RANGES OF VALUESA study of euthyroid adult population was undertaken to determineexpected values for the <strong>TSH</strong> ELISA Test System. The number anddetermined range are given in Table 1. A nonparametric method (95%Percentile Estimate) was used.TABLE IExpected Values for the <strong>TSH</strong> ELISA Test System(in µIU/ml)Number 139Low Normal Range 0.39High Normal Range 6.1670% Confidence Intervals for 2.5 PercentileLow Range 0.28 – 0.53High Range 5.60 – 6.82It is important to keep in mind that establishment of a range of valueswhich can be expected to be found by a given method for a population of"normal"-persons is dependent upon a multiplicity of factors: thespecificity of the method, the population tested and the precision of themethod in the hands of the analyst. For these reasons each laboratoryshould depend upon the range of expected values established by themanufacturer only until an in-house range can be determined by theanalysts using the method with a population indigenous to the area inwhich the laboratory is located.
PERFORMANCE CHARACTERISTICSA. PrecisionThe within and between assay precisions of the <strong>TSH</strong> test system weredetermined by analyses on two different levels of pool control sera. Thenumber (N), mean (X) value, standard deviation (σ) and coefficient ofvariation (C.V.) for each of these control sera are presented in Table 2and Table 3.TABLE 2Within Assay Precision (Values in µIU/ml)Sample N X σ C.V.Pool 1 24 0.37 0.03 8.1%Pool 2 24 6.75 0.43 6.4%Pool 3 24 29.30 1.94 6.6%TABLE 3Between Assay Precision* (Values in µIU/ml)Sample N X σ C.V.Pool 1 10 0.43 0.04 9.3%Pool 2 10 6.80 0.54 7.9%Pool 3 10 28.40 1.67 5.9%*As measured in ten experiments in duplicate over seven days.B. AccuracyThe <strong>TSH</strong> ELISA test system was compared with a referenceimmunochemiluminescence assay. Biological specimens fromhypothyroid, euthyroid and hyperthyroid populations were used (Thevalues ranged from 0.01µIU/ml – 61µIU/ml). The total number of suchspecimens was 241. The least square regression equation and thecorrelation coefficient were computed for the <strong>TSH</strong> ELISA method incomparison with the reference method. The data obtained is displayed inTable 4.TABLE 4Least SquareRegression CorrelationMethod Mean (x) Analysis CoefficientThis Method 4.54 y = 0.47 + 0.968 (x) 0.995Reference 4.21Only slight amounts of bias between the <strong>TSH</strong> ELISA method and thereference method are indicated by the closeness of the mean values. Theleast square regression equation and correlation coefficient indicatesexcellent method agreement.C. SensitivityThe sensitivity (detection limit) was ascertained by determining thevariability of the 0 µIU/ml serum calibrator and using the 2σ (95%certainty) statistic to calculate the minimum dose:For I hr incubation = 0.078 µIU/mlFor 2 hr incubation = 0.027 µIU/ml.D. SpecificityThe cross-reactivity of the <strong>TSH</strong> ELISA test system to selected substanceswas evaluated by adding the interfering substance to a serum matrix atvarious concentrations. The cross-reactivity was calculated by deriving aratio between dose of interfering substance to dose of thyrotropin neededto produce the same absorbance.Substance Cross Reactivity Concentration<strong>Thyrotropin</strong> (h<strong>TSH</strong>) 1.0000 -Follitropin (hFSH) < 0.0001 1000ng/mlLutropin Hormone (hLH) < 0.0001 1000ng/mlChorionic Gonadotropin (hCG) < 0.0001 1000ng/mlREFERENCES1. Hopton MR, & Harrap JJ, “Immunoradiometric assay of thyrotropin asa first line thyroid function test in the routine laboratory”, ClinicalChemistry, 32, 691 (1986).2. Caldwell, G et al, “A new strategy for thyroid function testing”,Lancet, I, 1117 (1985).3. Young DS, Pestaner LC, and Gilberman U, "Effects of Drugs onClinical Laboratory Tests", Clinical Chemistry, 21, 3660 (1975).4. Spencer, CA, et al, “Interlaboratory/Intermethod differences inFunctional Sensitivity of Immunometric Assays of <strong>Thyrotropin</strong> (<strong>TSH</strong>)and Impact on Reliability of Measurement of SubnormalConcentrations of <strong>TSH</strong>”, Clinical Chemistry, 41, 367 (1995).5. Beck-Peccoz P, Persani L, “Variable biological activity of thyroidstimulating hormone”, Eur J Endocrinol, 131, 331-340 (1994).6. Bravermann, LE, “Evaluation of thyroid status in patients withthyrotoxicosis”, Clin Chem, 42, 174-181 (1996).7. Fisher, DA, “Physiological variations in thyroid hormones.Physiological and pathophysiological considerations”, Clin Chem, 42,135-139 (1996).DIAGNOSTIC AUTOMATION, INC.23961 Craftsman Road, Suite E/F, Calabasas, CA 91302Tel: (818) 591-3030 Fax: (818) 591-8383ISO 13485-2003Revision Date: 8/1/06E. Correlation between 1 hr and 2 hr incubationThe one- (1) hr and two (2) hr (optional) incubation procedures werecompared. Thirty (30) biological specimens (ranging from 0.1 – 18.5µIU/ml) were used The least square regression equation and thecorrelation coefficient were computed for the 2 hr procedure (y) incomparison with the 1 hr method (x). Excellent agreement is evidencedby the correlation coefficient, slope and intercept:Y = 0.986 (x) + 0.119Regression Correlation =0.998


