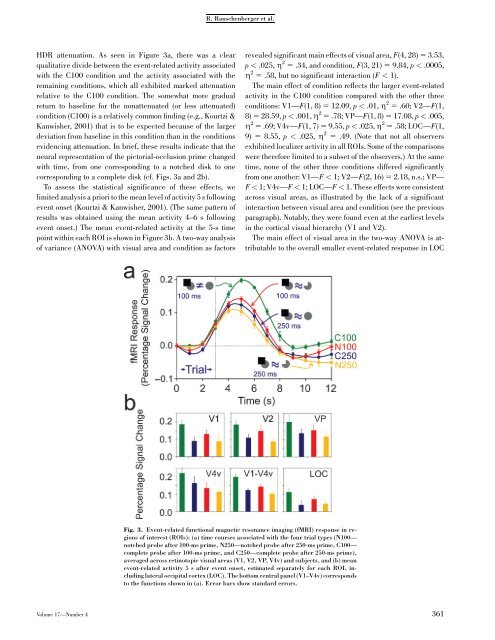
R. Rauschenberger et al.HDR attenuation. As seen in Figure 3a, there was a clearqualitative divide between the event-related activity associatedwith the C100 condition and the activity associated with theremaining conditions, which all exhibited marked attenuationrelative to the C100 condition. The somewhat more gradualreturn to baseline for the nonattenuated (or less attenuated)condition (C100) is a relatively common finding (e.g., Kourtzi &Kanwisher, 2001) that is to be expected because <strong>of</strong> the largerdeviation from baseline in this condition than in the conditionsevidencing attenuation. In brief, these results indicate that theneural representation <strong>of</strong> the pictorial-occlusion prime changedwith time, from one corresponding to a notched disk to onecorresponding to a complete disk (cf. Figs. 3a and 2b).To assess the statistical significance <strong>of</strong> these effects, welimited analysis a priori to the mean level <strong>of</strong> activity 5 s followingevent onset (Kourtzi & Kanwisher, 2001). (The same pattern <strong>of</strong>results was obtained using the mean activity 4–6 s followingevent onset.) The mean event-related activity at the 5-s timepoint within each ROI is shown in Figure 3b. A two-way analysis<strong>of</strong> variance (ANOVA) with visual area and condition as factorsrevealed significant main effects <strong>of</strong> visual area, F(4, 28) 5 3.53,p < .025, Z 2 5 .34, and condition, F(3, 21) 5 9.84, p < .0005,Z 2 5 .58, but no significant interaction (F < 1).The main effect <strong>of</strong> condition reflects the larger event-relatedactivity in the C100 condition compared with the other threeconditions: V1—F(1, 8) 5 12.09, p < .01, Z 2 5 .60; V2—F(1,8) 5 28.59, p < .001, Z 2 5 .78; VP—F(1, 8) 5 17.08, p < .005,Z 2 5 .69; V4v—F(1, 7) 5 9.55, p < .025, Z 2 5 .58; LOC—F(1,9) 5 8.55, p < .025, Z 2 5 .49. (Note that not all observersexhibited localizer activity in all ROIs. Some <strong>of</strong> the comparisonswere therefore limited to a subset <strong>of</strong> the observers.) At the sametime, none <strong>of</strong> the other three conditions differed significantlyfrom one another: V1—F < 1; V2—F(2, 16) 5 2.18, n.s.; VP—F < 1; V4v—F < 1; LOC—F < 1. These effects were consistentacross visual areas, as illustrated by the lack <strong>of</strong> a significantinteraction between visual area and condition (see the previousparagraph). Notably, they were found even at the earliest levelsin the cortical visual hierarchy (V1 and V2).The main effect <strong>of</strong> visual area in the two-way ANOVA is attributableto the overall smaller event-related response in LOCFig. 3. Event-related functional magnetic resonance imaging (fMRI) response in regions<strong>of</strong> interest (ROIs): (a) time courses associated with the four trial types (N100—notched probe after 100-ms prime, N250—notched probe after 250-ms prime, C100—complete probe after 100-ms prime, and C250—complete probe after 250-ms prime),averaged across retinotopic visual areas (V1, V2, VP, V4v) and subjects, and (b) meanevent-related activity 5 s after event onset, estimated separately for each ROI, includinglateral occipital cortex (LOC). The bottom central panel (V1–V4v) correspondsto the functions shown in (a). Error bars show standard errors.Volume 17—Number 4 361
<strong>Neural</strong> <strong>Representation</strong> <strong>of</strong> <strong>Pictorial</strong> <strong>Occlusion</strong>compared with the early retinotopic areas (V1, V2, VP, and V4v;Fig. 3b). Accordingly, an identical ANOVA excluding LOC revealedno significant effect <strong>of</strong> visual area (F < 1), while retainingthe significant main effect <strong>of</strong> condition, F(3, 21) 511.16, p < .0005, Z 2 5 .61, and the nonsignificant interactionbetween visual area and condition (F < 1). Because the interactioncontinued to be nonsignificant, we collapsed across visualareas for all further comparisons reported in the next section.DISCUSSIONThe results show that the neural representation <strong>of</strong> pictorial occlusionevolves over time. At the brief exposure, a notched-diskprobe elicited an attenuated response relative to a completediskprobe (N100 < C100), F(1, 8) 5 25.39, p < .001, Z 2 5 .76,indicating that the pictorial-occlusion prime was represented asnotched in brief exposures. A complete-disc probe elicited anattenuated response at the long exposure relative to the briefexposure (C250 < C100), F(1, 8) 5 26.29, p < .001, Z 2 5 .77,indicating that the pictorial-occlusion prime was represented ascompleted in long exposures (cf. Fig. 2b). (The relatively smallHDR in the C250 condition rules out the possibility that thesimilarly small response for the notched-disk probe was due toits relatively smaller area or related factors.) Note that the verysame stimulus pair (pictorial occlusion-complete disk) producedstrikingly different results depending on the exposureduration, as would be expected if the representation <strong>of</strong> the primeevolved over time.Because we used the pattern <strong>of</strong> results across a number <strong>of</strong>conditions to infer the representation <strong>of</strong> the pictorial-occlusionprime at different points in time, our study has no absolutebaseline against which all the experimental conditions can becompared. It is possible, therefore, that the HDR in the C100condition, which evoked the highest level <strong>of</strong> activity among allconditions, was itself attenuated relative to a completely-differentbaseline. This would be the case if, on a proportion <strong>of</strong>trials, the pictorial-occlusion prime were represented as completedeven in brief displays (cf. Rauschenberger, Peterson,Mosca, & Bruno, 2004).Our conclusions are based on the assumption that the responsesevoked in the C250, N100, and N250 conditions wereattenuated relative to an absolute baseline or, at least, to theresponse in the C100 condition. Might it be the case, however,that the response in the C100 condition was elevated relative tothe remaining conditions? The only plausible explanation forsuch an elevation is an attentional enhancement <strong>of</strong> the HDR inthe C100 condition relative to the other conditions. However, itis quite unlikely that attention is responsible for the observedpattern <strong>of</strong> results. The stimuli in our study were identical withinpairs <strong>of</strong> conditions, and the stimuli in the C100 condition werethe same as those in the C250 condition. Thus, one would have topropose that short exposures are inherently more attention demandingthan long exposures; however, one would then have toexplain why the response in the N100 condition was not alsoelevated. Hence, to explain the observed pattern <strong>of</strong> results asdue to an elevated response in the C100 condition, one mustargue that a complete disk is inherently more attention demandingthan a notched disk is, but only when it is preceded bya brief exposure <strong>of</strong> another stimulus. We see no a priori groundsfor making such an assumption, whereas the patterns we observedcan be accounted for by an evolving representation <strong>of</strong> theprime stimulus over time.As mentioned earlier, interpreting the results <strong>of</strong> the N250condition is not as straightforward as interpreting the results <strong>of</strong>the other three conditions. Statistical analysis revealed that theHDR was significantly attenuated in this condition relative tothe C100 condition, F(1, 8) 5 47.36, p < .0005, Z 2 5 .86.Indeed, the fMRI response in this condition strongly resembledthat in the N100 condition, F(1, 8) 5 4.03, n.s. These resultssuggest that the occluded prime supported adaptation <strong>of</strong> thenotched probe even at the long exposure. This conclusion isconsistent with several recent behavioral studies suggesting thatboth an image-based (2-D) representation and an amodallycompleted (3-D) representation <strong>of</strong> the stimulus arise at longexposure durations (Gerbino, 1989; Rauschenberger et al.,2004). Some caution, however, must be exercised in interpretingthe results <strong>of</strong> the N250 condition. It is not known how long fMRIadaptation effects last; because fMRI adaptation was present at100 ms, it might still have been present in the 250-ms exposure.If the early visual cortical areas indeed sustain both representationsconcurrently, it is conceivable that higher areassustain only the representation that is consciously perceived atany given moment. Single-cell studies <strong>of</strong> perceptual ambiguityhave shown that early visual neurons respond to both interpretations<strong>of</strong> an ambiguous stimulus, whereas the response <strong>of</strong> highervisual neurons is tied to the representation currently dominatingin conscious perception (Sheinberg & Logothetis, 1997). Ourselection <strong>of</strong> relatively early visual areas as ROIs (V1 to LOC),however, does not permit us to determine whether this is also thecase for pictorial-occlusion stimuli, which are, in some sense,perceptually ambiguous (Rauschenberger et al., 2004). Therefore,if a single (completed) representation exists in highervisual areas, we suggest that it might be found in regions locatedmore anterior to LOC within the ventral visual processingstream.A recent study by Lerner et al. (2004) investigated the timecourse <strong>of</strong> perceptual completion using fMRI but failed to findevidence <strong>of</strong> a protracted evolution <strong>of</strong> the neural representation <strong>of</strong>pictorial occlusion. In that study, the HDR to intact, scrambled,and ‘‘partially occluded’’ stimuli, respectively, was measured.The scrambled displays contained thick occluding stripes thatwere identical to those used in the partially occluded condition.The only difference between these two types <strong>of</strong> displays was thatthe image segments in the partially occluded condition possessedgood continuity between the image fragments, so thatthese could potentially be completed into a meaningful whole,362 Volume 17—Number 4