- Page 1 and 2:
FreemantheVOL. 22, NO.1. JANUARY 19
- Page 3 and 4:
ij~ ~I\~©~ @~ ~ ~m~@~~~~W @~[ID~~H
- Page 6 and 7:
6 THE FREEMAN Januarybetween the va
- Page 8 and 9:
8 THE FREEMAN Januaryruns as follow
- Page 10 and 11:
10 THE FREEMAN Januarydented rates
- Page 12 and 13:
'10PAUL L. POIROTSellers BewareA PL
- Page 14 and 15:
14 THE FREEMAN Januarygold. Even an
- Page 16 and 17:
16 THE FREEMAN Januarythese conting
- Page 18 and 19:
18 THE FREEMAN Januarylessness or o
- Page 20 and 21:
20 THE FREEMAN Januarymeasuring thi
- Page 22 and 23:
ECONOMICS:A BranchofMoralPhilosophy
- Page 24 and 25:
24 THE FREEMAN JanuaryVery little,
- Page 26 and 27:
26 THE FREEMAN Januarytrend, the le
- Page 28 and 29:
28MORALITYandCONTROLSMILTON FRIEDMA
- Page 30 and 31:
30 THE FREEMAN JanuaryArbitrary jud
- Page 32 and 33:
32 THE FREEMAN Januarythe controls
- Page 34 and 35:
34 THE FREEMAN Januaryof the founde
- Page 36 and 37:
36 THE FREEMAN Januaryservice alone
- Page 38 and 39:
38 THE FREEMAN Januarythe mounting
- Page 40 and 41:
40 THE FREEMAN JanuaryThe Need for
- Page 42 and 43:
CLARENCE B. CARSONTHEFOUNDINGOFTHEA
- Page 44 and 45:
44 THE FREEMAN Januarymestic cider
- Page 46 and 47:
46 THE FREEMAN January(It is intere
- Page 48 and 49:
48 THE FREEMAN Januarymight dispose
- Page 50 and 51:
50 THE FREEMAN JanuaryDutch Wa.r...
- Page 52 and 53:
52 THE FllEEMAN Januaryconflict, a
- Page 54 and 55:
54 THE FREEMAN Janua'fYIn sum, the
- Page 56 and 57:
56 THE FREEMAN JanuaryLucky Acciden
- Page 58 and 59:
58 THE FREEMAN Janu.aryof poverty a
- Page 60 and 61:
60 THE FREEMAN JanuaryThis "dual fo
- Page 62 and 63:
62 THE FREEMAN Januaryhowever, the
- Page 64 and 65:
64 THE FREEMAN JanuaryThere were em
- Page 66 and 67:
tt1eFreemanA ·MONTHLY JOURNAL OF I
- Page 68 and 69:
68 THE FREEMAN Februa.rycover and c
- Page 70 and 71:
70 THE FREEMANterms, according to t
- Page 72 and 73:
72 THE FREEMAN FebruaryMy point is
- Page 74 and 75:
74 THE FREEMAN Februarybetween this
- Page 76 and 77:
ON RE-READINGRAY L. COLVARDTHE STOR
- Page 78 and 79:
78 THE FREEMAN February3-R's of the
- Page 80 and 81:
80 THE FREEMAN Februarybecome nonco
- Page 82 and 83:
82 THE FREEMAN Februa,ryOur Contine
- Page 84 and 85:
84 THE FREEMAN Februaryit may, rath
- Page 86 and 87:
86 THE FREEMAN FebruaryWithout Brit
- Page 88 and 89:
88 THE FREEMAN Februaryism, or Budd
- Page 90 and 91:
90 THE FREEMAN Februarythey broke w
- Page 92 and 93:
92 THE F'REEMAN Februaryyears old.
- Page 94 and 95:
94 THE FREEMAN Februarythe Third Wo
- Page 96 and 97:
96 THE FREEMAN Februaryinduce young
- Page 98 and 99:
98 THE FREEMAN Februarytary declare
- Page 100 and 101:
)WE-kL-T-H? •HENRY HAZLITTFROM TI
- Page 102 and 103:
102 . THE FREEMAN Februarybe got to
- Page 104 and 105:
104 THE FREEMAN Februaryoriginal mo
- Page 106 and 107:
106 THE FREEMAN Februarysmall plots
- Page 108 and 109:
108 THE FREEMAN Februarystructure n
- Page 110 and 111:
110 THE FREEMAN February ,public fu
- Page 112 and 113:
CLARENCE B. CARSONTHEFOUNDINGOFTHEA
- Page 114 and 115:
114 THE FREEMAN FebruaryWrits of As
- Page 116 and 117:
116 THE FREEMAN Februaryyear was no
- Page 118 and 119:
118 THE FREEMAN Februaryancient loy
- Page 120 and 121:
120 THE FREEMAN Februarythat the Am
- Page 122 and 123:
122 THE FREEMAN Februarytions again
- Page 124 and 125:
124 THE FREEMAN FebruaryKing's maje
- Page 126 and 127:
126 THE FREEMAN Februaryfree societ
- Page 128 and 129:
128 THE FREEMAN Februarynot had to
- Page 130 and 131:
tileFreemanAMONTHLY JOURNAL OF IDEA
- Page 132 and 133:
132 THE FREEMAN Marchmay be secular
- Page 134 and 135:
134 THE FREEMAN MarchBrotherhood of
- Page 136 and 137:
136 THE FREEMAN Marchwomen said tha
- Page 138 and 139:
138 THE FREEMAN Marchan iron grip o
- Page 140 and 141:
DIGGINGROBERT W. DEMERSI FIRST MET
- Page 142 and 143:
ONAPPEASINGHENRY HAZLITTANY ATTEMPT
- Page 144 and 145:
144 THE FREEMAN Marchafter World Wa
- Page 146 and 147:
146 THE FREEMAN MarchAggravated by
- Page 148 and 149:
148 THE FREEMAN Marchstraints upon
- Page 150 and 151:
150 THE FREEMAN MarchThe Quartering
- Page 152 and 153:
152 THE FREEMAN Marchas the Townshe
- Page 154 and 155:
154 THE FREEMAN Marchlay much of wh
- Page 156 and 157:
156 THE FREEMAN Marcha change in Br
- Page 158 and 159:
158 THE FREEMAN Marchever, was the
- Page 160 and 161:
Who is theMARC!LR ODUCER?w. A. PATO
- Page 162 and 163:
162 THE FREEMAN Marchwas of course
- Page 164 and 165:
RON HEINERFROM TIME IMMEMORIAL, thi
- Page 166 and 167:
166 THE FREEMAN Marchgardless of th
- Page 168 and 169:
GARY NORTHntity ofato . An unSta~
- Page 170 and 171:
170 THE FREEMAN Marchfiscal policY,
- Page 172 and 173:
172 THE FREEMAN MarchLenin said, tr
- Page 174 and 175:
174 THE FREEMAN MarchProfessor Mise
- Page 176 and 177:
176 THE FREEMAN Marchupon its magis
- Page 178 and 179:
178 THE FREEMAN Marchthat at a part
- Page 180 and 181:
180 THE FREEMAN Marchvocates of fix
- Page 182 and 183:
182 THE FREEMAN MarchThen foreign g
- Page 184 and 185:
184 THE FREEMAN Marchders of those
- Page 186 and 187:
A REVIEWER'S NOTEBOOKJOHN CHAMBERLA
- Page 188 and 189:
188 THE FREEMAN MarchSwitzerland, t
- Page 190 and 191:
190 THE FREEMAN Marchtypes of State
- Page 192 and 193:
192 THE FREEMAN Marchits rhetoric c
- Page 194 and 195:
tileFreemanA MONTHLY JOURNAL OF IDE
- Page 196 and 197:
196 THE FREEMAN Aprilciety, but onl
- Page 198 and 199:
198 THE FREEMAN Aprilpoint of an un
- Page 200 and 201:
200 THE FREEMAN AprilCommission cho
- Page 202 and 203:
202 THE FREEMAN Aprilcountability i
- Page 204 and 205:
204 THE FREEMAN Aprilgroup of Ameri
- Page 206 and 207:
206 THE FREEMAN AprilAggressive Nat
- Page 208 and 209:
208 THE FREEMAN Aprileither force t
- Page 210 and 211:
210 THE FREEMAN Apriltradition was
- Page 212 and 213:
SYLVESTER PETROSYNDROMENATURE goes
- Page 214 and 215:
214 THE FREEMAN Aprilosophy underly
- Page 216 and 217: 216 THE FREEMAN Aprillitical power
- Page 218 and 219: 218 THE FREEMAN Aprilin reality _as
- Page 220 and 221: 220 THE FREEMAN Aprilfirms which en
- Page 222 and 223: 222 THE FREEMAN Aprilnamely, money,
- Page 224 and 225: 224 THE FREEMAN Aprilof political i
- Page 226 and 227: The~allooningWelfare StateHENRY HAZ
- Page 228 and 229: 228 THE FREEMAN AprilThe Social Sec
- Page 230 and 231: 230 THE FREEMAN Apriltionwide avera
- Page 232 and 233: CLARENCE B. CARSONTHEFOUNDINGOFTHEA
- Page 234 and 235: 234 THE FREEMAN Aprilfrom succeedin
- Page 236 and 237: 236 THE FREEMAN Aprilhave allegianc
- Page 238 and 239: 238 THE FREEMAN AprilHouse for its
- Page 240 and 241: 240 THE FREEMAN Aprilagainst a colo
- Page 242 and 243: 242 THE FREEMAN Apriltion. George W
- Page 244 and 245: 244 THE FREEMAN Aprilscales for ind
- Page 246 and 247: 246 THE FREEMAN Apriltion to the mo
- Page 248 and 249: 248 THE FREEMAN Aprilpurpose, under
- Page 250 and 251: 250 THE FREEMAN Aprilreject the Fed
- Page 252 and 253: 252 THE FREEMAN Aprilmutual savings
- Page 254 and 255: A REVIEWER'S NOTEBOOK JOHN CHAMBERL
- Page 256 and 257: 256 THE FREEMAN Aprilabolish the fa
- Page 258 and 259: tt1eFreemanA MONTHLY JOURNAL OF IDE
- Page 260 and 261: 260 THE FREEMAN Maycurbed agricultu
- Page 262 and 263: 262 THE FREEMAN Ma,yplemen'ted and
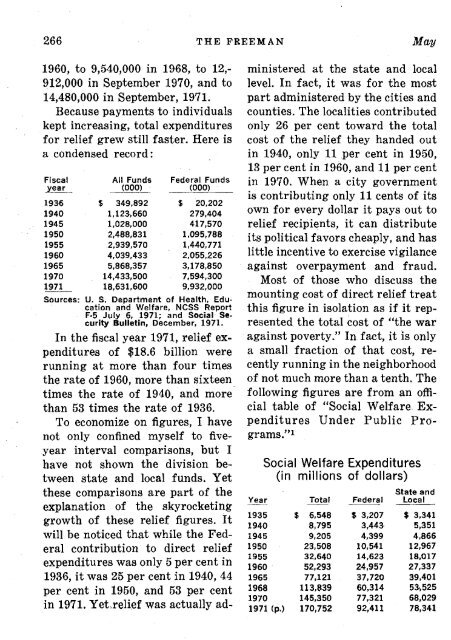
- Page 264 and 265: 264 THE FREEMAN Maythe family farm.
- Page 268 and 269: 268 THE FREEMAN Maynumber of welfar
- Page 270 and 271: 270 THE FREEMAN Maythat they had be
- Page 272 and 273: 272 THE FREEMAN Mayplicant's statem
- Page 274 and 275: 274 THE FREEMAN MayIt is somewhat s
- Page 276 and 277: 276 THE FREEMAN MayA Dangerous Acti
- Page 278 and 279: 278 THE FREEMAN Maywho have not a m
- Page 280 and 281: 28Q THE FREEMAN Maymost entirely fr
- Page 282 and 283: 282 THE FREEMAN Mayand destroyed th
- Page 284 and 285: The Causes ofHANS F. SENNHOLZIT IS
- Page 286 and 287: 286 THE FREEMAN Maylistie monetary
- Page 288 and 289: 288 THE FREEMAN MayJished when mone
- Page 290 and 291: 290 THE FREEMAN Mayas social securi
- Page 292 and 293: 292 THE FREEMAN Maythat support the
- Page 294 and 295: 294 THE FREEMAN MayEach man's right
- Page 296 and 297: 296 THE FREEMAN Maytional concept "
- Page 298 and 299: 298 THE FREEMAN Mayestate in turn s
- Page 300 and 301: 300 THE FREEMAN Mayfor so long had
- Page 302 and 303: 302 THE FREEMAN Mayonly with situat
- Page 304 and 305: 304 THE FREEMAN Maythis rule to sup
- Page 306 and 307: 306 THE FREEMAN Mayparities" - regi
- Page 308 and 309: 308 THE FREEMAN Mayhave traditional
- Page 310 and 311: 310 THE FREEMAN Maycient reserves i
- Page 312 and 313: 312 THE FREEMAN Maycontrol and rest
- Page 314 and 315: 314 THE FREEMAN Mayindependence in
- Page 316 and 317:
A REVIEWER'S NOTEBOOK JOHN CHAMBERL
- Page 318 and 319:
318 THE FREEMAN Maymade no pretense
- Page 320 and 321:
320 THE FREEMAN MayThe author empha
- Page 322 and 323:
tileFreemanA MONTHLY JOURNAL OF IDE
- Page 324 and 325:
324 THE FREEMAN Junelust for power
- Page 326 and 327:
326 THE FREEMAN Junemost High rulet
- Page 328 and 329:
328 THE FREEMAN Junepaign against s
- Page 330 and 331:
330 THE FREEMAN Juneeconomists and
- Page 332 and 333:
332 THE FREEMAN Junelittle· Meetin
- Page 334 and 335:
334 THE FREEMAN Juneal Law) ; he wa
- Page 336 and 337:
ndPropertyOSCAR W. COOLEYIN ALL THE
- Page 338 and 339:
338 THE FREEMAN Junea tract of owne
- Page 340 and 341:
340 THE FREEMAN Junelife did not pa
- Page 342 and 343:
342 THE FREEMAN Junecommonly called
- Page 344 and 345:
344 THE FREEMAN June. formula easil
- Page 346 and 347:
346 THE FREEMAN Juneain, for Britai
- Page 348 and 349:
348 THE FREEMAN Juneof coast line o
- Page 350 and 351:
350 THE FREEMAN Junewere also sent
- Page 352 and 353:
352 THE FREEMAN Juneaugment the Con
- Page 354 and 355:
354 THE FREEMAN JuneIndeed, the arm
- Page 356 and 357:
356 THE FREEMAN Junecommunity, the
- Page 358 and 359:
358 THE FREEMAN Junepoverty in more
- Page 360 and 361:
360 THE FREEMAN Juneadministration
- Page 362 and 363:
362 THE FREEMAN Junefine the nature
- Page 364 and 365:
364 THE FREEMAN Juneto provide that
- Page 366 and 367:
366 THE FREEMAN JuneThe building ne
- Page 368 and 369:
368 THE FREEMAN Junethat continuanc
- Page 370 and 371:
370 THE FREEMAN Junethe lay mind th
- Page 372 and 373:
372BLOODfromTURNIPSTERRILL 1. ELNIF
- Page 374 and 375:
374 THE FREEMAN JuneWhat John Law w
- Page 376 and 377:
376 THE FREEMAN Junefidence in the
- Page 378 and 379:
AREVIEWER'S NOTEBOOKJOHN CHAMBERLAI
- Page 380 and 381:
380 THE FREEMAN Juneline for a full
- Page 382 and 383:
382 THE FREEMAN Junethe immediate i
- Page 384 and 385:
384 THE FREEMAN Junewas at his time
- Page 386 and 387:
tileFreemanA MONTHLY JOURNAL OF IDE
- Page 388 and 389:
388 THE FREEMAN Jul·yodical called
- Page 390 and 391:
390 THE FREEMAN Julydozen or so yea
- Page 392 and 393:
392 THE FREEMAN Julyeither increase
- Page 394 and 395:
394 THE FREEMAN Julyit didn't. Perh
- Page 396 and 397:
396 THE FREEMAN Julyers, Bismarck h
- Page 398 and 399:
398 THE FREEMAN Julythe government
- Page 400 and 401:
400 THE FREEMAN Julysending their c
- Page 402 and 403:
402 THE FREEMAN Julyoutright anti-C
- Page 404 and 405:
404 THE FREEMAN Julyorders, want to
- Page 406 and 407:
406 THE FREEMAN Julydiscrete prices
- Page 408 and 409:
408 THE FREEMAN Julyhave been: the
- Page 410 and 411:
410 THE FREEMAN July"bank holidays.
- Page 412 and 413:
412 THE FREEMAN Julytles of exclusi
- Page 414 and 415:
414 THE FREEMAN Julywealth and over
- Page 416 and 417:
416 THE FREEMAN Julypresent an anti
- Page 418 and 419:
418 THE FREEMAN Julyhend the ideal,
- Page 420 and 421:
420 THE FREEMAN Julythose the Briti
- Page 422 and 423:
422 THE FREEMAN Julying, to reduce
- Page 424 and 425:
424 THE FREEMAN Julyis money, but n
- Page 426 and 427:
426 THE FREEMAN Julysecond offense.
- Page 428 and 429:
428 THE FREEMAN Julyrequisitioned.
- Page 430 and 431:
430 THE FREEMAN Julyits becoming cu
- Page 432 and 433:
432 THE FREEMAN Julybe accepted as
- Page 434 and 435:
ThePineIreeShillingKEVIN CULLINANEB
- Page 436 and 437:
436 THE FREEMAN JulyAn Honest Assay
- Page 438 and 439:
438 THE FREEMAN Julying codes set f
- Page 440 and 441:
440 THE FREEMAN Julyimage of the id
- Page 442 and 443:
442 THE FREEMAN Julyoffices and sto
- Page 444 and 445:
444A REVIEWER'S NOTEBOOK JOHN CHAMB
- Page 446 and 447:
446 THE FREEMAN Julyreport that ear
- Page 448 and 449:
448 THE FREEMAN Julyseems unquestio
- Page 450 and 451:
tileFreemanA MONTHLY JOURNAL OF IDE
- Page 452 and 453:
452 THE FREEMAN Augustin order to d
- Page 454 and 455:
454 THE FREEMAN Augustimportant soc
- Page 456 and 457:
456 THE FREEMAN Au,gustproved to be
- Page 458 and 459:
458 THE FREEMAN Augustis determined
- Page 460 and 461:
460 THE FREEMAN Augustited by inali
- Page 462 and 463:
462 THE FREEMAN Augustpeasants, the
- Page 464 and 465:
464 THE FREEMAN Augustous blacksmit
- Page 466 and 467:
466 THE FREEMAN Augustundeniable co
- Page 468 and 469:
468 THE FREEMAN Augustfreedom and i
- Page 470 and 471:
470 THE FREEMAN Au.gustdeclared tha
- Page 472 and 473:
472 THE FREEMAN AugustThe scope of
- Page 474 and 475:
474 THE FREEMAN Au.gustrouted his a
- Page 476 and 477:
476 THE FREEMAN Augusternfrontiers.
- Page 478 and 479:
478 THE FREEMAN Augustsupreme civil
- Page 480 and 481:
480 THE FREEMAN August1782 in the m
- Page 482 and 483:
482 THE FREEMAN AugustLoyalists sho
- Page 484 and 485:
484 THE FREEMAN Augustlittle uprisi
- Page 486 and 487:
ENERGY:JAMES WEIJames Wei assumed T
- Page 488 and 489:
488 THE FREEMAN Augusttransportatio
- Page 490 and 491:
490 THE FREEMAN Augustsources and u
- Page 492 and 493:
492 THE FREEMAN Augustage of tanker
- Page 494 and 495:
494 THE FREEMAN AugustFor intercity
- Page 496 and 497:
496 THE FREEMAN Augusttreatments; h
- Page 498 and 499:
ABORT~ON~a Metaphysical ApproachTHO
- Page 500 and 501:
500 THE FREEMAN Augustproduction of
- Page 502 and 503:
502 THE FREEMAN Augustthe amniotic
- Page 504 and 505:
504 THE FREEMAN Augustand independe
- Page 506 and 507:
506A REVIEWER'S NOTEBOOK JOHN CHAMB
- Page 508 and 509:
508 THE FREEMAN Auguststrong-arm me
- Page 510 and 511:
510 THE FREEMAN Augustcartoons also
- Page 512 and 513:
512 THE FREEMAN Augustvides the onl
- Page 514 and 515:
tt"1eFreemanA MONTHLY JOURNAL OF ID
- Page 516 and 517:
516 THE FREEMAN Septemberconvince c
- Page 518 and 519:
518 THE FREEMAN Septemberrium" situ
- Page 520 and 521:
520 THE FREEMAN Septemberlarized a
- Page 522 and 523:
522 THE FREEMAN Septembercan say th
- Page 524 and 525:
524 THE FREEMAN Septemberthe defens
- Page 526 and 527:
526 THE FREEMAN SeptemberI give, as
- Page 528 and 529:
528 THE FREEMAN Septemberso long as
- Page 530 and 531:
530 THE FREEMAN Septemberthis point
- Page 532 and 533:
532 THE FREEMAN SeptemberWe lie in
- Page 534 and 535:
534 THE FREEMAN Septemberan acceler
- Page 536 and 537:
536 THE FREEMAN Septemberand econom
- Page 538 and 539:
538 THE FREEMAN Septemberseldom fin
- Page 540 and 541:
540 THE FREEMAN Septembering the fi
- Page 542 and 543:
542 THE FREEMAN SeptemberGermany du
- Page 544 and 545:
544 THE FREEMAN Septembermonetary p
- Page 546 and 547:
546 THE FREEMAN Septemberdome Let m
- Page 548 and 549:
548 THE FREEMAN Septemberfare, or w
- Page 550 and 551:
CLARENCE B. CARSONTHEFOUNDINGOFTHEA
- Page 552 and 553:
552 TH.E FREEMAN Septembercans was
- Page 554 and 555:
554 THE FREEMAN Septembergoods, nor
- Page 556 and 557:
556 THE FREEMAN Septemberaccusers a
- Page 558 and 559:
558 THE FREEMAN Septemberof primoge
- Page 560 and 561:
560 THE FREEMAN Septemberthe govern
- Page 562 and 563:
The Productivity ofC. LOWELL HARRIS
- Page 564 and 565:
564 THE FREEMAN Septembereconomic c
- Page 566 and 567:
566 THE FREEMAN SeptemberHow to Pro
- Page 568 and 569:
568 THE FREEMAN Septemberute income
- Page 570 and 571:
570A REVIEWER'S NOTEBOOK JOHN CHAMB
- Page 572 and 573:
572 THE FREEMANin South Vietnam to
- Page 574 and 575:
574 THE FREEMAN Septembera health-c
- Page 576 and 577:
576 THE FREEMANwith them; we know w
- Page 578 and 579:
t11eFreemanA MONTHLY JOURNAL OF IDE
- Page 580 and 581:
580 THE FREEMAN Octobera U.S. popul
- Page 582 and 583:
582 THE FREEMAN Octobersources in t
- Page 584 and 585:
584FOR MYSELFEnwARD Y. BREESETHERE'
- Page 586 and 587:
Ageless FaithforaVacillating Amgirc
- Page 588 and 589:
588 THE FREEMAN Octobervoluntarily
- Page 590 and 591:
590 THE FREEMAN Octobertrusted thei
- Page 592 and 593:
592 THE FREEMAN Octoberthrough the
- Page 594 and 595:
594 THE FREEMAN Octoberjobs and goo
- Page 596 and 597:
596 THE FREEMAN OctoberNo Instant A
- Page 598 and 599:
598 THE FREEMAN OctoberThe Complex
- Page 600 and 601:
600 THE FREEMAN Octoberwhile the wa
- Page 602 and 603:
602 THE FREEMAN Octobersizes the ad
- Page 604 and 605:
604 THE FREEMAN Octoberearly capita
- Page 606 and 607:
606 THE .FREEMAN Octoberbade the ac
- Page 608 and 609:
608 THE FREEMAN Octobernation share
- Page 610 and 611:
610 THE FREEMAN Octoberinto the nin
- Page 612 and 613:
5°AboveZeroW. A. PATONTHE CITY GOV
- Page 614 and 615:
614 THE FREEMAN Octoberand weigh al
- Page 616 and 617:
616CLARENCE B. CARSONTHEFOUNDINGOFT
- Page 618 and 619:
618 THE FREEMAN Octobercalled durin
- Page 620 and 621:
620 THE FREEMAN OctoberUnited State
- Page 622 and 623:
622 THE FREEMAN Octoberthe two, but
- Page 624 and 625:
624 THE FREEMAN Octoberwhose sovere
- Page 626 and 627:
626 THE FREEMAN Octobertake the mon
- Page 628 and 629:
oturoightf RONALDCOONEYTHE CONCEPT
- Page 630 and 631:
630 THE FREEMAN Octobervvhether the
- Page 632 and 633:
632LEONARDFRANCKOWIAKIN THE SOCIETI
- Page 634 and 635:
634 THE FREEMAN Octoberthe top and
- Page 636 and 637:
636 THE FREEMAN Octobererators woul
- Page 638 and 639:
638 THE FREEMAN Octoberbig. Western
- Page 640 and 641:
640 THE FREEMAN Octoberrapidly. Dus
- Page 642 and 643:
tt1eFreemanA MONTHLY JOURNAL OF IDE
- Page 644 and 645:
644 THE FREEMAN Novembercrisis, the
- Page 646 and 647:
646 THE FREEMAN NovemberArdrey writ
- Page 648 and 649:
648 THE FREEMAN Novemberbook entitl
- Page 650 and 651:
650 THE FREEMAN Novemberborn is rou
- Page 652 and 653:
.652LEONARD E. READr~~'-'~'-"-'lIll
- Page 654 and 655:
654 THE FREEMAN Novemberexample can
- Page 656 and 657:
656 THE FREEMAN Novemberas domineer
- Page 658 and 659:
658 THE FREEMAN Novemberously attac
- Page 660 and 661:
660 THE FREEMAN Novembertween costs
- Page 662 and 663:
662 THE FREEMAN Novemberstandard -
- Page 664 and 665:
664 THE FREEMAN Novemberthey tried
- Page 666 and 667:
The American EconomyIHANS F. SENNHO
- Page 668 and 669:
668 THE FREEMAN Novemberof the spen
- Page 670 and 671:
670 THE FREEMAN Novemberhappen agai
- Page 672 and 673:
672 THE FREEMAN Novemberwhich affor
- Page 674 and 675:
PAUL L. POIROTA PECULIAR tendency o
- Page 676 and 677:
I Visit aManagedSocietyORIEN JOHNSO
- Page 678 and 679:
678 THE FREEMAN Novemberwater. The
- Page 680 and 681:
680 THE FREEMAN November"Some paper
- Page 682 and 683:
682 THE FREEMAN Novemberdays. They
- Page 684 and 685:
CLARENCE B. CARSONTHEFOUNDINGOFTHEA
- Page 686 and 687:
686 THE FREEMAN Novemberable from t
- Page 688 and 689:
688 THE FREEMAN Novemberno doubt wh
- Page 690 and 691:
690 THE FREEMAN Novembertering, the
- Page 692 and 693:
692 THE FREEMAN Novemberolder decla
- Page 694 and 695:
694 THE FREEMAN Novembertion was ti
- Page 696 and 697:
696 THE FREEMAN NovemberThe people
- Page 698 and 699:
698 THE FREEMAN Novembershould be c
- Page 700 and 701:
700A REVIEWER'S NOTEBOOKJOHN CHAMBE
- Page 702 and 703:
702 THE FREEMAN Novemberthe march o
- Page 704 and 705:
704 THE FREEMAN Novemberlaunched wh
- Page 706 and 707:
tt1eFreemanA MONTHLY JOURNAL OF IDE
- Page 708 and 709:
708 THE FREEMAN Decemberon a sandy
- Page 710 and 711:
710 THE FREEMAN DecemberFor example
- Page 712 and 713:
712 THE FREEMAN DecemberTom and Dic
- Page 714 and 715:
714 THE FREEMAN Decemberthe process
- Page 716 and 717:
716 THE FREEMAN Decemberwhich broug
- Page 718 and 719:
718EDMUND A. OPITZas to make us Ilu
- Page 720 and 721:
720 THE FREEMAN Decemberjust as eve
- Page 722 and 723:
722 THE FREEMAN Decembergropes in d
- Page 724 and 725:
724 THE FREEMAN Decemberhas taught
- Page 726 and 727:
726 THE FREEMAN Decemberto improve
- Page 728 and 729:
728 THE FREEMAN Decemberchoose amon
- Page 730 and 731:
730 THE FREEMAN DecemberWelfare Cos
- Page 732 and 733:
732 THE FREEMAN Decemberand more st
- Page 734 and 735:
CLARENCE B. CARSONTHEFOUNDINGOFTHEA
- Page 736 and 737:
736 THE FREEMAN Decemberreason. He
- Page 738 and 739:
738 THE FREEMAN Decemberbe done. Th
- Page 740 and 741:
740 THE FREEMAN Decembering to the
- Page 742 and 743:
742 THE FREEMAN Decemberact can onl
- Page 744 and 745:
744 THE FREEMAN DecemberCurbing the
- Page 746 and 747:
746 THE FREEMAN DecemberThe Constit
- Page 748 and 749:
748 THE FREEMAN Decemberperfectly s
- Page 750 and 751:
750 THE FREEMAN Decembernot an evil
- Page 752 and 753:
752 THE FREEMAN Decembeorand ineffi
- Page 754 and 755:
754 THE FREEMAN DecemberRockefeller
- Page 756 and 757:
756 THE FREEMAN Decembertion on cur
- Page 758 and 759:
758 THE FREEMAN Decemberedies based
- Page 760 and 761:
760 THE FREEMAN DecemberMarshall to
- Page 762 and 763:
762 THE FREEMAN DecemberCAPITAL, ca
- Page 764 and 765:
764 THE FREEMAN DecemberNature of m
- Page 766 and 767:
766 THE FREEMAN DecemberOSTERFELD,
- Page 768:
768 THE FREEMAN DecemberWEI, JamesE