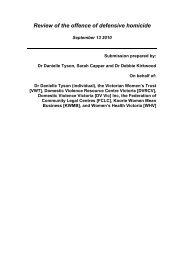
<strong>The</strong> Big PicturevariabilityANNUAL RAINFALL IN mm3000250020001500100026 inches5000Melbourne88 inches95 inches67 inches48 inches31 inches22 inchesCairns Perth Sydney Darwin Adelaide Queenstown(TAS)SELECTED LOCATIONSCOEFFICIENT (%)20181614121086420Australia S.Africa Germany France NZ India UK Canada China USA RussiaCOUNTRYFigure 2. Rainfall variability in several countries including Australia<strong>The</strong> height of each bar is a measure of variability. Australia’s variability is twice thatof the UK’s and nearly four times that of Russia.Source: G Love, Impacts of climate variability on regional Australia, paper presented at ABAREOutlook 2005 Conference, Canberra, 2005, Figure 1. Rainfall variation around Australia<strong>The</strong> extreme nature of this rainfall variability becomes apparent if we compare long-term(80- to 100-year) rainfall records from various places around Australia. A consequenceof this variability is that our streams and rivers display huge variations in their naturalflow rates due to varying amounts of runoff – between winter and summer and alsofrom year to year.Source: Watermark Australia, session notes no. 2, Melbourne, 2005, .REFERENCEs1. W Craik, <strong>The</strong> drought along the Murray, ABC News Online, 18 December 2006,.2. Water and Rivers Commission Report to Environment Australia, Productivityand water flow regulation in the Ord River of north Western Australia, Department of theEnvironment and Water Resources, 2003, pp. xii–xiv, .3. C Miller, <strong>The</strong> Snowy River story, ABC Books & Audio, Sydney, 2005, p. 240.Some other useful sources• D Smith, Water in Australia, Oxford University Press, Australia, 1998, ch. 1.• M White, After the greening – the browning of Australia, Kangaroo Press, Sydney, 1994.20 <strong>Victorian</strong> Women’s <strong>Trust</strong> - Our Water Mark
<strong>The</strong> Big PicturerainfallMost of Australia’s rainfall occurs in the north.However, most of our stored surface water is found on the easternside of the continent – on the same side that is currently experiencingsignificant rainfall reduction …But slowly they are routed out, toseek a diminishing water spoutAnd men will die of thirst before,the oceans rise to mount the shore.<strong>The</strong>n lands will crack and rendanewYou think it strange …it will come true.Mother Shipton,Elder of the Anasazi Indian NationRainfall is a key component in any weathersystem. Australia is a very dry land and rainfallis highly variable between years and acrosslocations. Only now and again do we witnessmajor floods with large areas inundated forweeks and sometimes months.Official rainfall records from weather stationsgo back as far as 1885. When these are sorted,so as to include only those stations with acontinuous data set covering at least 60 years,the analysis shows that, up to 1980, we haveexperienced three pronounced rainfall shifts. 1How much these shifts are due to naturalclimatic variation and how much they reflectthe influence of greenhouse-induced globalwarming is debatable.Whatever the case, these rainfall records revealthat, while the extent of year-to-year variationhas not changed much, the volume of rainwaterfalling in various regions has been decliningsteadily, particularly during the last 40 to 50 years.<strong>The</strong> 20-year rainfall trend shown forRockhampton in Figure 5, is now evidentin many locations along the eastern seaboardof Australia. 2Analysis of rainfall records since 1900for the whole country puts all of thisinto perspective. It’s clear that large partsof the continent are drying out.In some places the change in rainfall hasbeen very sudden. For example, during thepast 30 years Perth has experienced a declinein average annual rainfall, resulting in anaverage that is 15% lower than that recordedfor the preceding 100 years. This decrease maynot seem all that significant. However, becausevegetation and soil take up the falling rain first,and what remains flows into rivers and streams,the 15% rainfall decrease resulted in a 50% fallin average flows into the city’s water storages. 3As shown in Figure 4, when the same sort ofanalysis is carried out for a number of locationsin Victoria, a similar pattern emerges.Lucid and compelling,70 years ago …With what adoration shouldwe contemplate rain and ourcities’ watersheds. <strong>The</strong>y giveus our life. We should takeoff our shoes as we pass bythem, for the place w<strong>here</strong>onwe tread is holy ground.AO Barrett, Australia’s entail, reviewed inthe Teachers’ Journal, 20 September 1937,p. 393.<strong>Victorian</strong> Women’s <strong>Trust</strong> - Our Water Mark 21