Pyrolysis of palm oil wastes for biofuel production - Asian Journal on ...
Pyrolysis of palm oil wastes for biofuel production - Asian Journal on ...
Pyrolysis of palm oil wastes for biofuel production - Asian Journal on ...

Create successful ePaper yourself
Turn your PDF publications into a flip-book with our unique Google optimized e-Paper software.
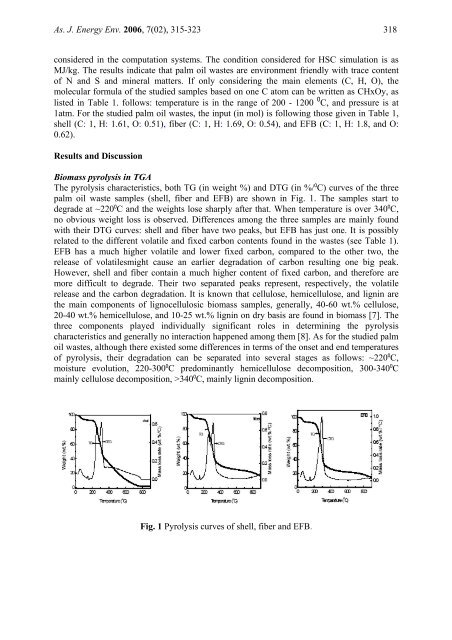
As. J. Energy Env. 2006, 7(02), 315-323 318c<strong>on</strong>sidered in the computati<strong>on</strong> systems. The c<strong>on</strong>diti<strong>on</strong> c<strong>on</strong>sidered <str<strong>on</strong>g>for</str<strong>on</strong>g> HSC simulati<strong>on</strong> is asMJ/kg. The results indicate that <str<strong>on</strong>g>palm</str<strong>on</strong>g> <str<strong>on</strong>g>oil</str<strong>on</strong>g> <str<strong>on</strong>g>wastes</str<strong>on</strong>g> are envir<strong>on</strong>ment friendly with trace c<strong>on</strong>tent<str<strong>on</strong>g>of</str<strong>on</strong>g> N and S and mineral matters. If <strong>on</strong>ly c<strong>on</strong>sidering the main elements (C, H, O), themolecular <str<strong>on</strong>g>for</str<strong>on</strong>g>mula <str<strong>on</strong>g>of</str<strong>on</strong>g> the studied samples based <strong>on</strong> <strong>on</strong>e C atom can be written as CHxOy, aslisted in Table 1. follows: temperature is in the range <str<strong>on</strong>g>of</str<strong>on</strong>g> 200 - 1200 0 C, and pressure is at1atm. For the studied <str<strong>on</strong>g>palm</str<strong>on</strong>g> <str<strong>on</strong>g>oil</str<strong>on</strong>g> <str<strong>on</strong>g>wastes</str<strong>on</strong>g>, the input (in mol) is following those given in Table 1,shell (C: 1, H: 1.61, O: 0.51), fiber (C: 1, H: 1.69, O: 0.54), and EFB (C: 1, H: 1.8, and O:0.62).Results and Discussi<strong>on</strong>Biomass pyrolysis in TGAThe pyrolysis characteristics, both TG (in weight %) and DTG (in %/ 0 C) curves <str<strong>on</strong>g>of</str<strong>on</strong>g> the three<str<strong>on</strong>g>palm</str<strong>on</strong>g> <str<strong>on</strong>g>oil</str<strong>on</strong>g> waste samples (shell, fiber and EFB) are shown in Fig. 1. The samples start todegrade at ~220 0 C and the weights lose sharply after that. When temperature is over 340 0 C,no obvious weight loss is observed. Differences am<strong>on</strong>g the three samples are mainly foundwith their DTG curves: shell and fiber have two peaks, but EFB has just <strong>on</strong>e. It is possiblyrelated to the different volatile and fixed carb<strong>on</strong> c<strong>on</strong>tents found in the <str<strong>on</strong>g>wastes</str<strong>on</strong>g> (see Table 1).EFB has a much higher volatile and lower fixed carb<strong>on</strong>, compared to the other two, therelease <str<strong>on</strong>g>of</str<strong>on</strong>g> volatilesmight cause an earlier degradati<strong>on</strong> <str<strong>on</strong>g>of</str<strong>on</strong>g> carb<strong>on</strong> resulting <strong>on</strong>e big peak.However, shell and fiber c<strong>on</strong>tain a much higher c<strong>on</strong>tent <str<strong>on</strong>g>of</str<strong>on</strong>g> fixed carb<strong>on</strong>, and there<str<strong>on</strong>g>for</str<strong>on</strong>g>e aremore difficult to degrade. Their two separated peaks represent, respectively, the volatilerelease and the carb<strong>on</strong> degradati<strong>on</strong>. It is known that cellulose, hemicellulose, and lignin arethe main comp<strong>on</strong>ents <str<strong>on</strong>g>of</str<strong>on</strong>g> lignocellulosic biomass samples, generally, 40-60 wt.% cellulose,20-40 wt.% hemicellulose, and 10-25 wt.% lignin <strong>on</strong> dry basis are found in biomass [7]. Thethree comp<strong>on</strong>ents played individually significant roles in determining the pyrolysischaracteristics and generally no interacti<strong>on</strong> happened am<strong>on</strong>g them [8]. As <str<strong>on</strong>g>for</str<strong>on</strong>g> the studied <str<strong>on</strong>g>palm</str<strong>on</strong>g><str<strong>on</strong>g>oil</str<strong>on</strong>g> <str<strong>on</strong>g>wastes</str<strong>on</strong>g>, although there existed some differences in terms <str<strong>on</strong>g>of</str<strong>on</strong>g> the <strong>on</strong>set and end temperatures<str<strong>on</strong>g>of</str<strong>on</strong>g> pyrolysis, their degradati<strong>on</strong> can be separated into several stages as follows: ~220 0 C,moisture evoluti<strong>on</strong>, 220-300 0 C predominantly hemicellulose decompositi<strong>on</strong>, 300-340 0 Cmainly cellulose decompositi<strong>on</strong>, >340 0 C, mainly lignin decompositi<strong>on</strong>.Fig. 1 <str<strong>on</strong>g>Pyrolysis</str<strong>on</strong>g> curves <str<strong>on</strong>g>of</str<strong>on</strong>g> shell, fiber and EFB.