Preqin Special Report: Cleantech
Preqin Special Report: Cleantech
Preqin Special Report: Cleantech

Create successful ePaper yourself
Turn your PDF publications into a flip-book with our unique Google optimized e-Paper software.
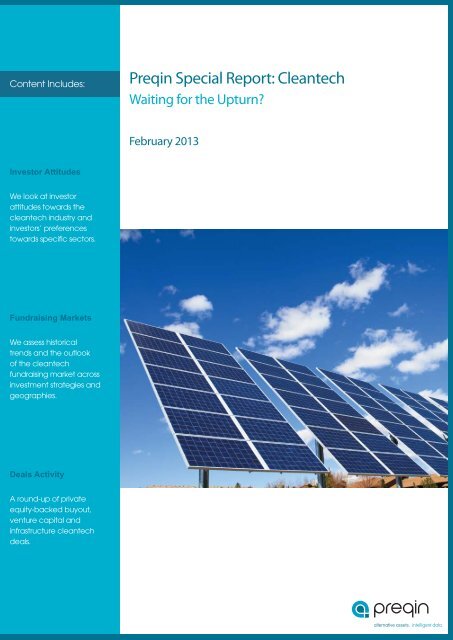
Content Includes:<strong>Preqin</strong> <strong>Special</strong> <strong>Report</strong>: <strong>Cleantech</strong>Waiting for the Upturn?February 2013Investor AttitudesWe look at investorattitudes towards thecleantech industry andinvestors’ preferencestowards specific sectors.Fundraising MarketsWe assess historicaltrends and the outlookof the cleantechfundraising market acrossinvestment strategies andgeographies.Deals ActivityA round-up of privateequity-backed buyout,venture capital andinfrastructure cleantechdeals.alternative assets. intelligent data.
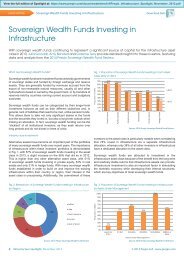
<strong>Preqin</strong> <strong>Special</strong> <strong>Report</strong>: <strong>Cleantech</strong>, February 2013ForewordThe past year has been tough for the cleantech market, with fundraising levels and deal activity notably lowerin 2012 compared to 2011. This could be down to a number of reasons, including a fall in natural gas prices,policy uncertainty and a decrease in feed-in tariffs for renewable energy. Furthermore, many investors remainopportunistic towards the industry, or commit to funds that feature cleantech as part of a much wider sector focus.Positive signs have emerged, however; many investors remain committed to the industry, with a number of fundof funds managers raising dedicated cleantech-focused vehicles. Almost half of cleantech private equity fundsin market have held interim closes, opening up large sums of capital that can be invested. Furthermore, maturityamong cleantech firms has encouraged larger fund managers to invest in cleantech companies across manyinvestment stages, from venture capital and growth, through to buyout and infrastructure.Despite this, 2013 looks set to remain challenging for cleantech fund managers seeking to raise new funds, with alarge number of dedicated cleantech vehicles on the road competing for LP capital, not only with each other, butwith more diversified vehicles that set aside smaller allocations to cleantech.<strong>Preqin</strong> <strong>Special</strong> <strong>Report</strong>: <strong>Cleantech</strong>, February 2013 provides an overview of the private equity cleantech market,looking at trends and developments in fundraising, deal activity and investor attitudes towards the sector. Thereport draws exclusively from many of <strong>Preqin</strong>’s online products and services, which provide over 10,000 industryprofessionals with data on all aspects of alternative assets, including fund managers, fundraising, investors, deals,performance, service providers and much more.We hope you find this report useful, and welcome any feedback you may have. For more information, please visitwww.preqin.com or contact info@preqin.comKey Findings●●22% of cleantech investors are set commit to funds in 2013, with a further 61% remaining opportunistic.Hydro and solar power are both sector preferences for three-quarters of LPs investing in cleantech funds.More investor information can be found on page 3● $2.8bn was raised by cleantech funds that closed in 2012, compared to $6.1bn in 2011 and $4.9bn in 2010.●51 of the 103 private equity cleantech funds in market have held interim closes, raising over $4bn in capital.More fundraising data can be found on pages 4-5● Solar power investments account for 24% of buyout and venture capital cleantech deals since 2008.● Buyout deals account for 17% of cleantech investments in 2012, compared to 9% in 2009.More deal activity information can be found on pages 6-7All rights reserved. The entire contents of <strong>Preqin</strong> <strong>Special</strong> <strong>Report</strong>: <strong>Cleantech</strong>, February 2013 are the Copyright of <strong>Preqin</strong> Ltd. No part of this publication or any information contained in it may be copied, transmitted by any electronic means, orstored in any electronic or other data storage medium, or printed or published in any document, report or publication, without the express prior written approval of <strong>Preqin</strong> Ltd. The information presented in <strong>Preqin</strong> <strong>Special</strong> <strong>Report</strong>: <strong>Cleantech</strong>,February 2013 is for information purposes only and does not constitute and should not be construed as a solicitation or other offer, or recommendation to acquire or dispose of any investment or to engage in any other transaction, or asadvice of any nature whatsoever. If the reader seeks advice rather than information then he should seek an independent fi nancial advisor and hereby agrees that he will not hold <strong>Preqin</strong> Ltd. responsible in law or equity for any decisions ofwhatever nature the reader makes or refrains from making following its use of <strong>Preqin</strong> <strong>Special</strong> <strong>Report</strong>: <strong>Cleantech</strong>, February 2013.While reasonable efforts have been made to obtain information from sources that are believed to be accurate, and to confi rm the accuracy of such information wherever possible, <strong>Preqin</strong> Ltd. does not make any representation or warrantythat the information or opinions contained in <strong>Preqin</strong> <strong>Special</strong> <strong>Report</strong>: <strong>Cleantech</strong>, February 2013 are accurate, reliable, up-to-date or complete.Although every reasonable effort has been made to ensure the accuracy of this publication <strong>Preqin</strong> Ltd. does not accept any responsibility for any errors or omissions within <strong>Preqin</strong> <strong>Special</strong> <strong>Report</strong>: <strong>Cleantech</strong>, February 2013 or for any expenseor other loss alleged to have arisen in any way with a reader’s use of this publication.2© 2013 <strong>Preqin</strong> Ltd. / www.preqin.com
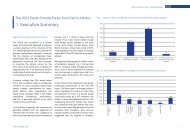
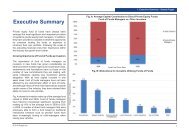
<strong>Preqin</strong> <strong>Special</strong> <strong>Report</strong>: <strong>Cleantech</strong>, February 2013Investor Attitudes Towards <strong>Cleantech</strong>An increase in global awareness of our environment, the needto cut pollution, and the need to preserve and fi nd alternativeenergy sources, led to the growth of the private equity cleantechindustry over the past 10 years. However, the past four yearshave seen challenging times in the sector, driven partly bythe global fi nancial situation, and partly by issues specifi c tocleantech. As the industry has developed, <strong>Preqin</strong> has trackedboth trends and specifi c information on important aspects of theindustry, from fund managers and investors, to funds and deals.<strong>Preqin</strong> currently profi les over 1,200 private equity investors andover 890 infrastructure investors with an interest in investing incleantech or current exposure to the sector. Investor profi lesinclude detailed and up-to-date information on current fundsearches and open mandates, areas of interest by location andfund type, current and target allocations, and more, allowingGPs, placement agents and other marketing professionals toprofi le and identify potential investors for their new funds.<strong>Preqin</strong> also tracks trends in cleantech investor sentiment throughsurveys of key institutional investors. In December 2012 <strong>Preqin</strong>’sanalysts interviewed 31 institutional investors in cleantech fundsto analyze their attitudes towards cleantech, and their plans forthe industry going forward.Appetite for <strong>Cleantech</strong>Just over one-third (36%) of respondents said they committed toa fund investing in cleantech over the course of 2012, and 22%of respondents said they intend to commit capital to a fund witha cleantech focus in 2013 (Fig. 1). This is a decrease comparedto a similar survey conducted at the beginning of 2011, when alarger 31% of investors interviewed planned to make investmentsin the 12 months following the start of 2011.However, institutional investors typically take an opportunisticapproach to investing in cleantech, with just 20% stating thatthey have a set allocation; this may explain why the majorityof investors in the sector (61%) are uncertain about theFig. 2: Investors’ Industry Preferences when Investing in <strong>Cleantech</strong>FundsSolar PowerWater & Hydro Power75%75%Fig. 1: Timeframe for Investors’ Next Intended Commitments to<strong>Cleantech</strong> Funds61%timeframe of their next commitment. Fund managers able topresent a compelling fund offering and display a strong trackrecord have the potential to raise capital from these investors.Investor Preferences<strong>Preqin</strong> asked investors whether there are any particular sectorsthey look to gain exposure to when investing in the cleantechspace. Fig. 2 shows that solar power, and water and hydro powerinvestments are each being targeted by 75% of respondents. Asignifi cant 67% of respondents are seeking to invest in fundsfocusing on the wind power industry. Sixty-seven percent ofinvestors interviewed focus on other cleantech sectors, includinggeothermal, fuel cells, nuclear and carbon credit.Types of <strong>Cleantech</strong> Investor11%Source: <strong>Preqin</strong> <strong>Cleantech</strong> Investor Survey - December 2012After public pension funds, which account for 33% of cleantechinvestors in funds closed in 2011-2012, fund of funds managersaccount for a signifi cant 16% of known investors in fundsclosed in the last two years. A number of these managers havevehicles focused on clean technology, environmental servicesand renewable energy, including HarbourVest Partners, whichis currently raising capital for its second cleantech-focused fundof funds vehicle. Other prominent investors in cleantech fundsinclude government agencies (10%), insurance companies (8%)and banks (7%).11%7%11%H1 2013H2 20132014Do Not AnticipateInvesting Before 2015OpportunisticWind Power67%Biomass42%Source New Investors for Funds and Co-investmentsRecycling & WasteEfficiency Infrastructure33%33%Seek out the most relevant active investors with a stated interestin cleantech using <strong>Preqin</strong>’s online products.Energy StorageTransport25%25%Investor profiles include current fund searches and openmandates, direct contact information and sample investments.Other67%0% 10% 20% 30% 40% 50% 60% 70% 80%Proportion of RespondentsPrivate Equity: www.preqin.com/iiInfrastructure: www.preqin.com/infrastructureSource: <strong>Preqin</strong> <strong>Cleantech</strong> Investor Survey - December 2012© 2013 <strong>Preqin</strong> Ltd. / www.preqin.com3
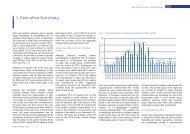
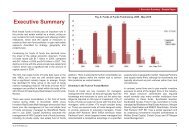
<strong>Preqin</strong> <strong>Special</strong> <strong>Report</strong>: <strong>Cleantech</strong>, February 2013<strong>Cleantech</strong> Fundraising OverviewFundraising in the clean technology arena of the private equityindustry had another very challenging year in 2012. However,increased awareness in the global community about cleantechnology, coupled with government backing for green initiativesand innovative developments in alternative fuels, continue todrive interest in the clean technology sector. One hundred andthree funds targeting the sector are in market as of January2013, and 51 of these funds have already held an interim close,showing that there is still appetite for cleantech investments.Fig. 3: Annual Private Equity <strong>Cleantech</strong> Fundraising, 2007 - 2012504540353025364339354327No. of FundsClosed<strong>Preqin</strong> currently tracks 236 fi rms with active funds that considercleantech as a primary focus; these fi rms focus solely oncleantech, environmental services and renewable energyindustries. In addition, 549 fi rms currently manage funds thatinclude cleantech as part of a diversifi ed industry focus. Theanalysis in this section relates to funds that focus solely oncleantech, and does not include funds that target the sector aspart of a wider industry focus.20159.7107.16.15.14.952.802007 2008 2009 2010 2011 2012Year of Final CloseSource: <strong>Preqin</strong> Funds in Market Online ServiceAggregateCapital Raised($bn)Historical <strong>Cleantech</strong> FundraisingThe amount of capital raised by cleantech funds annuallyreached a peak in 2009, with 39 funds securing an aggregate$9.7bn in capital commitments; this was followed by a decline in2010. Fig. 3 shows that 2011 saw a slight improvement, with 43cleantech funds raising an aggregate $6.1bn. However, this fellto 27 funds raising an aggregate $2.8bn over the course of 2012,the lowest amount to be raised over the past six years.Fund close sizes in 2012 were notably smaller than some ofthe fund closes seen in previous years. The average size ofcleantech funds that closed in 2012 was $103mn, a 27% dropcompared to the 2011 fi gure of $142mn, and a 59% drop fromthe 2009 fi gure of $249mn. The largest cleantech vehicle thatclosed in 2012 was Braemar Energy Ventures III, a $300mnventure capital fund with a focus on the renewable energy sector.Venture capital was the most prominent fund type amongcleantech funds that closed in 2012 by capital raised. Of the 27cleantech funds that closed in 2012, 11 of these were venturecapital funds, raising an aggregate $1.3bn, accounting for 46%of the total capital raised by cleantech funds throughout the year.Fig. 4: Proportion of Annual Private Equity <strong>Cleantech</strong> Capital Raisedby Primary Geographic Focus, 2007 - 2012Proportion of Capital Raised100%90%80%70%60%50%40%30%20%10%4%37%33%26%9%3%50%38%2%10%13%75%23% 13%The second most prominent fund type was infrastructure, with 11infrastructure funds raising an aggregate $1.2bn in 2012.7%35%35%11%56% 26%0%2007 2008 2009 2010 2011 2012Year of Final CloseSource: <strong>Preqin</strong> Funds in Market Online Service20%0%39%35%Rest ofWorldAsiaEuropeNorthAmericaFig. 5: Largest Private Equity <strong>Cleantech</strong> Firms by Total Capital Raised in Last 10 Years4Firm Location <strong>Cleantech</strong> Funds Raised ($mn) Vintage of Most Recent <strong>Cleantech</strong> Fund ClosedRiverstone Holdings US 4,485 2010Khosla Ventures US 2,100 2011Climate Change Capital UK 1,287 2007HgCapital UK 1,125 2010Hudson Clean Energy Partners US 1,024 2008Robeco Private Equity (SAM Private Equity) Netherlands 767 2010RockPort Capital Partners US 714 2008Global Environment Fund US 695 2010Generation Investment Management UK 683 2008Impax UK 610 2011Source: <strong>Preqin</strong> Funds in Market Online Service© 2013 <strong>Preqin</strong> Ltd. / www.preqin.com
<strong>Preqin</strong> <strong>Special</strong> <strong>Report</strong>: <strong>Cleantech</strong>, February 2013Europe-focused cleantech fundraising has fl uctuated somewhatover the past six years, as shown in Fig. 4, raising an average of$2.1bn each year from 2007 to 2012. Although Europe-focusedcleantech funds closed on an aggregate $3.4bn in 2011, or 56%of the aggregate capital raised by cleantech funds globally thatyear, this fell to just $700mn in 2012, or only 26% of aggregatecapital raised by cleantech funds globally.North America-focused cleantech fundraising reached a high in2009, raising a signifi cant 75% of total cleantech capital securedin that year, but funds focused on the region have not matchedthat level since, with the amount of capital secured falling year onyear. Asia-focused cleantech fundraising has remained relativelyconsistent since 2009, and in 2012 Asia-focused funds secureda signifi cant 39% of the aggregate capital raised, the largestproportion of any region in the year.Fig. 5 shows the 10 largest private equity fi rms by aggregatecapital raised for cleantech investing over the last 10 years. Itis worth noting that of these fi rms, only one has a fund in themarket at present. Hudson Clean Energy Partners is raisingHudson Clean Energy Partners II, a growth fund with a target of$1.5bn, which is currently the largest cleantech fund in market.<strong>Cleantech</strong> Funds in MarketChallenging fundraising conditions in 2012 led many fundmanagers to make signifi cant cuts to target fund sizes, such asSilver Lake, which lowered the target of Silver Lake KraftwerkFund from $1bn to $750mn. Nevertheless, there are still somelarge funds in market, as shown in Fig. 6, with two funds targetingover $1bn each.Despite fund managers lowering their targets, as of January 2013private equity cleantech vehicles are targeting an aggregate$23bn across 103 funds, almost the same amount of capital thatwas raised by all cleantech funds that closed over the past fouryears.Infrastructure funds are targeting the most capital and alsorepresent the largest number of cleantech funds on the road, asindicated in Fig. 7. Growth funds are targeting the second largestamount of capital, with an aggregate target of $5.9bn.By geography, North America-focused cleantech funds accountfor the greatest proportion of funds currently in market, with 34funds targeting an aggregate $9.0bn to invest in this region.Thirty-three Europe-focused cleantech funds are collectivelytargeting $7.4bn, and 23 funds in market are targeting Asiafocusedinvestment opportunities, hoping to attract a total of$3.8bn in capital.Outlook2012 witnessed a slowdown in fundraising for cleantech privateequity funds, with the amount of capital raised falling by morethan half compared to 2011. Over the course of 2013, fundraisingfor cleantech funds will remain tough, with many fund managerspotentially having to revise target sizes and fundraising© 2013 <strong>Preqin</strong> Ltd. / www.preqin.comFig. 6: Largest Private Equity <strong>Cleantech</strong> Funds in MarketFundTypeTarget Size(mn)Hudson Clean Energy Partners II Growth 1,500 USDKensington Power Income Fund Infrastructure 1,000 CADSilver Lake Kraftwerk Fund Growth 750 USDPrime Renewables Infrastructure 600 EURTPG Alternative & RenewableTechnologies PartnersGrowth 625 USDREN Solar Utility Fund Infrastructure 500 EURUSRG Power and Biofuels Fund III Infrastructure 500 USDMaybank MEACP Clean EnergyFundInfrastructure 500 USDEnergy Power Partners Fund I Infrastructure 500 USDCapital Dynamics Clean Energy &InfrastructureInfrastructure 500 USDSource: <strong>Preqin</strong> Funds in Market Online ServiceFig. 7: Breakdown of Private Equity <strong>Cleantech</strong> Funds in Market byFund Type4035302520151050379.8324.819Infrastructure Venture Capital Growth Fund of Funds OtherSource: <strong>Preqin</strong> Funds in Market Online Service5.9Fund Typeexpectations. The average size of cleantech-focused funds inmarket has fallen compared to the same time last year, from$235mn in January 2012 to $220mn in January 2013.However, the amount of capital raised so far by cleantech fundsin market is a positive indicator that there is still demand fromLPs for this sector of the market; of the 103 funds seeking capital,51 have held at least one interim close, garnering a collective$4.0bn that they can start to deploy in investments.Identify Potential Investment Opportunities81.770.5No. of FundsRaisingAggregateTargetCapital ($bn)View in-depth profiles for all cleantech funds currently inthe market, including information on investment strategy,geographic focus, target IRRs, key fundraising data, serviceproviders used and sample investors.Private Equity: www.preqin.com/fimInfrastructure: www.preqin.com/infrastructure5
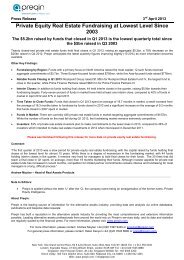
<strong>Preqin</strong> <strong>Special</strong> <strong>Report</strong>: <strong>Cleantech</strong>, February 2013<strong>Cleantech</strong> Deal Activity<strong>Preqin</strong>’s coverage of private equity cleantech deals spans allinvestment stages and sectors, from the development of earlystage green IT ideas, to growth investments in maturing solarpanel manufacturers and large scale wind farm infrastructureprojects. Below, we analyze recent trends in buyout and venturecapital cleantech deals together, and infrastructure dealsseparately, to highlight specifi c sectors and geographies that aremore prominent across different investment stages.6Buyout and Venture Capital <strong>Cleantech</strong> DealsIn 2012, there were 281 buyout- and venture capital-backedcleantech deals announced, with an aggregate value of $4.5bn.Collectively, cleantech deal activity in 2012 represented a 21%decrease in the number and a 44% decrease in aggregatevalue of cleantech deals in comparison to 2011. This signifi cantdecrease, mostly a result of low levels of deal fl ow in the secondhalf of 2012, can largely be put down to the drop in naturalgas prices, policy uncertainty within the cleantech sector, andreduced support and feed-in tariffs for renewable energy.Fig. 8 shows the number and aggregate value of buyout andventure capital deals in the cleantech sector from Q1 2008 to Q42012. Following a reasonably high sustained level of aggregatedeal fl ow through 2008, Q1 2009 witnessed a drop to 48 cleantechdeals valued at $700mn, a 29% decrease in the volume and a77% drop in the value in comparison to the previous quarter.From Q1 2009, the number and aggregate value of deals inthe cleantech sector witnessed a choppy recovery to a peakin Q4 2010, with 85 deals valued at $3.1bn. Subsequently, thecleantech sector saw the number of deals falling off by over ahalf and aggregate deal value by 90%, to 41 deals with a totaldeal value of $300mn in Q4 2012.Buyout and Venture Capital <strong>Cleantech</strong> Deals by IndustrySolar energy has been the most prominent sector from 2008 to2012, with a total of 24% of all cleantech deals taking place inthis sector across this period. Interestingly, solar energy dealsaccounted for 28% of all cleantech deals in 2008, as shown inFig. 9, but the proportion they account for has seen a year-onyeardecrease since then, to 18% in 2012.Transportation, and smart grid and energy were the second andthird most prominent industries over the same time period. Smartgrid and energy came close to overtaking solar energy as themost targeted sector in 2011, but fell back to 2008 proportionsin 2012. Waste and recycling, hydro power and environmentalservices, although commanding relatively small proportions oftotal cleantech deal numbers, have seen the most growth inproportion between 2011 and 2012, with waste and recyclinggrowing from 10% of deals in 2011 to 13% in 2012.Buyout and Venture Capital <strong>Cleantech</strong> Deals by StageThe cleantech industry over the last few years has begun tomature, leading to a notable increase in the number of buyoutbackedcleantech deals, with 17% of all cleantech dealsFig. 8: Number and Value of Buyout- and Venture Capital-Backed<strong>Cleantech</strong> Deals, Q1 2008 - Q4 2012No. of Deals120100806040200Q1 Q2 Q3 Q4 Q1 Q2 Q3 Q4 Q1 Q2 Q3 Q4 Q1 Q2 Q3 Q4 Q1 Q2 Q3 Q42008 2009 2010 2011 2012No. of DealsAggregate Deal Value ($bn)Source: <strong>Preqin</strong> Deals Analyst Online ServiceFig. 9: Proportion of Buyout- and Venture Capital-Backed <strong>Cleantech</strong>Deals by Industry, 2008 - 2012Proportion of Total No. of Deals100%90%80%70%60%50%40%30%20%10%0%11%14% 17%19%19%28% 26%8% 10% 8%7% 11% 7%7% 5% 8%4% 7% 5%10% 7% 10% 10%19% 20%23% 22%represented by buyout investments in 2012 in comparison to 9%in 2009.2011 witnessed the strongest year for venture capital cleantechinvestment since 2008, with 283 venture capital-backed dealsvalued at $4.9bn. 2012, however, recorded the lowest level ofventure capital investment since 2008, with 220 venture capitalbackeddeals valued at $3.1bn.Buyout and Venture Capital <strong>Cleantech</strong> Deals by Region18%North America was the most prominent region for cleantechinvestment in 2012, with 183 buyout- and venture capitalbackedcleantech deals, and the region accounted for 64% ofall cleantech deals in the last two years. However, the regionexperienced a sharp decrease in the value of deals taking placein 2011 and 2012, from $5.1bn to $2.9bn.6%8%8%18%13%5%9%10%13%15%17%18%2008 2009 2010 2011 2012Source: <strong>Preqin</strong> Deals Analyst Online ServiceOtherWind Power3.53.02.52.01.51.00.50.0EnvironmentalServicesWater & HydroPowerWaste & RecyclingSmart Grid& EnergyTransportationSolar Power© 2013 <strong>Preqin</strong> Ltd. / www.preqin.comAggregate Deal Value ($bn)
<strong>Preqin</strong> <strong>Special</strong> <strong>Report</strong>: <strong>Cleantech</strong>, February 20132010 saw an improvement in European cleantech deal activityas the region approached deal levels witnessed in 2008. Thisincrease was short-lived, however, as the aggregate value ofcleantech deals in the region in 2011 was lower than in 2010, andlevels dropped further in 2012. Although the greatest proportionof capital raised for funds in 2012 was focused on Asia, the regionsaw a signifi cant decline in deal value throughout the year, from$1bn in 2011 to $200mn in 2012.Infrastructure <strong>Cleantech</strong> Deal Activity<strong>Cleantech</strong> infrastructure deals have experienced relatively steadygrowth in recent years, reaching a peak with 99 transactionscompleted in 2011. Sixty-seven cleantech and renewable energyinfrastructure deals were fi nalized in 2012, representing 32% ofthe 208 infrastructure deals made during the year.Fig. 12 provides the sector breakdown of cleantech infrastructuredeals completed since 2008. It demonstrates a gradual transitionfrom wind power investments accounting for the highestproportion of deals, to solar power, with a notable growth inhydro power deals in recent years.Fig. 10: Proportion of Buyout- and Venture Capital-Backed<strong>Cleantech</strong> Deals by Stage, 2008 - 2012Proportion of Total No. of Deals100%90%80%70%70%60%81% 84%80% 78%50%40%30%20%19%5%6%6%7%10%13%9% 11% 14%17%0%2008 2009 2010 2011 2012Buyout Growth Capital Venture CapitalSource: <strong>Preqin</strong> Deals Analyst Online ServiceFig. 11: Aggregate Value of Buyout- and Venture Capital-Backed<strong>Cleantech</strong> Deals by Region, 2008 - 2012Europe is the dominant region for infrastructure cleantech deals,with 68% of transactions made by unlisted fund managers since2008 involving European assets. North American assets accountfor 17% of total deals, Asian projects for 7% and Rest of Worldcountries for the remaining 8%. A notable renewable energy dealcompleted in 2012 was the €850mn fi nancing secured for thedevelopment of Northwind, a 216MW wind farm located off thecoast of Belgium in the North Sea, by a consortium including DGInfra Yield and PMV Infrastructure Fund.OutlookAggregate Deal Value ($bn)12.010.08.06.04.02.00.00.33.65.60.10.31.33.50.81.00.11.03.2 1.85.14.30.10.21.42.9Private equity cleantech deals have dropped off considerably in2012, due to a variety of reasons including policy uncertainty,low-cost natural gas and decreases in feed-in tariffs, especially inEurope. A trend that has been observed in the cleantech industryin recent years has been the proportional decline in growthcapital and venture capital-backed deals, and an increase in thenumber of buyout-backed deals, which is likely to continue asthe sector continues to mature. Furthermore, infrastructure dealswill remain key to the cleantech industry, as indicated by thedominance these funds have in the fundraising market.Analyze the Latest <strong>Cleantech</strong> Deals ActivityView detailed information on all cleantech deals made in recentyears, filter deal flow data by region, deal type and investmentstage, and see where the most investment activity is takingplace: plants and production vs. cleantech start-ups; NorthAmerica vs. Europe; solar power vs. hydro power. See whichfirms currently own these portfolio companies and assets, andhow long they have held them.Private Equity: www.preqin.com/dealsInfrastructure: www.preqin.com/infrastructure© 2013 <strong>Preqin</strong> Ltd. / www.preqin.comSource: <strong>Preqin</strong> Deals Analyst Online ServiceFig. 12: Proportion of Infrastructure <strong>Cleantech</strong> Deals by Industry,2008 - 2012Proportion of No. of Deals0.02008 2009 2010 2011 2012North America Europe Asia Rest of World100%3% 1% 0% 1% 0%11%12%9%90%18%25%5%7%10%80%6%70%8%60%45% 36% 39%42%50%37%40%30%20%38%44% 42%33%27%10%0%2008 2009 2010 2011 2012Solar Power Wind Power Hydro Power Other Renewable Energy Clean TechnologySource: <strong>Preqin</strong> Infrastructure Online Service7
<strong>Preqin</strong> <strong>Special</strong> <strong>Report</strong>: <strong>Cleantech</strong>February 2013<strong>Preqin</strong>: Global <strong>Cleantech</strong> Data and IntelligenceSource new investors for funds and co-investmentsSeek out the most relevant active investors with a stated interest in cleantech. Details includefuture investment plans, direct contact information and sample investments.If you want any furtherinformation, or would like torequest a demo of our products,please contact us:New York:Identify potential investment opportunitiesView in-depth profi les for all cleantech funds currently in the market, including information oninvestment strategy, geographic focus, target IRRs, key fundraising data, service providersused and sample investors.Find active fund managers in the cleantech industrySearch for fi rms actively targeting cleantech investments. View information on key contacts,fi rm fundraising and performance history, and applied strategies of the fi rm when investing inportfolio companies and assets.Analyze the latest cleantech deals activityView detailed information on all cleantech deals made in recent years, and see where themost investment activity is taking place: plants and production vs. cleantech start-ups; NorthAmerica vs. Europe; solar power vs. hydro power. See which fi rms currently own these portfoliocompanies and assets, and how long they have held them.<strong>Preqin</strong>’s Private Equity and Infrastructure Online ServicesWith global coverage and detailed information on all aspects of the industry, <strong>Preqin</strong>’s PrivateEquity and Infrastructure Online Services keep you up to date on all the latest developmentsin the cleantech industry.Find out how <strong>Preqin</strong>’s range of products and services can help you:www.preqin.com/cleantechOne Grand Central Place60 E 42nd StreetSuite 2544New YorkNY 10165Tel: +1 212 350 0100Fax: +1 440 445 9595London:Equitable House47 King William StreetLondonEC4R 9AFTel: +44 (0)20 7645 8888Fax: +44 (0)87 0330 5892Singapore:One Finlayson Green#11-02Singapore 049246Tel: +65 6305 2200Fax: +65 6491 5365Silicon Valley:303 Twin Dolphin Drive Suite600Redwood CityCA 94065Tel: +1 650 632 4345Fax: +1 440 445 9595Email: info@preqin.comWeb: www.preqin.com