NOO Data Factsheet: Adult Weight - Big Birthas
NOO Data Factsheet: Adult Weight - Big Birthas
NOO Data Factsheet: Adult Weight - Big Birthas

Create successful ePaper yourself
Turn your PDF publications into a flip-book with our unique Google optimized e-Paper software.
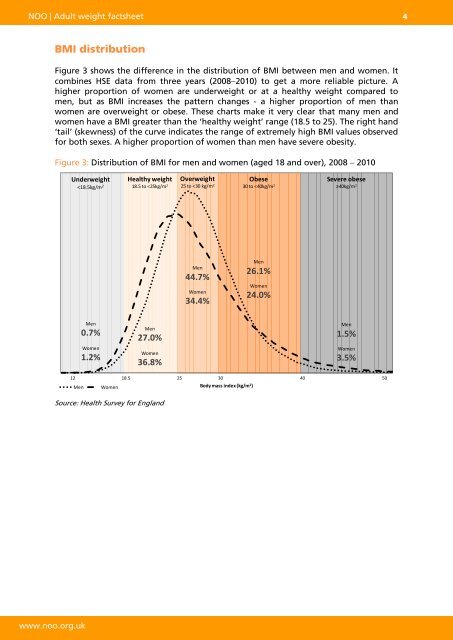
<strong>NOO</strong> | <strong>Adult</strong> weight factsheet 4BMI distributionFigure 3 shows the difference in the distribution of BMI between men and women. Itcombines HSE data from three years (20082010) to get a more reliable picture. Ahigher proportion of women are underweight or at a healthy weight compared tomen, but as BMI increases the pattern changes - a higher proportion of men thanwomen are overweight or obese. These charts make it very clear that many men andwomen have a BMI greater than the ‘healthy weight’ range (18.5 to 25). The right hand‘tail’ (skewness) of the curve indicates the range of extremely high BMI values observedfor both sexes. A higher proportion of women than men have severe obesity.Figure 3: Distribution of BMI for men and women (aged 18 and over), 2008 2010Underweight