NOO Data Factsheet: Adult Weight - Big Birthas
NOO Data Factsheet: Adult Weight - Big Birthas
NOO Data Factsheet: Adult Weight - Big Birthas

Create successful ePaper yourself
Turn your PDF publications into a flip-book with our unique Google optimized e-Paper software.
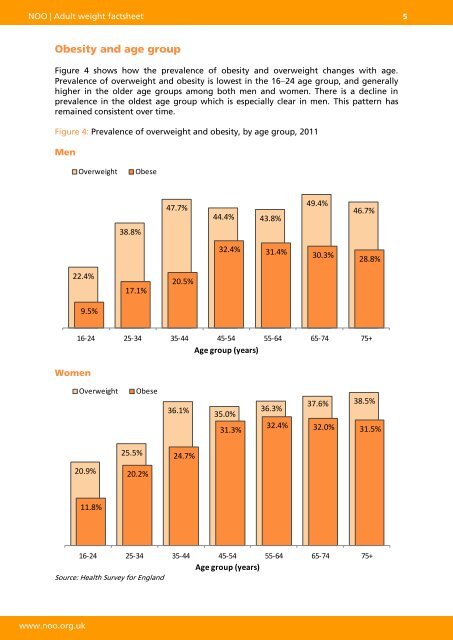
<strong>NOO</strong> | <strong>Adult</strong> weight factsheet 5Obesity and age groupFigure 4 shows how the prevalence of obesity and overweight changes with age.Prevalence of overweight and obesity is lowest in the 1624 age group, and generallyhigher in the older age groups among both men and women. There is a decline inprevalence in the oldest age group which is especially clear in men. This pattern hasremained consistent over time.Figure 4: Prevalence of overweight and obesity, by age group, 2011MenOverweightObese47.7%44.4% 43.8%49.4%46.7%38.8%32.4% 31.4% 30.3%28.8%22.4%9.5%17.1%20.5%Women16-24 25-34 35-44 45-54 55-64 65-74 75+Age group (years)OverweightObese36.1%35.0%36.3%37.6% 38.5%31.3%32.4% 32.0% 31.5%25.5%24.7%20.9%20.2%11.8%16-24 25-34 35-44 45-54 55-64 65-74 75+Age group (years)Source: Health Survey for Englandwww.noo.org.uk