A SIMPLIFIED MIXED-CULTURE BIOFILM MODEL
A SIMPLIFIED MIXED-CULTURE BIOFILM MODEL
A SIMPLIFIED MIXED-CULTURE BIOFILM MODEL

Create successful ePaper yourself
Turn your PDF publications into a flip-book with our unique Google optimized e-Paper software.
2152available. In Fig. 3 oxygen is considered to be thelimiting substrate.In this simple system the dependency of the totalreaction rate and of the limitation of bacterialgrowth on the bulk liquid substrate concentrationcan be easily derived. Indeed, the active fraction ofthe biomass f is equal to the dimensionless penetrationdepth of the limiting substrate b So (z So /L inFig. 3). The ¯uxes of the di€erent substrates i intothe bio®lm are then derived directly from:J i ˆm X i f L:…8†However, the straightforward relation f =b(S limiting ) only holds for very simple systems as inFig. 3. A problem arises when this active fractionconcept is applied to more complex problems.Indeed, in most cases there are various bacterialspecies (X j ) present in the bio®lm, which sometimescompete for the same substrate (e.g. both heterotrophicand autotrophic bacteria require oxygen aswell as ammonia for aerobic growth). On the onehand, equations for the dimensionless penetrationdepth b i can be written that relate to the exhaustionof substrates while, on the other hand, the activefraction f j for each biomass species is needed forfurther calculation. Although there exists a relationshipbetween these two variables, this relation iscase speci®c and requires a thorough analysis of thespeci®c problem at hand, as illustrated below.In the following, the basic theory is outlined fora system with substrates S i and species X j . Based onthe considerations above, the volumetric reactionrate of a species with respect to each substrate iswritten as:r ij ˆm j X j ij…9†where r ij is the zero-order reaction rate for the bacterialspecies X j with respect to the substrate S i , m jthe (max) speci®c growth rate of the species X j , n ijthe stoichiometric coecient and i,j the sucesdenoting the substrates and species respectively. Incase di€erent species use the substrate S i , the totalvolumetric reaction rate of this substrate becomes:r i ˆ Xm j X j ij :…10†jNow again, in case the bio®lm is fully penetrated,all reactions take place over the full depth of thebio®lm L with a constant maximum rate. On thecontrary, in case any substrate limitation occurs,the reaction takes place only over a fraction of thetotal depth of the bio®lm.Given that each reaction is governed by the activityof only one bacterial species, the limitatione€ect can again be expressed by assuming that onlya certain fraction of this particular species to beactive. Hence a general solution can be given forthe ¯ux of each substrate into the bio®lm:Wolfgang Rauch et al.J i ˆ Xm j X j ij f j L and f j ‰0; 1Š …11†jwhere J i is the total transport of the substrate S ithrough the surface of the bio®lm, L the bio®lmthickness and f j the active fraction of species X j .The calculation of the active fractions is outlined inthe following.STEP 1: ACTIVE FRACTIONS IN A MULTIPLESUBSTRATE/SPECIES SYSTEMThe proposed model is based on a two-step procedurefor calculating the conversions in the bio®lmreactor in each time-step. First, the di€usion depthof the substrates into the bio®lm is found analyticallyby assuming pseudo-steady-state conditions,zero-order conversion rates and a homogeneous distributionof the bacterial species within the bio®lm.The result of this ®rst step is an estimate of theamount of bacterial mass that is actually active inthe conversion processes (active fraction). Theother, inactive fraction of the bacterial mass is notexposed to the substrate necessary for performingthe conversion processes (di€usion limited). Giventhis information, the conversion of the substrates inthe reactor is then calculated in the second step.Analytical derivation of the penetration depth of substratesAs stated above, Fig. 3 shows the simplest casewith respect to di€usion limitation: From the pointof view of spatial distribution all processes arestopped when one of the limiting substrates isexhausted. The penetration depth for any substrate,given that all other substrates are in excess, can bederived from an analytical solution to equation 3:withr2 D i S i0z i ˆr iandb i ˆr i ˆ Xm j X j ijjr2 D i S i0r i :L 2…12†…13†where r i is the zero order conversion rate of thesubstrate S i (taking into account all bacterial speciesX j that use this substrate under the given environmentalcondition, i.e. aerobic±anoxic), b i is thedimensionless penetration depth of substrate S i , S i0the concentration of substrate S i in the bulk liquidand L the bio®lm thickness.However, for a multiple substrate/multiple speciessystem the aspect of di€usion limitation can easilybecome more complex. Generally, sequential di€usionlimitation occurs if a substrate S a is used intwo (or more) processes and one of these processesis limited earlier than the other by a di€erent substrateS b . As a result, the zero-order conversion rateof the substrate S a is no longer the same in thewhole bio®lm. The penetration depth z a of the sub-
A simpli®ed mixed-culture bio®lm model 2153Fig. 4. General description of sequential di€usion limitation.strate is divided in two parts where the conversionrate in the upper active part (r ua ) is di€erent(higher) from the one in the lower active part closerto the substratum (r la ). Indeed, in the upper parttwo processes consume substrate a, while in thelower only one process proceeds. This is outlinedgenerally in Fig. 4.The depth of the upper part is determined by thepenetration depth z b of the substrate S b that is limiting®rst. Consequently, the ¯ux of the substrate S adeeper into the bio®lm is linearly decreasing onlywithin each of the two parts of the bio®lm but nolonger over the whole penetration depth.Nevertheless, the penetration depths z a and z b canbe derived analytically (Rauch and Vanrolleghem,1997):s2 D b S b0z b ˆandr bsz a ˆz 2 b1 r uar la‡ 2 D a S a0r la…14†where r b is the zero-order reaction rate in the upperpart with respect to the ®rst limiting substrate S b(taking into account all species j that use this substrateunder the given environmental condition), r uathe zero-order reaction rate in the upper part withrespect to S a (taking into account all species X j thatuse this substrate under the given environmentalcondition), r la the zero-order reaction rate in thelower part with respect to S a (taking into accountall species X j that use this substrate and which arenot already limited by another substrate), S b0 thebulk liquid concentration of substrate S b that is limited®rst and S a0 the bulk liquid concentration ofsubstrate S a .The aerobic growth in a system with both heterotrophic(X H ) and autotrophic bacterial species (X A )is an example of this sequential di€usion limitation.Growth of the species requires three substrates, i.e.dissolved oxygen S O , soluble organic matter S S andammonia S NH .IfS S is limiting, then the growth ofheterotrophs stops but the growth of autotrophsproceeds until either oxygen or ammonia gets limitingfor them. Hence, this is a sequencing di€usionlimitation for oxygen or ammonia. In the outer partof the bio®lm (until S S is utilised) both heterotrophicand autotrophic growth take place simultaneouslywhereas in the next zone (until any othersubstrate gets limiting) only the autotrophic growthprocess utilises S NH and S O . Figure 4 expresses thissituation in general terms.Calculation of active fractions of bacterial species: anexampleThe example used to introduce the approach forthe calculation of the active fractions for the penetrationdepths considers the main carbon/nitrogencycles in a bio®lm, i.e. carbon removal, nitri®cationand denitri®cation (given on Peterson matrix representation(Henze et al., 1987) in Table 1).Heterotrophic bacteria are growing under twodi€erent environmental conditions in the system,i.e. under both aerobic and anoxic conditions.Other than in continuously stirred tank reactors, aspatial distribution of the oxygen concentrationexists in bio®lms. Consequently, in bio®lms simultaneousnitri®cation and denitri®cation can occur,where the top layers of the bio®lm are nitrifyingTable 1. Matrix representation of aerobic/anoxic growth of heterotrophic/autotrophic bacteriaProcess S O (ML 3 ) S S (ML 3 ) S NO (ML 3 ) S NH (ML 3 ) Process rate (ML 3 T 1 )Aerobic het. growth 1 1/Y H 1/Y H i x m H .X HAnoxic het. growth 1/Y H (1 Y H )/2.86Y H i x m H *.X HAerobic aut. growth 1 4.57/Y A 1/Y A 1/Y A i x m A .X A
2154Wolfgang Rauch et al.whereas the deeper layers denitrify. The spatial distributionis taken into account by means of theanoxic active fraction coecient f * H for heterotrophicbacteria. However, note that heterotrophicbacteria have a preference for oxygen. As a resultnitrate can never be the substrate that is limitingheterotrophic activity in the ®rst place, but onlyafter all oxygen is utilised. Furthermore, the biokineticmodel outlined in Table 1 assumes that speciesgrowth limitation by nitrogen is only due to ammoniaexhaustion. The anoxic growth rate is denotedas m * H.With respect to utilisation and production ofnitrate in the bio®lm, two aspects need to be considered.First, a problem arises when more nitrate isproduced via nitri®cation than utilised due to denitri®cation.As a consequence, a nitrate ¯ux occursin the opposite direction, i.e. from the bio®lm backinto the bulk liquid. The transport of the net producednitrate through the nitri®cation zone is subjectto di€usion. A second problem arises fornitrate utilisation which occurs usually in the deeperlayers of the bio®lm. Here also, nitrate is transportedthrough a non-reactive layer. The simpli®edmodel gives no direct opportunity to consider thesedi€usion processes and an instantaneous transportof the soluble products is assumed in both cases(assumption (5)). Hence, produced nitrate does notaccumulate in the bio®lm but is considered only bymeans of the net ¯ux transport through the bio®lmsurface.The procedure to derive limitation of active fractionsof the species in the bio®lm for each speci®csituation of substrate can be outlined as follows forthis heterotrophic/autotrophic bio®lm:1. For each of the substrates S O , S S , S NO and S NHthe dimensionless penetration depth b i (=z i /L) iscalculated from equation 12. If none of the substratesis limiting the bio®lm is fully penetratedand all active fractions f are equal to one. Ifnot, the substrate with the smallest value b i islimiting ®rst.2. The actual case of substrate limitation is derivedfrom Fig. 5 where the order of limitation is listedtogether with the active fractions of the relevantspecies. Unless S NH is limiting, another substratemight cause a sequential di€usion limitation thathas to be taken into account.3. If there is no S NH limitation then the penetrationdepths of the substrates are calculated fromequation 14 based on the possible order of limitations.4. If any of these dimensionless penetration depthsis smaller than one, the corresponding substrateFig. 5. Six possible situations for substrate limitation in the competition of heterotrophic and autotrophicgrowth in an idealised bio®lm. Left: Substrate pro®les and Right: active fraction of bacteriaspecies based on zero-order kinetics. From top to bottom: case 1, 2 and 3 = oxygen limited in the ®rstplace and then either organic matter, nitrate or ammonia limited; cases 4 and 5 = organic matter limitedin the ®rst place and then either oxygen or ammonia limited; and case 6 = ammonia limited.
A simpli®ed mixed-culture bio®lm model 2155is limiting in the second place and the activefraction is obtained from Fig. 5.General algorithm for calculating active fractionsThe following algorithm is generally applicablefor determining the active fractions in a multiplespecies/substrate systems:1. Make the process matrix, indicate all negativestoichiometric values and evaluate the sequenceof switching from one substrate to another forprocesses that are ``on'' or ``o€'' (e.g. anoxicgrowth is not operational as long as oxygen is``on'', assimilation of nitrate as nitrogen sourceis ``o€'' as long as ammonia is ``on'', etc.);2. Calculate the dimensionless penetration depth bfor each of the relevant components and for allreactions that are ``on'' assuming zero-orderreaction rates and no limitation by any othersubstrate;3. The smallest b found is retained (unless it is largerthan one) and this determines the penetrationdepth of the limiting substrate;4. Some reaction(s) may be switched ``o€'' andothers ``on'' by this absence of substrate in thedeeper layers of the bio®lm;5. Unless all reactions are ``o€'' or the smallest b islarger than one, go to 2.STEP 2: OVERALL <strong>MODEL</strong> FOR THE BULK LIQUID INCONTACT WITH A <strong>BIOFILM</strong>Concept for describing bulk liquid±bio®lm interactionThe procedure outlined above is only the ®rststep for deriving a mathematical description of thebiokinetic processes within the bio®lm and of themass exchange between bulk liquid and bio®lmcompartment. The result of the analysis withrespect to di€usion limitation is a quanti®cation ofthe active mass of each species present in the wholebio®lm with respect to the processes. Also thedynamic changes in the bulk liquid need to be consideredand the mass transfer between those twophases.The system is seen in the following as two connectedideally mixed tank reactors where one isrepresenting the bulk liquid and the other the bio-®lm (Fig. 6). The components in both tanks areexpressed di€erently, in the bulk liquid in terms ofconcentrations (ML 3 ), as usual, and in the bio®lmas mass M F (M). The reason is that the thickness ofthe bio®lm compartment is changing, which can betaken into account more easily by balancing massesthan by concentrations. Neglecting the dynamicchanges in bio®lm density, the thickness of the bio-®lm can be computed at any time instant from (2)PMFjL ˆ :…15†r m A FThe di€erent dimensions of the particulate componentsin both reactors (concentrations in the bulkliquid and mass in the bio®lm) do not allow a directinteraction of components in both compartments.Traditionally, the formulation of the mass transferbetween the phases has to account for that.Alternatively, one can express the reactions in thebio®lm as a volumetric reaction rate r Bi with respectto the substrate concentration in the bulk liquid.This volumetric reaction rate is derived fromequation 11, that is from the areal ¯ux J i of a substrateS i through the surface of the bio®lm:r Bi ˆJi ˆ AF XmV B =A F V j X j ij f j L: …16†BRewriting this equation gives:r Bi ˆ Xm j ij f j L M Fj A FA F L V Bjˆ X M Fjm j ij f jVjBˆ Xm j ij f j X Bjjj…17†where A F is the surface of the bio®lm, V B is thevolume of the bulk liquid compartment andX Bj =M Fj /V B is the concentration of particulatematter j in the bio®lm per unit of volume of thebulk liquid compartment. Hence, the problem ofthe di€erent dimensions of the particulate componentsin both phases is taken care of directly andthe explicit description of the mass transfer betweenFig. 6. Interaction processes between bio®lm and bulk liquid components due to mass ¯uxes J.
2156Wolfgang Rauch et al.bulk liquid and bio®lm must no longer be consideredin the overall model.Physical interaction between bio®lm and bulk liquidAttachment (¯ux J at ) is addressing a number ofphysical processes where suspended matter is transportedfrom the water phase to the bio®lm compartment.The most important phenomena areprocesses such as sedimentation, inclusion orattachment which are generally described as a ®rstorderprocess with respect to the concentration ofthe particulate matter in the water phase. Thereverse process of displacement is addressed asdetachment (¯ux J dt ). Detachment describes the materialloss from the bio®lm matrix and is frequentlycategorised into the phenomena erosion, sloughingand abrasion. In this paper no such distinction ismade and all three phenomena are modelled as one.Following Horn and Hempel (1997b) the rate ofbiomass detachment k d is formulated here as beingdependent on the velocity u f by which the bio®lmsurface moves relative to the substratum:if u f 0 then k d ˆ k dt u f …18†where k d is the detachment rate, u f the velocity bywhich the surface of the bio®lm moves perpendicularto the substratum and k dt the detachment coecient.Description of biokinetic processes in the bio®lmÐProcess matrix: an exampleThe biokinetic process description is straightforwardonce the fractions of the active biomass havebeen computed as previously outlined. Expressingthe components in the bio®lm as above in terms ofconcentrations with respect to the volume of thebulk liquid compartment (X Bj ) does not violatemass conservation principles. In the following illustrativeexample aerobic and anoxic growth ofheterotrophs and aerobic growth of autotrophs issimulated, as well as hydrolysis and decay. It is importantthat the process description for biomassgrowth used here (Table 2) is consistent with theone used earlier for determining the active fractions(Table 1).Here we follow as closely as possible the conceptsformulated in the activated sludge model No. 1(Henze et al., 1987) for the description of the biokineticprocesses in the bio®lm (Table 2). The maindi€erence to other bio®lm models (e.g. Wanner andGujer, 1986; Wanner and Reichert, 1996; Horn andHempel, 1997a,b) is the consistent application ofthe death±regeneration principle (Dold et al., 1980)together with the introduction of slowly biodegradableorganic matter (X S ) which is considered as aparticulate component of the bio®lm. The reasoningfor choosing this approach is to allow both a consistentprocess description and wastewater charac-Table 2. Process matrix for biokinetic processes in the bio®lm and corresponding e€ect to the concentration of soluble components in the bulk liquidBulk liquid Bio®lmProcess S O (ML 3 ) S S (ML 3 ) S NO (ML 3 ) S NH (ML 3 ) X BH (ML 3 ) X BA (ML 3 ) X BS (ML 3 ) X BI (ML 3 ) Process rate (ML 3 T 1 )Aerobic het. growth 1 1/YH -1/YH i x 1 mH.XFBH.fHAnoxic het. growth 1/YH (1 YH)/2.86YH ix 1 mH*.XFBH.fH*Aerobic aut. growth 1 4.57/Y A 1/Y A 1/Y A i x 1 m A .X FBA .f ADecay heterotroph 1 1 fp fp bH.XBHDecay autotroph 1 1 fp fp b A .X BAHydrolysis 1 ix 1 kh.XBS
A simpli®ed mixed-culture bio®lm model 2157terisation for direct linkage of models of the variouscompartments in aquatic systems (e.g. Rauch et al.,1998). However, the choice of this concept is notmandatory for using the presented simpli®ed bio-®lm model and it can be easily replaced.However, with respect to the activated sludgemodel No. 1 (ASM1) some simpli®cations had tobe implemented as a result of the active fractionconcept. First of all bacterial growth is notexpressed as a Monod-type reaction as done inASM1 but instead as a ®rst-order process withrespect to the active fraction of the bacterial massalone. This is due to the requirements for zeroorderin substrate kinetics and di€usion limitation.In ASM1 also the limitation of reactions withrespect to oxygen and ammonia is expressed byMonod-type switching functions. Convenientlythese functions can be dropped as all limitations arealready considered in the active fraction concept.In Table 2 it is postulated that hydrolysis is a®rst-order process with respect to the concentrationof slowly biodegradable organic matter. This hypothesisis supported by experimental results fromJanning et al. (1997). According to the assumptionsunderlying the model concept (assumption (5))readily biodegradable organic matter from hydrolysisis modelled as being instantaneously transferredinto the bulk liquid.APPLICATION OF THE <strong>MODEL</strong>Fig. 7. Experimental set-up.Table 3. Speci®cation of the experimental set-up. (After: Horn andHempel, 1997a,b)Parameter Experiment 1 Experiment 2Reactor length 1.63 m 1.42 mTube diameter 0.016 m 0.026 mBio®lm surface area 0.082 m 2 0.116 m 2Recirculation ¯ow 1.74 m 3 d 1 3.67 m 3 d 1Dilution water ¯ow 0.0035 m 3 d 1 0.0035 m 3 d 1Substrate solution ¯ow 0.0003 m 3 d 1 0.0003 m 3 d 1Two examples will serve as illustration of the applicabilityof the simpli®ed mixed-culture model.Both are long-term experiments in which growthand decay of microbial species in the bio®lm havebeen investigated under di€erent, well-de®ned environmentalconditions. The ®rst experiment (Hornand Hempel, 1997a) is concerned with the populationdynamics in an autotrophic bio®lm systemover a period of 10 months. The experimentalresults have been used to calibrate the model withrespect to the parameters of the autotrophic bacteria.The predictive power of the model is seen bythe fact that no change of those calibrated parametervalues was necessary to describe the secondexperiment, which is a 7-month investigation ongrowth and decay in an auto-/heterotrophic bio®lm(Horn and Hempel, 1997b). Obviously, the lack ofdata in the ®rst experiment caused that the parametersdescribing heterotrophic bacteria conversionwere calibrated for the second experimentonly. For the sake of illustration both experimentsare described brie¯y in the following. For a moredetailed description the reader is referred to theoriginal literature.Experimental set-upBoth investigations used a nearly identical set-up whichis characterised in Fig. 7 and Table 3. The very high recirculationrate makes it possible to model the bio®lm tubereactor as a quasi completely mixed reactor. After inoculationwith sludge from a wastewater treatment plant thebio®lm was grown inside the darkened glass tube under aconstant temperature of 208C. The measurements included(among others) bio®lm thickness, mean bio®lm density,¯ux of substrates and oxygen pro®les. For determiningdetachment rates the suspended solids in the e‚uent havealso been measured. Note the di€erence in measuring thesubstrate ¯uxes from the bulk liquid into the bio®lm: theturnover rate of ammonia (S NH ) is determined in both experimentsby measuring in¯uent and e‚uent concentrations.For the evaluation of the maximum ¯ux ofglucose S S in the second experiment (auto/heterotrophicbio®lm) batch experiments had to be carried out. For thispurpose, the reactor was rinsed with dilution water ®rstand then the substrate concentration was set to 400 mg/lglucose. The decrease in glucose concentration in the reactorwas monitored during 90 min. The feeding with substrateand dilution water was turned down during thebatch experiment, however the ¯ow velocity in the reactorwas kept constant in order to maintain complete mixingand mass transfer conditions.Autotrophic bio®lm dynamicsThe long-term investigation of growth and decayof nitrifying bacteria has been divided into threephases (see Table 4 and Fig. 8) where in the ®rstphase the exponential growth of the bacteria wasexplored, in the second the behaviour during starvation(no substrate loading) and in the third phasethe restart of bacterial activity. Measurements ofoxygen and substrate pro®les (see Horn and Hempel,1997a) revealed that after the initial growth periodoxygen became the growth limiting substrate (approximatelydays 100 to 152). Note that the ammonialoading was reduced to 1.1 gm 2 d 1 towards theend of phase 1 (days 152 to 163) which is not mentionedin the original literature (Horn, personalcommunication). As a consequence the bacterialgrowth was ammonia limited in this period. Thisalso explains the peak (single point) in the ammonia¯ux at day 164 (Fig. 8). After restarting the ammonialoading at day 201 bacterial activity was immedi-
2158Wolfgang Rauch et al.Table 4. Substrate loading and oxygen concentration during the experiments. (After Horn and Hempel, 1997a,b)Experiment Phase Day S S loading (gm 2 d 1 ) S NH loading (gm 2 d 1 ) O 2 (gm 3 )1 1 0±165 Ð 3.0±4.0 6.02 166±200 Ð 0.0 6.03 201±296 Ð 3.0 3.5±6.02 1 0±108 1.5 0.0 6.02 109±140 0.0 0.0 6.03 141±224 1.0 3.0 6.0ately measured and increased linearly until thegrowth process was again oxygen limited. This oxygenlimitation is also documented by the reductionin the measured ¯ux when the oxygen concentrationin the tube reactor was reduced from 6.0 to 3.5 mg/lfrom day 270 until the end of the experiment.The parameters of the proposed model wereassessed based on a combination of direct use ofFig. 8. Observed and simulated bio®lm thickness (top) and ammonia ¯ux (centre). Simulated mass fractionsof autotrophic bacteria together with active amount (bottom).
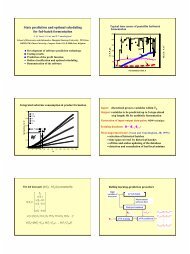
A simpli®ed mixed-culture bio®lm model 2159Table 5. Parameters used in the modelling predictionsParameter Exp. 1 Exp. 2 Estimatedm H (1/d) 0.8Y H (gCOD/gCOD) 0.085b H (1/d) 0.015m A (1/d) 0.075 0.075 YesY A (gCOD/gN) 0.115 0.115b A (1/d) 0.04 0.04kh (1/d) 0.08 0.08i x (gN/gCOD) 0.08 0.08fp () 0.08 0.08k dt () 0.1 0.1D So (cm 2 /d) 2.1 2.1 NoD Ss (cm 2 /d) 0.58 0.58D Snh (cm 2 /d) 1.8 1.8r m (kg/m 3 ) 20 25measured data, literature data and calibration usingnon-linear optimisation techniques. Mean bio®lmdensity r m was measured several times during theexperimental period and the mean value of thosemeasurements was implemented in the model. Hornand Hempel (1997b) identi®ed the detachment ratedirectly by comparing measured and simulatedvalues of suspended solids in the e‚uent. Here weconsistently used their ®ndings of the second experimentfor the detachment coecient k dt . Di€usioncoecients and stoichiometric coecients were alsotaken directly from literature (Horn and Hempel,1997b). All other parameter (m A , Y A , b A , k h ) valuesand the initial conditions for volume fractions andbio®lm thickness were determined by minimisationof the error when comparing simulation with experimentalresults. The ®t was carried out by using agenetic algorithm (Goldberg, 1989) for non-linearoptimisation. The calibrated set of model parametersfor both experiments is listed in Table 5and initial conditions in Table 6.In Fig. 8 the simulated ammonia ¯ux and bio®lmthickness is compared against the measurements. Itis apparent that the ammonia turnover rate predictionsof the model are excellent and in fact comparableto the results obtained by using the much morere®ned model of Horn and Hempel (1997a). In generalalso the bio®lm thickness is simulated very wellby the simpli®ed mixed-culture model but a deviationwith respect to biomass loss during starvation(phase 2) is observed. Figure 8 also depicts the pro-®le of the simulated volume fraction of the nitrifyingbacteria within the solid phase (e sA ) togetherwith the active fraction of the component. SubstrateTable 6. Initial conditions used in the modelling predictionsParameter Exp. 1 Exp. 2L ini (m 10 6 ) 75 40M A /SM ini () 0.05 0.05M H /SM ini () 0.00005limitation occurs as soon as the total amount ofspecies present is no longer active, i.e. participatingin the conversion process. The predicted limitationsÐforoxygen starting at day 110 and day227 and for ammonia at days 151 to 163Ðcorrespondvery well with the measured substrate andoxygen pro®les in Horn and Hempel (1997a).However, one should note that the simulationresults with respect to the active fractions assume auniform distribution of the particulate components,whereas probably a spatial distribution exists.Notwithstanding this discrepancy, the model wasable to predict the general behaviour of biomassgrowth and decay over a long period.Autotrophic±heterotrophic bio®lm dynamicsThe investigation of the dynamics of growth anddecay of a mixed-culture bio®lm was again dividedinto three phases (Table 4 and Fig. 9) comparableto the ®rst experiment. The ®rst phase was concernedwith the growth of the heterotrophic bacteriagroup only. Substrate (glucose) loading wasthe limiting factor for growth during this periodwhich made the earlier described batch experimentsnecessary to predict the maximum turnover ratesfor glucose. Again the second phase was a period ofstarvation for the biomass where no substrate wasfed. In phase three glucose and ammonia were fedsimultaneously to the bio®lm thus exploring thegrowth of two species and their competition foroxygen and space.Figure 9 compares the measurements with predictedvalues of bio®lm thickness, ammonia ¯uxand maximum glucose ¯ux obtained by the simpli-®ed mixed-culture bio®lm model. In order to testthe predictive power of the model all parametervalues already calibrated in the ®rst experimentwere used here without any adjustment. Hence, calibrationwas performed only for the parameters relatedto the dynamics of the heterotrophic bacteria(m H , Y H , b H ) and for the initial conditions. Themean bio®lm density has been obtained again fromdirect measurements.As in the ®rst experiment, the simpli®ed mixedculturebio®lm model was able to replicate the overalldynamics very closely. For the maximum glucose¯ux a maximum deviation of 22% between thesimulated and recorded values was found at the endof phase two. This di€erence is probably due toboth the heterogeneity of the bio®lm and the complexbehaviour with respect to lysis, death andmaintenance. Although this is discussed at lengthby Horn and Hempel (1997b) their re®ned modelalso failed in accurate glucose ¯ux predictions. Thelinear increase in ammonia ¯ux in the third phase isdescribed very well with the proposed model showingonly a small discrepancy of 14% at the end ofthe experiment. Note that the start of the growth ofthe autotrophic bacteria species was implemented asan initial condition of the model speci®ed for day
2160Wolfgang Rauch et al.Fig. 9. Observed and simulated bio®lm thickness (top), ammonia ¯ux (centre) and maximum glucose¯ux measured in the batch experiment (bottom).141 (X BA being zero prior to that time instant),which corresponds to the approach of Horn andHempel (1997b).DiscussionThe limitation of conversion processes due to thedi€usion of soluble components (S O , S NH , S S ) isone of the major aspects in the investigated experiments.It is apparent from Figs 8 and 9 that theproposed active fraction concept is able to describesubstrate limitation according to reality. In spite ofthe fact that the spatial distribution of the specieswithin the bio®lm is neglected, the principles of theactive fraction concept proved to be applicable forthe simulation of bio®lm dynamics.In both simulations the model predicted a loss ofbiomass activity that was not observed in the samemagnitude during the experiment. The reason forthis discrepancy is not the chosen description ofbiomass detachment but the implemented processdescription for modelling endogenous respirationand death. The deat -regeneration concept assumes
A simpli®ed mixed-culture bio®lm model 2161that only a fraction (f p ) of the biomass undergoesinactivation whereas the rest is ®rst converted toslowly biodegradable organic matter (X S ), subsequentlyhydrolysed and then converted back tobiomass. During the starvation period the bacterialgrowth process is stopped. Hence, thicknessdecreases due to the hydrolysis of the slowly biodegradableorganic matter.Some of the parameters used in the model havebeen either taken directly from measurements (f m )or without change from Horn and Hempel (1997b)(D i , k dt ). Parameters concerning the approachesfrom ASM1 were taken from Henze et al. (1987)(i x , fp). All other parameters had to be adjusted inorder to ®t the experimental results. Although mostof the values found (Table 5) are well within therange of recorded data (Kissel et al., 1984; Wannerand Gujer, 1986; Arvin and HarremoeÈ s, 1990; Hornand Hempel, 1997 a, b) a di€erence is seen for themaximum growth rate and the yield coecient ofheterotrophic bacteria. Although both values deviateindividually from commonly used parametervalues, the relation m H /Y H (expressing the maximumspeci®c substrate conversion rate) is again a standardvalue. The di€erence in the parameter valuesis probably due to the use of the death regenerationconcept as this leads sometimes to special parametercombinations for the description of decay. This problemis well known in activated sludge modelingbut might be even more pronounced here.CONCLUSIONSWe presented a simpli®ed mixed-culture bio®lmmodel and discussed the application of the modelfor two long-term experiments described in the literature.The basic idea of the proposed model is todecrease model complexity in order to allow fastbut suciently accurate simulation of bio®lmdynamics. This is achieved by decoupling the calculationof substrate di€usion into the bio®lm fromthe computation of the conversion processes in thebio®lm. The ®rst step of the procedure assumes apseudo-steady-state situation with respect to the diffusionand solves the problem analytically. Theresult of this ®rst step is an estimate on the fractionof each biomass species that is active in the presentsituation. In the second step of the procedure allconversion processes within the bio®lm are computeddynamically. The bacterial species areassumed to be homogeneously distributed as in anideally mixed tank reactor but with only a certainfraction of each species active.The critical assumption made in the model is thehomogeneous distribution of the bacterial species.However, as seen from Fig. 9 this simplifyingassumption does not seem to a€ect the descriptiveability of the model for a mixed-culture bio®lm system.Meanwhile, the avoidance of partial di€erentialequations for computation of the bio®lmdynamics by using the two-step procedure insteadresults in a signi®cant reduction of the model structurecomplexity as compared to state-of-the-artmixed-culture bio®lm models. This feature allows adirect implementation of standard biokinetic conversionmodels as used in activated sludge modelling.We conclude that the simpli®ed mixed-culturebio®lm model is an attractive tool when emphasis isput more on fast predictions of system behaviourthan on detailed understanding.AcknowledgementsÐFinancial support for this work wasprovided by the Austrian Government and the Fund forScienti®c Research, Flanders (Belgium) (F.W.O.). The secondauthor is Research Assistant of the Fund forScienti®c Research, Flanders (Belgium).REFERENCESArvin E. and HarremoeÈ s P. 1990. Concepts and modelsfor bio®lm reactor performance. Wat. Sci. Techn. 22 (1±2) 171±192. .Bishop P. (1997) Bio®lm structure and kinetics. Wat. Sci.Techn. 36 (1), 287±294.Christiansen P., Hollesen L. and HarremoeÈ s P. (1995)Liquid ®lm di€usion on reaction rate in submerged bio-®lters. Wat. Res. 29 (3), 947±952.Dold P.L., Ekama G.A. and Marais GvR. (1980) A generalmodel for the activated sludge process. Prog. WaterTechn. 12, 47±77.Goldberg D. E. (1989) Genetic algorithms in Search,Optimization and Machine Learning. Addison-Wesley,Reading, Mass.HarremoeÈ s P. (1978) Bio®lm kinetics. In: Water PollutionMicrobiology. Mitchell (ed.) Vol. 2. pp. 71±109. Wiley,N.Y.Henze M., Grady C. P. L., Gujer W., Marais GvR andMatsuo T. (1987) Activated sludge model No. 1. IAWQ,London, ISSN: 1010-707X.Horn H. and Hempel D. C. (1997a) Substrate utilizationand mass transfer in an autotrophic bio®lm system:Experimental results and numerical simulation. Biotech.and Bioeng. 53 (4), 363±371.Horn H. and Hempel D. C. (1997b) Growth and decay inan auto-/heterotrophic bio®lm. Wat. Res. 31 (9), 2243±2252.Janning K. F., Mesterton K. and HarremoeÈ s P. (1997)Hydrolysis and degradation of ®ltrated organic particulatesin a bio®lm reactor under anoxic and aerobic conditions.Wat. Sci. Techn. 36 (1), 279±286.Kissel J. C., McCarty P. L. and Street R. L. (1984)Numerical simulation of mixed-culture bio®lm. J. Env.Engin. 110 (2), 393±412.Lewandowski Z., Stoodley P., Altobelli S. and FukushimaE. (1994) Hydrodynamics and kinetics in bio®lm systemsÐrecentadvances and new problems. Wat. Sci.Techn. 29 (1011), 223±229.Mueller J. A., Paquin P. and Famularo J. (1980)Nitri®cation in rotating biological rotators. WaterPollut. Control Fed. 52 (4), 688±710.Rauch W. and Vanrolleghem P. A. (1997) A dynamic bio-®lm model for simulation of wastewater treatment processesand benthic activity in rivers. Technical report.BIOMATH Department, University Gent, Belgium.Rauch W., Aalderink H., Krebs K., Schilling W. andVanrolleghem P. (1998) Requirements for integrated
2162Wolfgang Rauch et al.wastewater modelsÐdriven by receiving water objectives.Wat. Sci. Techn..Wanner O. and Gujer W. (1986) A multispecies bio®lmmodel. Biotech. and Bioeng. 28, 314±328.Wanner O. and Reichert P. (1996) Mathematical modelingof mixed-culture bio®lms. Biotech. and Bioeng. 49 (2),172±184.Williamson K. and McCarty P. L. (1976) A model of substrateutilization by bacterial ®lms. Water Pollut.Control Fed. 48 (1), 9±24.Zhang T. C. and Bishop P. L. (1994) Density, porosityand pore structure of bio®lms. Wat. Res. 28 (11), 2267±2277.