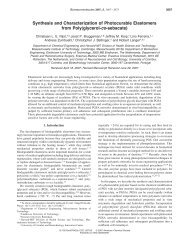
J J. Am. Chem. Soc. Zhu et al.Table 5. Excited-State Energies (∆E) <strong>and</strong> Oscillator Strengths (f)of 1 NCC a by INDO/S-CI bexcited state calcd ∆E,eV fexptl ∆E, eV(λ max, nm)2 1 A 2.66 0.0382 ∼3.0 (410)3 1 A 3.80 0.0442 ∼3.8 (325)4 1 A 4.44 0.12625 3 A 4.58 0.1670aAt the B3LYP/6-31G* geometry of (E)- 1 NCC (see Figure 9).bIncluding singly <strong>and</strong> doubly excited configurations.Figure 10. Potential energy surfaces for 1 NCC (dashed) <strong>and</strong> 3 NCC(solid lines) as a function of the angle R at the carbenic carbon <strong>and</strong> thedihedral angle τ <strong>between</strong> the COOMe group <strong>and</strong> the naphthylcarbeneplane (equidistance of contour lines is 0.5 kcal/mol). The filled circlesdenote points of intersection of the two surfaces; the open circle is thelowest point on the line of intersection, ∼2 kcal/mol above 1 NCC. Thedashed line joining the minimums (squares) represents the minimumenergy pathway. The surfaces were calculated on the basis of a grid ofpoints in 5° increments of R <strong>and</strong> 10° increments of τ (geometries notoptimized).Figure 11. Graphical representation of the results of INDO/S-CIcalculations on the excited states of 1 NCC. Black bars denote calculatedenergies <strong>and</strong> observed b<strong>and</strong> maximums (cf. Table 5 <strong>and</strong> Figure 1). Theleftmost column shows the composition of the excited states in termsof one-electron excitations involving the MOs depicted on the right.(Numbers in parentheses represent the calculated relative oscillatorstrengths).intersection <strong>between</strong> the two surfaces lies indeed 2 kcal/molabove the 1 NCC minimum. As it was impossible to carry outfull geometry optimizations at every R/τ grid point which wasused in the construction of the surfaces in Figure 10, this numbershould be taken with a grain of salt. Apart from that, it is unclearhow this value relates to the thermochemical activation parametersfor the 1 NCC f 3 NCC relaxation process, but it isnevertheless compatible with a postulated assignment of the3 NCC photoproduct to 1 NCC, an assignment that we shall tryto substantiate below.One of the distinct features of the photoproduct of 3 NCC isits broad absorption around 420 nm. As INDO/S-CI provideda rather reasonable description of the electronic structure of3 NCC, we applied the same method to 1 NCC. Indeed, INDO/S-CI predicts a rather strong transition in this region, albeit ∼0.3eV too low, plus another one of similar intensity at 3.8 eV (325Figure 12. IR spectra computed for BHT-COOMe (a), 1 NMC (b),1NCC (c, d), <strong>and</strong> 3 NCC (e, f), juxtaposed with the (inverted)experimental difference spectrum (c - b) of Figure 2 (g). B3LYP/6-31G* frequencies scaled by 0.97.nm) where the experimental spectrum indeed shows also a b<strong>and</strong>(Table 5, Figure 11). Thus, INDO/S-CI supports the assignmentof 1 NCC as the photoproduct of 3 NCC.IR spectra also support the assignment of 1 NCC as thephotoproduct of 3NCC. Figure 12 depicts the differencespectrum (1100-1900 cm -1 ) for the re-formation of 3 NCC fromthe photoproduct. This experimental spectrum is compared withspectra computed (B3LYP/6-31G*) for (Z,Z)- <strong>and</strong> (E,Z)- 3 NCC(the two conformers that had been identified from the ESRspectra), (E)- <strong>and</strong> (Z)- 1 NCC, <strong>and</strong> spectra computed for alternativephotoproducts of 3 NCC ( 1 NMC, BHT-COOMe). Clearly,the main features of the IR spectrum of the photoproduct (peakspointing downward in spectrum g of Figure 12) agree reasonablywell with the predictions for 1 NCC (Figure 12, spectra c <strong>and</strong>d). Although some of the smaller features <strong>between</strong> 1300 <strong>and</strong>1500 cm -1 are lost because they coincide in part with strongerpeaks of 3 NCC, the important triad of peaks at 1591, 1626, <strong>and</strong>1641 cm -1 <strong>and</strong> the group of b<strong>and</strong>s around 1200 cm -1 are wellreproduced by B3LYP.In contrast, the experimental spectrum is entirely incompatiblewith the predictions for the tricyclic cyclopropene, BHT-COOMe (spectrum a; note in particular the absence of any peaks
<strong>Singlet</strong> <strong>and</strong> <strong>Triplet</strong> 2-<strong>Naphthyl</strong>(carbomethoxy)carbene J. Am. Chem. Soc. K<strong>between</strong> 1700 <strong>and</strong> 1850 cm -1 ). In the case of 1 NMC (spectrumb), the differences are more subtle, but the complete absenceof the rather intense C-O stretch predicted at ∼1350 cm -1indicates, in addition to the evidence provided in the previoussection, that the experimental spectrum is incompatible with1 NMC.We take this occasion to return briefly to 3 NCC, whose IRspectrum is also very satisfactorily reproduced by B3LYP(Figure 12, spectra e <strong>and</strong> f) perhaps with the exception of therelative intensities of some of the smaller peaks that do not agreeoptimally with those in the experimental spectrum. A closerinspection reveals that many of the peaks are split into pairs inaccord with the predictions for the two conformers of 3 NCC(see in particular the region around 1200 cm -1 ) so that thepresence of these two species which had become evident fromthe ESR spectra can also be detected by IR.We do not claim that the above spectroscopic evidencerepresents a structural proof, but at least it is in good accordwith our proposed assignment of 1 NCC to the metastablephotoproduct of 3 NCC. On the basis of the available experimentalresults, <strong>and</strong> their concord with the theoretical findings,we propose that this is indeed the first example of a reversibleinterconversion <strong>between</strong> a triplet ground-state carbene with itsmetastable singlet counterpart. This behavior is made possibleby virtue of the carbomethoxy group’s preference for aperpendicular conformation in the singlet state.A very similar phenomenon was recently reported by Berson<strong>and</strong> co-workers, who found that the singlet <strong>and</strong> triplet states ofdimethylenepyrrole diradicals can be stabilized separately. 108,109Berson conjectured that the energetic ordering of spin statesdepends critically on the conformation of the tosyl substituentat the pyrrole nitrogen atom. Hence, intersystem crossing iscoupled to the conformational isomerization of this substituent,a process that may be quite slow in solid matrixes. In contrastto the case of the dimethylenepyrrole diradicals, where bothspin states were found to be thermally stable up to 90 K, theS/T gap in NCC makes for a sufficient thermochemical drivingforce to permit observation of slow S f T conversion even at12 K. 110Finally, we briefly address the question of why the decay ofthe diazo precursor, MDA, which occurs presumably from thesinglet excited state, leads almost exclusively to the tripletcarbene (cf. Figure 1). The reason for this may be that thepredominant conformers of ground-state MDA are entirelyplanar. If excitation does not result in any conformationalchange, 111 the incipient carbene will also arise in a planarconformation where the singlet is much less stable than thetriplet (on enforcing planarity in 3 NCC, the S/T splitting is ∼17kcal/mol by B3LYP/6-31G*). If intersystem crossing is morerapid than decay along a singlet pathway to a 90° twistedgeometry (which may furthermore be impeded considerably inan argon matrix), then the first stable product of the MDAphotolysis will be the triplet carbene, as observed.6. Other Photoproducts. Along with the formation of 3 NCC,photolysis of the diazo precursor, MDA, produces two distinctIR peaks, a double-humped one at 1846 cm -1 <strong>and</strong> anotherclosely spaced group at 2120 cm -1 (Figure 2, spectrum b - a).(108) Bush, L. C.; Heath, R. B.; Feng, X. W.; Wang, P. A.; Maksimovic,L.; Song, A. I.; Chung, W.-S.; Berinstain, A. B.; Scaiano, J. C.; Berson, J.A. J. Am. Chem. Soc. 1997, 119, 1406.(109) Bush, L. C.; Maksimovic, L.; Feng, X. W.; Lu, H. S. M.; Berson,J. A. J. Am. Chem. Soc. 1997, 119, 1416.(110) Berson’s diradicals were designed to have nearly degenerate singlet<strong>and</strong> triplet states. 108,109 Consequently, they lack a thermochemical drivingforce for S f TorTf S conversion which could be part of the reason itis not observed.Neither peak changes appreciably on >515-nm photolysis of3 NCC, but both peaks increase slightly in intensity on 450-nmphotolysis of 1 NCC. The peak at 2120 cm -1 can readily beassigned to 2-naphthyl(methoxy)ketene (NMK) resulting fromWolff rearrangement. NMK may be formed initially from theminor conformers of MDA (Z,Z <strong>and</strong> E,E), perhaps via aconcerted Wolff rearrangement, <strong>and</strong> as one of several minorphotochemical products in subsequent bleachings of the (perpendicular)1 NCC. NMK is distinct from 2-naphthyl(carbomethoxy)ketene(NCK), which is formed in the course of theCO trapping studies. (The ketene stretching vibration of NCKappears to coincide with, <strong>and</strong> thus be largely masked by, thestrong 2100-cm -1 b<strong>and</strong> of the diazo precursor.) Neither keteneappears to manifest itself detectably in the optical spectrumabove 300 nm.The other peak at 1846 cm -1 is more enigmatic becauseseveral species could conceivably be responsible for it, notablythe valence isomers BHT- <strong>and</strong> BBT-COOMe as well as thecyclic allenes that result from ring opening of the former (Figure8). However, all of these compounds have, in addition to thecyclopropene (BHT/BBT) or the cyclic allene stretch (BCH/BCT), an associated carbonyl stretching frequency around 1750cm -1 from the COOMe group which should rise in concert withthe former. However, the difference spectra for photolysis ofMDA show no such peaks <strong>and</strong> the calculated spectra for theabove four compounds are generally incompatible with that ofthe species associated with the 1846-cm -1 peak.The probable identity of this product revealed itself on 313-nm photolysis which led to the complete bleaching of the 1846-cm -1 peak in the IR along with a few others at lower energiesof which one at 1105 cm -1 was most prominent. Moreimportantly, the bleaching of this species led to a strong increaseof the IR absorption of CO 2 , which indicates that the speciesunder investigation must be able to lose this fragment. Onecompound that fulfills this role is 2-(2-naphthyl)propiolactone(NPL). The β-lactone structure would be expected to display ahigh-frequency carbonyl stretch, in good accord with theexperimentally observed value of 1846 cm -1 . 112 NPL representsa logical photoproduct of 1 NCC, arising as a result of formalinsertion of the carbene center into a C-H bond of the methoxygroup. 113 This β-lactone would be expected to suffer photo-(111) Full geometry optimizations of MDA in its lowest excited singletstate (by CIS or CASSCF) turned out to be computationally too dem<strong>and</strong>ing.However, we note that the HOMO of MDA is π-antibondingalong the naphthyl-CN 2 bond whereas the LUMO is slightly bonding.Hence, excitation should lead to an increase in the π bond order alongthis bond which makes it very probable that the planar conformation of thenaphthyl-CN 2 moiety is preserved in the first excited state.(112) Socrates, G. Infrared Characteristic Group Frequencies; Wiley-Interscience: Chichester, 1980.(113) β-Lactone formation has been observed previously on thermolysisof diazo esters: Richardson, D. C.; Hendrick, M. E.; Jones, M. J. Am. Chem.Soc. 1971, 93, 3790.