Updating Bearing Capacity – SPT Graphs - Maryland State Highway ...
Updating Bearing Capacity – SPT Graphs - Maryland State Highway ...
Updating Bearing Capacity – SPT Graphs - Maryland State Highway ...

Create successful ePaper yourself
Turn your PDF publications into a flip-book with our unique Google optimized e-Paper software.
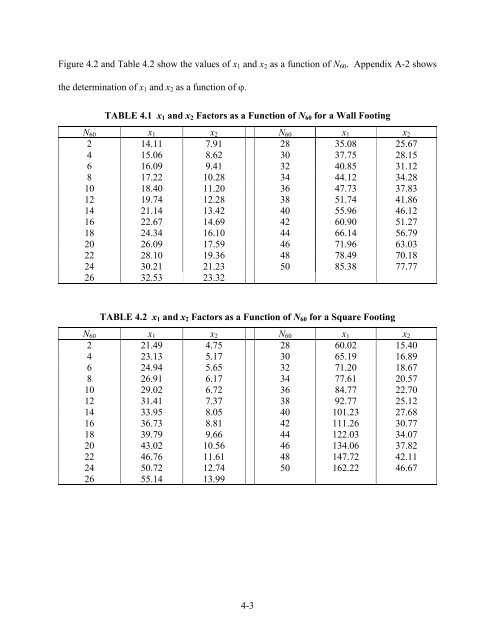
Figure 4.2 and Table 4.2 show the values of x 1 and x 2 as a function of N 60 . Appendix A-2 showsthe determination of x 1 and x 2 as a function of ϕ.TABLE 4.1 x 1 and x 2 Factors as a Function of N 60 for a Wall FootingN 60 x 1 x 2 N 60 x 1 x 22 14.11 7.91 28 35.08 25.674 15.06 8.62 30 37.75 28.156 16.09 9.41 32 40.85 31.128 17.22 10.28 34 44.12 34.2810 18.40 11.20 36 47.73 37.8312 19.74 12.28 38 51.74 41.8614 21.14 13.42 40 55.96 46.1216 22.67 14.69 42 60.90 51.2718 24.34 16.10 44 66.14 56.7920 26.09 17.59 46 71.96 63.0322 28.10 19.36 48 78.49 70.1824 30.21 21.23 50 85.38 77.7726 32.53 23.32TABLE 4.2 x 1 and x 2 Factors as a Function of N 60 for a Square FootingN 60 x 1 x 2 N 60 x 1 x 22 21.49 4.75 28 60.02 15.404 23.13 5.17 30 65.19 16.896 24.94 5.65 32 71.20 18.678 26.91 6.17 34 77.61 20.5710 29.02 6.72 36 84.77 22.7012 31.41 7.37 38 92.77 25.1214 33.95 8.05 40 101.23 27.6816 36.73 8.81 42 111.26 30.7718 39.79 9.66 44 122.03 34.0720 43.02 10.56 46 134.06 37.8222 46.76 11.61 48 147.72 42.1124 50.72 12.74 50 162.22 46.6726 55.14 13.994-3