Fighting Crime with a Little Help from my Friends ... - Sciences Po
Fighting Crime with a Little Help from my Friends ... - Sciences Po
Fighting Crime with a Little Help from my Friends ... - Sciences Po

Create successful ePaper yourself
Turn your PDF publications into a flip-book with our unique Google optimized e-Paper software.
Laboratoire interdisciplinaire d'évaluation des politiques publiques LIEPP Working Paper October 2013, nº17 <strong>Fighting</strong> <strong>Crime</strong> <strong>with</strong> a <strong>Little</strong> <strong>Help</strong> <strong>from</strong> <strong>my</strong> <strong>Friends</strong>: Party Affiliation, Inter-‐jurisdictional Cooperation and <strong>Crime</strong> in Mexico Ruben Durante <strong>Sciences</strong> <strong>Po</strong> – Department of Economics, Yale University, LIEPP ruben.durante@sciencespo.fr and Emilio Guterriez Centro de Investigación Económica emilio.gutierrez@itam.mx <strong>Sciences</strong> <strong>Po</strong> | LIEPP 27 rue Saint-‐Guillaume 75337 Paris Cedex 07 Tel : 01 45 49 83 61 www.sciencespo.fr/liepp © 2013 by Ruben Durante & Emilio Gutierrez. All rights reserved.
<strong>Fighting</strong> <strong>Crime</strong> <strong>with</strong> a <strong>Little</strong> <strong>Help</strong> <strong>from</strong> <strong>my</strong> <strong>Friends</strong>:Party Affiliation, Inter-jurisdictional Cooperationand <strong>Crime</strong> in Mexico *Ruben Durante † Emilio Gutierrez ‡October 19, 2013ABSTRACTWe investigate the relationship between inter-jurisdictional cooperation and lawenforcement in Mexico. Exploiting a Regression Discontinuity Design in closemunicipal elections, we study how improved opportunities for cooperation incrime prevention among neighboring municipalities - proxied by their degreeof political alignment - may result in lower rates of violent crime. We findthat municipalities in which the party in power in the majority of neighboringjurisdictions barely won experience significantly lower homicide rates duringthe mayor’s mandate than those in which it barely lost. This effect is sizeableand independent of which party is in power in the neighboring municipalities.*We thank Pedro Dal Bó, Roberto Galbiati, Emeric Henry, Brian Knight, Jens Ludwig, Cesar Martinelliand Daniel Mejía for helpful comments, and seminar participants at Universidad de Los Andes and ITAM aswell as participants at the 2013 meeting of the LACEA America Latina <strong>Crime</strong> and <strong>Po</strong>licy Network for helpfuldiscussion. We are grateful to Patrick Signoret, Carlos Farah, and Etienne Fize for excellent research assistance.Ruben Durante is grateful to the Interdisciplinary Center for Public <strong>Po</strong>licy Evaluation (LIEPP) at <strong>Sciences</strong> <strong>Po</strong>for financial support.† <strong>Sciences</strong> <strong>Po</strong> and Yale University. Contact: Ruben.Durante@sciences-po.org.‡ ITAM-CIE. Contact: Emilio.Gutierrez@itam.mx.1
«[Mexican] municipal police forces...are also among the least effective:the patchwork of command muddles operations.In Monterrey the metropolitan area alone has eleven different forces,using different training, tactics and even brands of radio.“If a criminal crosses the street he has reached a safe haven,” admits one official»The Economist, October 14 th 20101. INTRODUCTIONThe literature on federalism has traditionally focused on the fundamental trade-off betweenthe capacity of a decentralized system to tailor policies to local preferences, and that ofa centralized one to properly internalize inter-jurisdictional spillovers (Oates, 1977, 1999;Gonzalez-Navarro, 2008; Knight, 2011). 1One aspect that could potentially alter the terms of this trade-off concerns the possiblesynergies <strong>from</strong> horizontal inter-jurisdictional cooperation, that is, between jurisdictions ofthe same administrative level. When spatial spillovers are present, systematic cooperationamong local authorities can make local provision of public goods more effective, whereasthe lack of it can exacerbate the inefficiencies associated <strong>with</strong> decentralization.One area in which this aspect is particularly relevant is law enforcement: in the contextof a fragmented public security system, better coordination and information sharing amonglocal police forces can favor effective crime reduction efforts. Indeed, the potential benefit<strong>from</strong> inter-jurisdictional cooperation, and the implications for the efficient organization of theadministration of justice, have been extensively discussed in both the criminal justice and thepublic administration literature (McDavid, 1974; Ostrom et al., 1978; Parks, 2009), but havebeen largely disregarded by economists. One noticeable exception is represented by Loeper’srecent theoretical contribution on inter-jurisdictional coordination in federal systems (2011).1 For a thorough discussion of alternative models of federalism, of the concept of federal governance and itsrelation <strong>with</strong> economic performance see respectively Inman and Rubinfeld (1997) and Inman (2007).2
2In this paper we investigate the relationship between horizontal inter-jurisdictional cooperationand the effectiveness of law enforcement in the context of Mexico, where crime incidencehas steadily increased over the past decade, and an animated debate about the needfor better coordination among local police forces is ongoing. In particular, we apply a RegressionDiscontinuity Design (RDD) in close local electoral races to study how improvedcooperation among neighboring municipalities, proxied by the degree of political alignmentbetween mayors, can improve crime deterrence and result in lower crime rates, <strong>with</strong> particularregard to homicides. 3 Our identification strategy relies on the assumption that, if randomfactors - e.g. unexpected breaking news, weather conditions on election day, etc. - havean (even small) impact on electoral outcomes, the victory of the candidate of the party thatcontrols the majority of neighboring municipalities would mimic random assignment in electionsdecided by a narrow margin. Such RDD set-up therefore delivers a (local) source ofexogenous variation in political alignment <strong>with</strong> neighbors, which, we argue, should facilitatecooperation in law enforcement.Using this approach, we find that municipalities where the candidate of the party in power inthe majority of neighboring municipalities won by a small margin experienced significantlylower homicide rates during that mayor’s mandate than comparable municipalities in whichthat party barely lost. The effect is sizeable - a decrease in homicide rates of 35 to 43% - andappears to be independent of which party is in power in the neighboring municipalities. Reassuringly,political alignment <strong>with</strong> neighbors does not appear to be correlated <strong>with</strong> a varietyof other outcomes, including crime incidence before the election. That improved horizontalcooperation is driving this result, is further supported by the fact that the documented reductionin crime is increasing in the share of same-party neighbors, and is not explained by2 While Loeper’s argument refers to the case of a pure coordination game and focuses on the external costfor a jurisdiction to choose a policy different <strong>from</strong> that chosen by others, his framework does not allow foractual cooperation and does not take into account the spatial dimension of it, that is, that cooperation <strong>with</strong>neighbors may be more valuable than cooperation <strong>with</strong> non-neighbors.3 The underlying assumption, discussed below, is that it is easier to achieve cooperation between mayors ofthe same party than between mayors of competing parties.3
political alignment <strong>with</strong> state or federal authorities.Our paper relates to various streams of literature. First and foremost, our work contributesto the literature on decentralization in federal systems by providing novel evidence that, inthe presence of geographical spillovers, inter-jurisdictional cooperation can result in moreeffective provision of local public good. Although our findings are specific to the area of lawenforcement and public security, we believe that some of the insights <strong>from</strong> our analysis canapply to other areas of public policy involving inter-jurisdictional spillovers.Our contribution is also related to the literature on the role of coordination in the implementationof crime-reducing policies: while previous contributions have focused on coordinationbetween local and federal police (Dell, 2011), or between different police forces at thefederal level (Soares and Viveiros, 2010), we focus on horizontal coordination between localpolice forces operating in geographically distinct locations, an aspect which economists havelargely disregarded or examined only indirectly (Wheaton, 2006).Our work also relates to previous studies on the importance of political alignment (Dell,2011; Brollo and Nannicini, 2011); while these contributions focus on the impact of politicalalignment between local and central authorities - on drug-related crime deterrence in Mexicoand on federal transfers to municipal government in Brazil respectively - we look at the effectof political alignment between jurisdictions of the same administrative level.Finally, <strong>from</strong> a methodological perspective, our approach is close to that of other studies thathave used a regression discontinuity design to examine the impact of party affiliation on avariety of political and non-political outcomes (Lee, 2001; Lee et al., 2004b; Dal Bó et al.,2009; Pettersson-Lidbom, 2008).The remainder of the paper is organized as follows. Section 2 provides background informationon the Mexican political and institutional system. Section 3 describes the data usedin the empirical analysis. Section 4 illustrates the empirical strategy and presents the mainfindings which are further discussed in section 5. Section 6 concludes.4
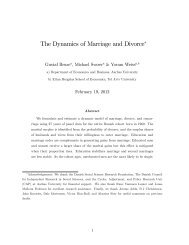
2. BACKGROUND ON MEXICOThe Mexican context is particularly well-suited for an empirical analysis of the impact ofcooperation among local police forces on crime for a variety of reasons. Homicide rates inMexico have sharply increased in recent years. As displayed in Figure 1 - which shows theevolution of the number of monthly homicides recorded in the country since 2000 - whileuntil 2006 the incidence of homicides remained relatively constant (around 1,000/month),since 2007 the number of homicides has steadily increased, reaching more than 2,000/monthby the end of 2010. This unprecedented surge in violent crime in Mexico has made the objectof a growing literature in social sciences to which this paper attempts to contribute.Most observers view the increase in homicides as a direct consequence of the federal government’sstrategy against drug-related organized crime, which has been primarily focused onneutralizing drug cartel leaders, resulting in increased violent conflict among smaller gangsfor the control of the territory (Guerrero-Gutiérrez, 2010; Dell, 2011). This paper does not attemptto identify the causes of the observed increase in violent crime but, rather, to shed lighton whether better coordination among local polices can be instrumental to its containment.Indeed, poor coordination can be especially problematic in the context of Mexico’s highlyfragmented security apparatus, 4 in which the investigation and prosecution of homicides isthe responsibility of local police forces. We focus, in particular, on the role of municipalpolice which accounts for about 40% of Mexican total law enforcement officers.(Guerrero-Gutiérrez, 2010) Each municipal police department operates under the direct control of themunicipality government. The mayor - who is elected every three years - has considerableinfluence over the selection of local police chiefs and, more in general, over the organizationof the police department. Indeed, the mayor’s party affiliation can have a considerable impact4 Sabet (2012) estimates that there are about 3,000 different police forces at the municipal, state and federallevel in Mexico.5
on the functioning, priorities, and policing style of municipal forces. 5 More important, in thecontext of Mexico’s highly polarized political landscape, heterogeneity in party-affiliationbetween mayors of neighboring municipalities can aggravate the lack of inter-jurisdictionalcooperation and has, in some instances, even resulted in actual confrontations between differentlocal police forces (Davis, 2006; Tapia, 2009a,b).It is hence not surprising that an animated debate on the opportunity of reforming the currentorganization of Mexican police has emerged among Mexican policy-makers, including atthe highest level. In October 2010, for example, the then President Felipe Calderón Hinojosaproposed a bill for the creation of a Single-Command National <strong>Po</strong>lice Force, 6 motivated bythe need to foster coordination and increase homogeneity in the operation of local policeforces. 7 With a similar motivation, since 2011 the National Conference of Mexican Governors(CONAGO, a periodic summit of Mexican State governors) has implemented regularcooperative efforts aimed at reinforcing information sharing among local police forces engagedin operations against crime. 8While these initiatives have not yet been rigorouslyevaluated, they indicate that local authorities recognize the need for better coordination as aninstrument to combat crime in a more effective way.Recent academic contributions on violence in Mexico have also discussed the importance ofcooperation among police forces. In particular, Dell (2011) presents evidence on the impact5 A curios example of how the mayor’s party affiliation can impact even the most basic aspects of local policeorganization - such as equipment purchases - is reported by Sabet (2012): “PAN administrations argue thatpolice the world over wear blue uniforms and therefore issue uniforms and vehicles in blue. However, bluehappens to be the color of the PAN party, and PRI governments have tried to emphasize other colors. WhenPRI Hank Rhon came to office in Tijuana in 2004 after fifteen years of PAN rule, he gave the police newblack uniforms, repainted the police cruisers black, and created a new emblem for the police. Hank Rhonsold the action as symbolic of a new police force that was making a break <strong>from</strong> the past and reinventingitself, but the partisan undertone was unmistakable. When the PAN returned to office in 2007, they reversedthe previous administration’s changes, issued new blue uniforms, painted the patrol cars blue, and returnedto the old police emblem. Mexicali’s PAN administration repainted the city’s black-and white cruisers bluewhen it came into office in 2007. Hermosillo’s new PRI government, on the other hand, chose to paint theformerly blue police cars orange, a color they argued is the color of Hermosillo and not of any politicalparty.”6 A similar measure has been recently proposed by the new president, Enrique Peña Nieto.7 Further details on the bill are available at http://www.presidencia.gob.mx/iniciativas-de-ley/mando-unico-policial/.8 Further information is available at: www.conago.org.mx.6
of improved coordination between federal and local police on drug-related crime and findsthat improved opportunities for cooperation between local and federal governments (proxiedby the degree of political alignment) result in a higher number of drug-related homicides.However, to the best of our knowledge, no previous empirical study has attempted to measurethe impact of improved horizontal cooperation among local police forces.Before moving to the empirical analysis we provide additional details on the Mexican institutionaland political context. Mexico is a multi-party competitive democracy <strong>with</strong> threemajor political parties disputing most of the positions at stake in local and federal elections:the Institutional Revolutionary Party (PRI), the National Action Party (PAN), and the Partyof the Democratic Revolution (PRD). With regard to the parties’ ideological position, whilePAN is right-to-center and PRD left-to-center, PRI is generally considered as centrist. Whilefederal and state elections are held every six years, municipal elections are held every threeyears <strong>with</strong> all the municipalities in a state voting at the same time. In both local and federalelections the three major parties - particularly PRI and PRD - generally form coalitions <strong>with</strong>smaller parties, although in the vast majority of these cases, the coalition candidate is drawn<strong>from</strong> the major party. It is hence very likely that when the coalition led by one of the majorparties prevails in two neighboring municipalities, the elected mayors will belong to thesame party. 9The existence of a positive relationship between party alignment and inter-jurisdictional cooperationis crucial to our approach and is based on the assumption that mayors affiliatedto the same party will be more prone to encourage cooperative behavior by their respectivemunicipal police departments. This could simply be due to closer personal connections betweenfellow party members operating in the same area, or to shared views regarding crimereductionstrategies and priorities. Party discipline is also likely to play an important role;indeed, it is important to note that mayors, like all elected officials in Mexico, cannot run for9 In some (rather uncommon) cases, two of the major parties may join the same electoral coalition. Sincein these instances inferring the party affiliation of the elected mayor (and the degree of political alignment<strong>with</strong> neighboring mayors) is rather difficult, we prefer to exclude these cases <strong>from</strong> our analysis.7
immediate re-election; hence, they have strong incentives to earn the confidence and goodgraces of higher level party leaders who influence future nominations and appointments forhigher offices (Sabet, 2012; Guillén López, 2006).3. DATAThe data used in our empirical analysis come <strong>from</strong> a variety of sources. Detailed geographicinformation on Mexico’s administrative divisions is available <strong>from</strong> the Mexican Institute forStatistics and Geography (INEGI). Using these data, we identify for each municipality aset of neighbors, defined as those municipalities sharing a boundary. Electoral data for themunicipal elections held since 2000 are available <strong>from</strong> the Mexican Research Center forDevelopment (CIDAC). As mentioned, Mexican municipalities hold elections every threeyears to renew their local authorities. While all municipalities in a state vote in the sameyear, municipalities in different states may hold elections in different years. Table 1 reports,for each state, the election year for which electoral data are used. For each municipality thedata include the total number of votes cast, and those attributed to each party. For everyelection we identify the two parties <strong>with</strong> most votes and compute the gap in vote sharebetween the winner and the looser. From the outcome of the previous election, we identifythe incumbent’s party affiliation. Figure 2 represents the distribution of the ruling party’sidentity across Mexican municipalities in 2008. While some areas are largely controlled bya single party, there is considerable spatial heterogeneity in party’s influence both acrossand <strong>with</strong>in regions. Using this information, we compute, for each municipality, the share ofneighboring municipalities controlled by each of the three main parties at the time the mayortook office. 10As our main outcome of interest we consider the number of homicides in each municipalityin the three years (before and) after the relevant election. Homicide statistics, available10 While for neighboring municipalities <strong>with</strong>in the same state we consider the party of the mayor elected in thesame electoral cycle, for out-of-state neighbors which did not hold elections in the same year, we considerthe party in power at the time of the election.8
<strong>from</strong> INEGI, are derived <strong>from</strong> official administrative records and include the total number ofhomicides recorded each year in a municipality between 2000 and 2010 (Figure 1). We combinethese data <strong>with</strong> information on municipalities’ total population in 2005 - also available<strong>from</strong> INEGI - to calculate the yearly homicide rate in a municipality defined as the numberof homicides per 100,000 inhabitants.Finally, we also use data on a variety of socio-economic variables at the municipal levelwhich we include as controls in our regressions. Data on death rate, adult literacy rate,share of households <strong>with</strong> access to sewage, electricity, or running water, school attendancefor children aged 6 to 24 are available <strong>from</strong> the 2005 INEGI population count (Conteo de<strong>Po</strong>blación y Vivienda). Data on infant mortality rate, human development index, and theshare of female politicians are available <strong>from</strong> the United Nations Development Program(UNDP).Table 2 reports descriptive statistics for all the variables mentioned above separately for thefull set of Mexican municipalities, and for the restricted sample of municipalities used in ourempirical analysis. Some differences in observed means between the restricted sample andthe rest of Mexican municipalities are statistically different <strong>from</strong> zero. These include: winningparty’s and incumbent party’s identity, area, and other socio-economic indicators suchas infant mortality rate, human development index and share of households <strong>with</strong> no access tosewage. Although these differences in observables may question the external validity of theestimates presented below, to the extent to which our empirical strategy correctly exploitsexogenous variation in mayors’ party affiliation, our findings on the relationship betweenpolitical alignment across neighbors and the evolution of homicide rates should be valid forthe municipalities in our sample.9
4. EMPIRICS4.1. EMPIRICAL STRATEGYOur empirical analysis aims to investigate whether improved cooperation among Mexicanmunicipal police forces - proxied by the degree of political alignment of the respective mayors- is associated <strong>with</strong> lower levels of violent crime. One way to test this hypothesis isby simply comparing homicide rates between municipalities that are politically aligned <strong>with</strong>their neighbors and municipalities that are not. However, this procedure is likely to deliver abiased estimate of the causal impact of political alignment on crime-related outcomes since,for example, local political preferences may themselves be affected by crime levels. Toisolate the causal impact of political alignment on homicide rates, we employ a regressiondiscontinuity design (Imbens and Lemieux, 2008; Lee and Lemieux, 2009); in particular,following previous studies on the impact of party identity on various socio-economic outcomes(Dell, 2011; Lee et al., 2004a), we exploit the arguably exogenous discontinuity inthe identity of the ruling party in a municipality given by its victory in a close election.Since we are interested in the degree of political alignment between a given municipalityand its neighbors, we look at those municipalities for which at least 50% of the neighboringmunicipalities were governed by the same party, and, among these, focus specifically onthose municipalities in which the party governing the majority of neighbors won or lost by asmall margin (5% or less).Around the discontinuity, our argument goes, municipalities in which the party ruling inmost of the neighbors barely won would experience an exogenous shock in their capacityof cooperating <strong>with</strong> neighbors. Figure 3 illustrates the basic intuition behind our identificationstrategy by mean of an example. The figure depicts two municipalities in the state ofVeracruz holding local elections in 2007: Samahil (shaded red area) and Timucuy (shadedblue area). Both municipalities share a border <strong>with</strong> five other municipalities, three of whichwere governed by the PRI, one by the PAN, and one by a minor party. However, while in10
Timucuy the PAN won over the PRI by a small margin, in Samahil the PAN lost to the PRIby a similarly small margin. Our identification strategy is based on the comparison of postelectionhomicide rates between ex-ante similar municipalities some of which - like Samahil- became politically aligned <strong>with</strong> the majority of their neighbors and others - like Timucuy -that did not.Figure 4 graphically summarizes our analysis. We take the set of municipalities for whichat least 50% of the neighbors is governed by one party and divide them into 50 bins, eachrepresenting a 0.2-percentage-point difference in vote share between the party governing themajority of neighbors and its closest competitor (defined as vote spread in the figure). Thisvariable is positive if the party governing the majority of neighbors won the election in themunicipality and negative if it lost it. We then define a dum<strong>my</strong> variable indicating whetherthe homicide rate recorded in the municipality in the three years after the relevant electionis above the national median, and regress it on all the control variables introduced above.Finally, we plot the average residual of this regression against the vote spread. As depicted,while the average homicide rate tend to increase <strong>with</strong> the vote spread, there is a significantdecrease in the share of municipalities <strong>with</strong> above-median post-election homicide rate rightat the point in which the vote spread becomes positive, that is, when the party in power inthe majority of neighbors won the election. In line <strong>with</strong> our identification strategy, this dropcan be interpreted as the causal effect of an increase in political alignment on post-electionhomicide rates. In figure 5 we replicate this exercise using as dependent variable the dum<strong>my</strong>variable indicating whether the homicide rate was above the national median in the previousmandate, and find no evidence of a discrete jump at the discontinuity.To examine this pattern more formally, and to be able to control for other factors that mayaffect homicide rates at the local level, we control for a flexible relationship between the votespread and the homicide rate, through a non-parametric local linear regression on each sideof the discontinuity, on the sample of municipalities <strong>with</strong> at least 50% of neighbors governedby the same party and in which that party won or lost the election by a margin of at most 5%.11
Our empirical specification is then:C is = α 0 + α 1 Mwin is + F(Sp is ) + δX ′is + γ s + ε is (1)where subscript is indicates municipality i located in state s; C is is a dum<strong>my</strong> variable takingvalue one if the homicide rate in the municipality in the three years after the election isabove the national median, or, alternatively, the log of one plus the homicide rate; Mwin isis a dum<strong>my</strong> variable taking value one if the party governing 50% or more of i’s neighborswon the election in municipality i; F(·) is a flexible function of Sp is which is the differencebetween this party’s vote share and that of its closer competitor; and finally X ′is is avector of characteristics of municipality i in state s, including winning party dummies, incumbentdummies, and a variety of socio-economic characteristics. State fixed-effects (γ s )are included in all the regressions discussed below.For our empirical strategy to correctly estimate the causal effect of political alignment onhomicide rate two key assumption must be satisfied: i) the outcome of interest must varysmoothly <strong>with</strong> respect to the margin of victory (or loss) of the party governing most of themunicipality’s neighbors, ii) only the treatment - that party’s victory - must have an effect onthe outcome of interest at the discontinuity (Caughey and Sekhon, 2011).To shed light on this aspect, in Table 3 we report the differences in means between observationson each side of the discontinuity for all control variables included in the regressions,and also present the results of simple regression discontinuity analyses (adjusting a lineartrend on each side of the discontinuity for the relationship between each outcome analyzedand the vote spread) using each control as dependent variable. The fact that no significantdifference in these characteristics is observed between municipalities in which the party rulingthe majority of neighbors barely won or lost the election, is reassuring of the fact that themunicipalities in the two groups were not dissimilar ex ante. As a further robustness check,in what follows we also replicate the analysis using the homicide rates in the three yearsprior to the relevant election as dependent variable, to confirm that the treatment variable is12
not correlated <strong>with</strong> pre-election crime incidence.4.2. RESULTSGiven that the distribution of murder rates in our sample is highly skewed (see Figure 6), inthe first part of our analysis we consider as dependent variable a dum<strong>my</strong> indicating whetherthe murder rate in a municipality is above the national median in the three years after therelevant elections. The results are reported in table 4. In columns 1 and 2 we control for statefixed effects, winning and incumbent party fixed effects; in columns 3 and 4 we also controlfor death rate, total area, population density, adult literacy rate, the fraction of households<strong>with</strong> access to sewage, electricity and water, infant mortality rate and human developmentindex. In columns 5 and 6 we control for school attendance rate for individuals aged 6 to 24,and for a variable indicating the fraction of local politicians that are women. In columns 1,3 and 5 we use the optimal bandwidth for the non-parametric estimates on each side of thediscontinuity according to Imbens and Kalyanaraman (2012), while in columns 2, 4 and 6we reduce the optimal bandwidth to half to explore whether the result is sensitive to a moreflexible relationship between the vote spread and the outcome of interest. In all specificationspolitical alignment <strong>with</strong> neighbors displays a negative and significant coefficient (1% level).Furthermore, the coefficient remains very stable when additional controls are included, andwhen the bandwidth is reduced. The magnitude of the coefficient ranges between -0.35 and-0.43, which implies that municipalities that are politically aligned <strong>with</strong> their neighbors are35 to 43 percent less likely to experience above-median homicide rates than municipalitiesthat are not.To rule out the possibility that political alignment might be related to pre-existing crimepatterns, we replicate the analysis looking, this time, at the effect of political alignmenton homicide rates in the three years prior to the election (Table 5). The results provideno evidence of a relationship between pre-election homicide rate and post-election politicalalignment: in none of the specifications the coefficient of interest is significantly different13
<strong>from</strong> zero. This confirms that politically aligned municipalities experienced a decrease inhomicide rate only after the party governing the majority of its neighbors had come to power.The binary nature of the dependent variable used in Table 4 makes it rather hard to interpretthe magnitude of the effect of political alignment on homicide rate. To give a better sense ofthis magnitude, and given the highly skewed distribution of the homicide rate in our sample,in Table 6 we re-estimate equation (1) using the log of one plus the homicide rate after theelection as the dependent variable. In Table 7 we report the analogous results for the threeyears prior to the election. Controls in each column are the same included in Tables 4 and5. Based on the results in Table 6, we estimate that the improved cooperation resulting <strong>from</strong>political alignment between a municipality and its neighbors decreases the log of one plusthe homicide rate by 0.73 to 1.05. Given the observed mean in homicide rates (45.4/100,000inhabitants), these coefficients suggest a reduction in murder rates corresponding to a 52 to65 percent reduction. Once again, political alignment does not appear to be correlated <strong>with</strong>the murder rate recorded in the three years prior to the election: the estimated coefficients inTable 7 are very close to zero and statistically insignificant.5. DISCUSSIONThe results presented thus far indicate that municipalities that are politically aligned <strong>with</strong>their neighbors experience significantly lower murder rates than those that are not. Althoughthese findings may be explained by better cooperation among local police forces when mayorsof neighboring municipalities belong to the same party, they are also consistent <strong>with</strong>alternative explanations. For instance, the close election of a mayor <strong>from</strong> a specific partymay have an impact on crime prevention in a municipality for reasons other than better coordination<strong>with</strong> same-party neighboring mayors, e.g. because crime prevention is a priorityfor that party, or because it supports more effective anti-crime policies. Alternatively, if theparty that governs most of a municipality’s neighbors is also in power at the state or federallevel, political alignment <strong>with</strong> neighbors may in fact reflect improved cooperation of mu-14
nicipal police <strong>with</strong> state or federal authorities (as suggested by Dell, 2011) rather than <strong>with</strong>municipal polices in neighboring jurisdictions.In this section we present additional evidence of the robustness of our baseline results and testsome of these alternative explanations. In particular, we test whether the effect of politicalalignment: (i) is larger the higher the share of neighboring municipalities governed by thesame party (in line <strong>with</strong> an explanation based on improved inter-jurisdictional cooperation),(ii) is not contingent on the identity of the party winning the election; (iii) is not contingenton the identity of the party in power at the state level; and (iv) is not contingent on the factthat the winning party is the same as the incumbent.To test these hypotheses, we turn to a parametric estimation, restricting the sample to municipalitiesfor which the party governing the majority of neighbors won or lost by a marginsmaller than 5%. Equation (2), below, summarizes our empirical strategy which is basedon testing whether the impact of political alignment varies when the latter is interacted <strong>with</strong>other characteristics:C is = α 0 + α 1 Mwin is + ∑t=1 4 (α 2,tMwin ∗ Sp t is + α 3,t(1 − Mwin) ∗ Sp t is )+(2)α 4 Mwin is ∗Y is + α 5 Sp is ∗Y is ∗ Mwin is + α 6 Sp is ∗Y is ∗ (1 − Mwin is ) + δX is ′ + γ s + ε isThe notation largely reproduces the one used in equation (1); however, because the specificationis parametric, we include a fourth order polynomial of the vote spread on each side ofthe discontinuity. In addition, Y is denotes each of the variables used to separately test each ofthe hypotheses spelled above, namely: (i) the share of neighboring municipalities governedby the party in power in most of them; (ii) a dum<strong>my</strong> variable indicating whether the partygoverning most of the neighbors is the PAN (in power at the federal level during the periodof interest); (iii) a dum<strong>my</strong> variable indicating whether the party governing most of the neighborsis also in power at the state level; and (iv) a dum<strong>my</strong> variable indicating whether theparty governing most of the neighbors is also the incumbent. In this context, the coefficient15
α 4 captures whether the effect of the discontinuity on the outcome of interest varies <strong>with</strong> Y is ,while α 5 and α 6 account for the possibility that the same outcome varies smoothly, but indifferent ways, for municipalities <strong>with</strong> different Y is .Table 8 summarizes the results of this section. The first column reports the results for thebaseline regression - including all controls but no interaction <strong>with</strong> Y is - which representsour benchmark. The following columns report the results <strong>with</strong> the interaction terms for theshare of neighboring municipalities governed by the same party (column 2), for the dum<strong>my</strong>for PAN ruling most of the neighbors (3), for the dum<strong>my</strong> for the party ruling most of theneighbors also controlling the state government (column 4) and for the dum<strong>my</strong> indicating ifthe party ruling most of the neighbors is also the incumbent.In column 2 both the coefficient on political alignment <strong>with</strong> neighbors (Mwin is ) and thecoefficient on its interaction <strong>with</strong> the share of neighboring municipalities governed by thesame party are negative and large in magnitude. The sum of both coefficients is significantlydifferent <strong>from</strong> zero at the 1% level. This result is consistent <strong>with</strong> the idea that the electionof a mayor <strong>from</strong> a given party in a municipality is more likely to boost inter-jurisdictionalcooperation the more of the neighboring mayors belong to that party. In column 3, politicalalignment <strong>with</strong> neighbors displays a negative and significant coefficient similar in magnitude<strong>with</strong> the one reported in column 1. However, the interaction between political alignment andthe dum<strong>my</strong> indicating whether the party governing most of the neighbors is the same asthe one in power at the federal level is not statistically significant. In column 4, politicalalignment <strong>with</strong> neighbors displays a negative coefficient similar in magnitude <strong>with</strong> the onereported in column 1; the interaction between political alignment and the dum<strong>my</strong> indicatingwhether the party governing most of the neighbors is the same as the one in power at thestate level is also negative, smaller in magnitude and not statistically different <strong>from</strong> zero.These findings suggest that the impact of political alignment <strong>with</strong> neighbors on crime reductionis independent <strong>from</strong> the degree of political alignment <strong>with</strong> federal or state authorities,and further support the view that the observed reduction in crime may be attributed to im-16
proved horizontal rather than vertical cooperation. Finally column 5 also rejects the hypothesisthat the reduction in homicide rates is driven by the fact that the incumbent party maybe better at combating crime, for example because more experienced.6. CONCLUSIONTo what extent should policy-making be decentralized in a federal system? And what arethe contrasting forces that should be considered when determining the optimal degree of decentralization?The academic debate around these crucial questions has been traditionallydominated by the fundamental trade-off between the necessity to adapt policies to local preferences,and the need to minimize possible inter-jurisdictional externalities (Oates, 1977).Any evaluation of the performance of a decentralized system, however, should also take intoaccount how effective inter-jurisdictional cooperation can make the local provision of publicgoods more effective and less costly. This aspect, however, has been largely disregarded inthe literature.This paper attempts to fill this gap by investigating the impact of horizontal inter-jurisdictionalcooperation in one policy area in which this aspect is especially important: law-enforcement.In particular we look at the context of Mexico and apply a Regression Discontinuity Design(RDD) to examine whether improved opportunities for cooperation in crime preventionamong neighboring municipalities - proxied by their degree of political alignment - facilitatescrime deterrence and results in lower crime rates. Our empirical strategy exploits thearguably exogenous discontinuity in the identity of the ruling party in a municipality givenby its victory in a close election. To estimate the causal effect of political alignment, wecompare the evolution of crime rates in municipalities where the party governing most of themunicipality’s neighbors won the election by a small margin to those in which it lost by asmall margin.We find that municipalities that are politically aligned <strong>with</strong> their neighbors experience sig-17
nificantly lower homicide rates in the years following the election. This effect is sizeable -25 to 40% reduction in murder rates - robust to various specifications and independent <strong>from</strong>the identity of the party in power in the neighboring municipalities. Furthermore, politicalalignment appears to have no impact on murder rates prior to the election, confirming thatthe treatment variable is not correlated <strong>with</strong> pre-election crime incidence. Finally, our findingsdo not provide support for alternative explanations based on the importance of politicalalignment <strong>with</strong> the ruling party at the state or federal levels further confirming the importanceof horizontal over vertical cooperation.Our research contributes to the crime literature by providing novel evidence that the effectivenessof decentralized law enforcement systems may crucially depend on the degree of interjurisdictionalcooperation that can be supported under decentralization. It also contributesto the broader debate on decentralization by raising awareness that a thorough evaluationof the costs and benefits of decentralization should not only take into account the potentialinefficiencies due to the presence of geographic spillover effects, but also the potential synergies<strong>from</strong> horizontal cooperation. Indeed, if the gains <strong>from</strong> cooperation are large enough, acentralized system which might be superior to a non-cooperative decentralized system maynot be preferred to a cooperative decentralized one. Finally, our research provides new insights<strong>with</strong> regard to the role of political parties in democratic systems by documenting howparty discipline may foster inter-jurisdictional cooperation and mitigate the inefficiencies ofpoorly designed decentralized systems.18
REFERENCESBrollo, F. and T. Nannicini (2011). Tying your ene<strong>my</strong> s hands in close races: The politics offederal transfers in brazil. IZA Discussion Paper No. 5698.Caughey, D. and J. S. Sekhon (2011). Elections and the regression discontinuity design:Lessons <strong>from</strong> close us house races, 1942–2008. <strong>Po</strong>litical Analysis 19(4), 385–408.Dal Bó, E., P. Dal Bó, and J. Snyder (2009). <strong>Po</strong>litical dynasties. Review of EconomicStudies 76(1), 115–142.Davis, D. E. (2006). Undermining the rule of law: Democratization and the dark side ofpolice reform in mexico. Latin American <strong>Po</strong>litics and Society 48(1), 55–86.Dell, M. (2011). Trafficking networks and the mexican drug war.Gonzalez-Navarro, M. (2008). Deterrence and geographical externalities in auto theft. Technicalreport, mimeo, Princeton University, Princeton.Guerrero-Gutiérrez, E. (2010). Security, drugs and violence in mexico: A survey. In SanMiguel de Allende. Prepared for the Sixth North American Forum.Guillén López, T. (2006). Democracia representativa y participativa en los municipios deméxico: Procesos en tensión. Andrew W. Selee and Leticia Santín del Río. Democraciay Ciudadanía: Participación Ciudadana y Deliberación Pública en Gobiernos LocalesMexicanos. Washington DC: Woodrow Wilson International Center for Scholars.Imbens, G. and K. Kalyanaraman (2012). Optimal bandwidth choice for the regressiondiscontinuity estimator. The Review of Economic Studies 79(3), 933–959.Imbens, G. and T. Lemieux (2008). Regression discontinuity designs: A guide to practice.Journal of Econometrics 142(2), 615–635.Inman, R. P. (2007). Federalism’s values and the value of federalism. CESifo EconomicStudies 53(4), 522–560.Inman, R. P. and D. L. Rubinfeld (1997). Rethinking federalism. The Journal of EconomicPerspectives 11(4), pp. 43–64.Knight, B. (2011). State gun policy and cross-state externalities: Evidence <strong>from</strong> crime guntracing. Technical report, National Bureau of Economic Research.Lee, D. and T. Lemieux (2009). Regression discontinuity designs in economics. Technicalreport, National Bureau of Economic Research.Lee, D., E. Moretti, and M. Butler (2004a). Do voters affect or elect policies? evidence <strong>from</strong>the us house. The Quarterly Journal of Economics 119(3), 807–859.19
Lee, D. S. (2001). The electoral advantage to incumbency and voters’ valuation of politicians’experience: A regression discontinuity analysis of elections to the us.. Technicalreport, National Bureau of Economic Research.Lee, D. S., E. Moretti, and M. J. Butler (2004b). Do voters affect or elect policies? evidence<strong>from</strong> the us house. Quarterly Journal of Economics 119(3), 807–859.Loeper, A. (2011). Coordination in heterogeneous federal systems. Journal of Public Economics.McDavid, J. C. (1974). Interjurisdictional cooperation among police departments in the st.louis metropolitan area. Publius 4(4), pp. 35–58.Oates, W. (1977). The political econo<strong>my</strong> of fiscal federalism. Lexington Books.Oates, W. (1999). An essay on fiscal federalism. Journal of economic literature 37(3),1120–1149.Ostrom, E., R. Parks, and G. Whitaker (1978). Patterns of metropolitan policing. BallingerPublishing Company.Parks, R. (2009). Metropolitan organization and police. The Practice of ConstitutionalDevelopment, eds. FilippoSabetti, BarbaraAllen, and MarkSproule-Jones. Lanham, MD:Lexington Books, 183–201.Pettersson-Lidbom, P. (2008). Do parties matter for economic outcomes? a regressiondiscontinuityapproach. Journal of the European Economic Association 6(5), 1037–1056.Sabet, D. M. (2012). <strong>Po</strong>lice reform in Mexico: informal politics and the challenge of institutionalchange. Stanford University Press.Soares, R. and I. Viveiros (2010). Organization and information in the fight against crime:An evaluation of the integration of police forces in the state of minas gerais, brazil.Tapia, J. (2009a, June). <strong>Po</strong>licías desquician calles de monterrey. El Universal.Tapia, J. (2009b). <strong>Po</strong>licías se corrompen por miedo y unas monedas. El Universal.Wheaton, W. (2006). Metropolitan fragmentation, law enforcement effort and urban crime.Journal of Urban Economics 60(1), 1–14.20
Figure 1: Total Monthly Registered Homicides in Mexico (2000-2010)3,0002,5002,000Number of Homicides1,5001,00050002000 2001 2002 2003 2004 2005 2006 2007 2008 2009 201021
Figure 2: Municipalities by Mayor’s Party Affiliation (2008)PAN PRI PRD OTHER22
Figure 3: Example of <strong>Po</strong>litical Alignment <strong>with</strong> Neighboring MunicipalityPAN PRI PRD OTHER23
Figure 4: RDD Graphical Analysis% of Municipalities <strong>with</strong> Above-Median MR During MandateFraction-.4 -.2 0 .2 .4-5 0 5Vote SpreadFigure 5: RDD Graphical Analysis% Municipalities <strong>with</strong> Above-Median MR in Previous MandateFraction-.4 -.2 0 .2 .4-5 0 5Vote Spread24
Figure 6: Distribution of Municipalities by Homicide RateDensity0 .005 .01 .015 .02Kernel Density Estimate0 200 400 600Homicideskernel = epanechnikov, bandwidth = 8.9106Election Year200620072008Table 1: Election Year by StateElection Year by StateStateAguascalientes, Campeche, Colima, Distrito Federal,Guanajuato, Jalisco, México, Morelos, Nuevo León,Querétaro, San Luis <strong>Po</strong>tosí, Sonora, TabascoBaja California, Chiapas, Chihuahua, Durango, Michoacán,Oaxaca, Puebla Sinaloa, Tamaulipas, Tlaxcala, Veracruz,Yucatán, ZacatecasBaja California Sur, Coahuila, Guerrero, Jalisco, Nayarit,Quintana Roo25
Table 2: Descriptive Statistics (Overall vs. Restricted Sample)Non Sample Sample Differencet-stat on meansdifferenceHomicide Rates Previous Mandate (per 100,000) 32.52 34.34 1.83 [0.53]Homicide Rates (pero 100,000) 39.10 45.43 6.33 [1.49]PAN affiliated winner 0.20 0.24 0.05 [1.82]*PRI affiliated winner 0.42 0.53 0.11 [3.52]***PRD affiliated winner 0.13 0.17 0.03 [1.57]PAN affiliated governor 0.15 0.13 -0.02 [0.69]PRI affiliated governor 0.69 0.68 -0.01 [0.18]PRD affiliated governor 0.16 0.19 0.02 [0.88]Majority of Neighbors PAN 0.14 0.15 0.01 [0.25]Majority of Neighbors PRI 0.51 0.77 0.26 [8.31]***Majority of Neighbors PRD 0.11 0.08 -0.03 [1.43]Majority of Neighbors not identified 0.24 0.00 -0.24 [9.33]***PAN affiliated incumbent 0.20 0.26 0.06 [2.19]**PRI affiliated incumbent 0.40 0.51 0.12 [3.75]***PRD affiliated incumbent 0.16 0.16 0.01 [0.31]Share of Local <strong>Po</strong>liticians that are Men 83.98 79.67 -4.31 [4.76]***<strong>Po</strong>pulation Density 0.00 0.00 0.00 [0.71]Area (km2) 19 20 0 [5.01]***Death Rates 569.07 546.95 -22.12 [1.71]*Infant Mortality Rate 30.47 29.88 -0.59 [1.30]Index of Human Development 0.70 0.72 0.01 [2.84]***Adult Literacy Rate 81.39 82.96 1.57 [2.08]**Percentage of HH <strong>with</strong> no sewage in 2005 9.88 12.06 2.18 [2.80]***Percentage of HH <strong>with</strong> no electricity in 2005 5.50 5.09 -0.40 [0.79]Percentage of HH <strong>with</strong> no water in 2005 17.71 16.29 -1.43 [1.13]School Attendance 60.05 59.42 -0.64 [1.59]Observations 2120 281* significant at 10%; ** significant at 5%; *** significant at 1%Municipalities' Descriptive Statistics (Means)Notes: Homicides, Death rates, the adult literacy rate, the fraction of households <strong>with</strong> access to sewage, electricity and water and the schoolattendance rate for children aged 6 to 24 were obtained <strong>from</strong> the 2005 Conteo de <strong>Po</strong>blación y Vivienda. Infant mortality rates, the human developmentindex and a variable indicating the percentage of local politicians that are women were taken <strong>from</strong> the UNDP statistics. The winner's and incumbent'sidentity was obtained <strong>from</strong> CIDAC electoral data. Total area was obtained <strong>from</strong> geographic data published by INEGI.26
Table 3: Descriptive Statistics (Restricted Sample)Restricted Sample Descriptive Statistics (Means)Party in power inMajority of neighborsLost by < 5%Party in power inMajority of neighborsWon by < 5%t-stat on meansdifferenceRD estimatet-stat on RDestimatePAN affiliated governor 0.10 0.15 [1.17]PRI affiliated governor 0.71 0.67 [0.71]PRD affiliated governor 0.19 0.18 [0.17]Majority of Neighbors PAN 0.13 0.16 [0.79] 0.06 [0.62]Majority of Neighbors PRI 0.77 0.77 [0.05] 0.04 [0.44]Majority of Neighbors PRD 0.10 0.07 [1.11] -0.09 [1.47]PAN affiliated incumbent 0.22 0.29 [1.31] 0.04 [0.39]PRI affiliated incumbent 0.49 0.53 [0.59] 0.11 [0.99]PRD affiliated incumbent 0.19 0.15 [0.98] -0.06 [0.78]Share of Local <strong>Po</strong>liticians that are Men 79.40 79.86 [0.27] 0.26 [0.08]<strong>Po</strong>pulation Density 228 201 [0.42] 105 [0.91]Area (km2) 19.81 19.68 [0.71] -0.30 [0.89]Death Rates 524 563 [2.11]** 23 [0.67]Infant Mortality Rate 30.33 29.57 [0.92] -1.02 [0.67]Index of Human Development 0.71 0.72 [1.00] 0.02 [1.00]Adult Literacy Rate 82.39 83.36 [0.68] 1.03 [0.39]Percentage of HH <strong>with</strong> no sewage in 2005 13.51 11.04 [1.44] -3.99 [1.27]Percentage of HH <strong>with</strong> no electricity in 2005 5.62 4.73 [0.90] -0.60 [0.33]Percentage of HH <strong>with</strong> no water in 2005 17.38 15.52 [0.83] -2.28 [0.55]School Attendance 59.42 59.41 [0.01] 1.14 [0.82]Observations 116 165* significant at 10%; ** significant at 5%; *** significant at 1%Notes: The RD estimate is the coefficient of the Majority Win variable in a regression of the variable in question against a linear spread on each side of thediscontinuity and state fixed effects. Death rates, the adult literacy rate, the fraction of households <strong>with</strong> access to sewage, electricity and water and the schoolattendance rate for children aged 6 to 24 were obtained <strong>from</strong> the 2005 Conteo de <strong>Po</strong>blación y Vivienda. Infant mortality rates, the human development index and avariable indicating the percentage of local politicians that are women were taken <strong>from</strong> the UNDP statistics. The incumbent's identity was obtained <strong>from</strong> CIDACelectoral data. Total area was obtained <strong>from</strong> geographic data published by INEGI.27
Table 4: Non-Parametric (local linear regression) RD EstimatesDependent Variable: Dum<strong>my</strong>=1 if homicide rates during mandate > National Median during mandateMajority WinsBandwidthOptimal* (0.5)Opt Optimal* (0.5)Opt Optimal* (0.5)Opt-0.374 -0.427 -0.375 -0.389 -0.351 -0.357[0.119]*** [0.161]*** [0.117]*** [0.159]*** [0.109]*** [0.141]***Controls A Yes Yes Yes Yes Yes YesControls B Yes Yes Yes YesControls C Yes YesStandard errors in brackets. * significant at 10%; ** significant at 5%; *** significant at 1%.Optimal bandwidth <strong>from</strong> Imbens and Kalyanaraman (2009)Controls A: state-level dummies, incumbent and winning party dummiesControls B: death rate, area, pop. density, adult literacy rate, % households <strong>with</strong> access to sewage, electricity and water, IMR, HDI.Controls C: school attendance rate for children aged 6 to 24, and share of local politicians that are women.Table 5: Non-Parametric (local linear regression) RD EstimatesDependent Variable: Dum<strong>my</strong>=1 if homicide rates previous mandate > National Median in previous mandateMajority WinsBandwidthOptimal* (0.5)Opt Optimal* (0.5)Opt Optimal* (0.5)Opt0.116 0.145 0.108 0.152 0.073 0.11[0.117] [0.152] [0.109] [0.139] [0.109] [0.142]Controls A Yes Yes Yes Yes Yes YesControls B Yes Yes Yes YesControls C Yes YesStandard errors in brackets. * significant at 10%; ** significant at 5%; *** significant at 1%.Optimal bandwidth <strong>from</strong> Imbens and Kalyanaraman (2009)Controls A: state-level dummies, incumbent and winning party dummiesControls B: death rate, area, pop. density, adult literacy rate, % households <strong>with</strong> access to sewage, electricity and water, IMR, HDI.Controls C: school attendance rate for children aged 6 to 24, and share of local politicians that are women.28
Majority WinsTable 6: Non-Parametric (local linear regression) RD EstimatesBandwidthOptimal* (0.5)Opt Optimal* (0.5)Opt Optimal* (0.5)Opt-0.730 -1.050 -0.870 -1.210 -0.780 -1.080[0.407]* [0.563]* [0.388]** [0.566]** [0.371]** [0.527]**Controls A Yes Yes Yes Yes Yes YesControls B Yes Yes Yes YesControls C Yes YesStandard errors in brackets. * significant at 10%; ** significant at 5%; *** significant at 1%.Optimal bandwidth <strong>from</strong> Imbens and Kalyanaraman (2009)Non-Parametric (local linear regression) RD EstimatesDependent Variable: Log (1 + homicide rates) during mandateControls A: state-level dummies, incumbent and winning party dummiesControls B: death rate, area, pop. density, adult literacy rate, % households <strong>with</strong> access to sewage, electricity and water, IMR, HDI.Controls C: school attendance rate for children aged 6 to 24, and share of local politicians that are women.Majority WinsTable 7: Non-Parametric (local linear regression) RD EstimatesDependent Variable: Log of 1 + homicide rates in previous mandateBandwidthOptimal* (0.5)Opt Optimal* (0.5)Opt Optimal* (0.5)Opt0.006 0.16 -0.048 -0.086 -0.083 -0.137[0.268] [0.351] [0.227] [0.292] [0.252] [0.338]Controls A Yes Yes Yes Yes Yes YesControls B Yes Yes Yes YesControls C Yes YesStandard errors in brackets. * significant at 10%; ** significant at 5%; *** significant at 1%.Optimal bandwidth <strong>from</strong> Imbens and Kalyanaraman (2009)Controls A: state-level dummies, incumbent and winning party dummiesControls B: death rate, area, pop. density, adult literacy rate, % households <strong>with</strong> access to sewage, electricity and water, IMR, HDI.Controls C: school attendance rate for children aged 6 to 24, and share of local politicians that are women.29
Table 8: OLS Regression ResultsOLS Regression ResultsDependent Variable: Dum<strong>my</strong>=1 if homicide rates during mandate > National Median(1) (2) (3) (4) (5)Majority WinsMajority Wins*Fraction MajorityMajority Wins if Majority is PANMajority Wins if Majority Governs StateMajority Wins if Majority is Incumbent-0.54[0.501]0.13[0.385]-0.139[0.174]0.033[0.198]-0.618 -0.328 -0.695 -0.55 -0.666[0.243]** [0.360] [0.243]*** [0.270]** [0.254]***Fourth Order <strong>Po</strong>lynomial Spreads Y Y Y Y YDifferential Spread Controls Y Y Y YControls A Y Y Y YControls B Y Y Y YControls C Y Y Y YConstant-1.631 -1.247 -1.697 -1.516 -1.724[1.770] [1.837] [1.805] [1.784] [1.825]Observations 281 281 281 281 281R-squared 0.46 0.46 0.46 0.46 0.47Controls A: state-level dummies, incumbent and winning party dummies. Controls B: death rate, area, pop. density, adult literacyrate, % households <strong>with</strong> access to sewage, electricity and water, IMR, HDI. Controls C: school attendance rate for children aged 6 to24, and share of local politicians that are women. Standard errors in brackets. * significant at 10%; ** significant at 5%; ***significant at 1%.30