dose-volume
dose-volume
dose-volume

You also want an ePaper? Increase the reach of your titles
YUMPU automatically turns print PDFs into web optimized ePapers that Google loves.
PAUL SCHERRER INSTITUTOverview1. Displaying and interpreting<strong>dose</strong> distributions2. Prescribing and scoring plans3. SummarySGSMP/SRO Physics Lectures 2007PD Dr Tony LomaxTreatment plan evaluation
PAUL SCHERRER INSTITUTThe display and analysis of<strong>dose</strong> distributions1. Displaying <strong>dose</strong>Methods of displaying <strong>dose</strong>Colour scalesDose bandingInteractivity2. Dose <strong>volume</strong> histogramsCalculation and interpretationDose surface histogramsProblems and pitfallsDVHs and biological modelsSGSMP/SRO Physics Lectures 2007PD Dr Tony LomaxTreatment plan evaluation
PAUL SCHERRER INSTITUTDisplaying <strong>dose</strong>The <strong>dose</strong> delivered duringa radiation treatment……is a 3-d distribution ofenergy deposited withinthe patientThe result of a treatmentplan….…is a (prediction of the)3-d distribution of energydeposited within thepatientSGSMP/SRO Physics Lectures 2007PD Dr Tony LomaxTreatment plan evaluation
PAUL SCHERRER INSTITUTDisplaying <strong>dose</strong>The display of a 3-d <strong>dose</strong>distribution in relation to thetarget <strong>volume</strong> and normalstructures is the most directand informative method ofassessing a treatment plan.All other methods ofanalysing <strong>dose</strong>distributions are surrogatesof this and involve (to alesser or greater extent) aloss of information.SGSMP/SRO Physics Lectures 2007PD Dr Tony LomaxTreatment plan evaluation
PAUL SCHERRER INSTITUTMethods of displaying <strong>dose</strong>1. Iso-<strong>dose</strong> contoursSets of closed contours linking voxels of equal <strong>dose</strong>2. Colour washThe coding of CT and <strong>dose</strong> in the same voxel throughthe modulation of both intensity (CT) and colour (<strong>dose</strong>)3. Iso-<strong>dose</strong> surfacesThe shaded surface (pseudo-3d) representation of aparticular <strong>dose</strong> level and selected VOIs.SGSMP/SRO Physics Lectures 2007PD Dr Tony LomaxTreatment plan evaluation
PAUL SCHERRER INSTITUTMethods of displaying <strong>dose</strong>Iso-<strong>dose</strong>contoursColourwashIso-<strong>dose</strong>contoursand colourwashIso-<strong>dose</strong>surfaceSGSMP/SRO Physics Lectures 2007PD Dr Tony LomaxTreatment plan evaluation
PAUL SCHERRER INSTITUTColour scalesThe gradation of colour as a function of <strong>dose</strong> value1. Continuous colour (BGR) 2. Contrasting colourSGSMP/SRO Physics Lectures 2007Clearer indication of ‘under-dosage’ withintarget <strong>volume</strong>PD Dr Tony LomaxTreatment plan evaluation
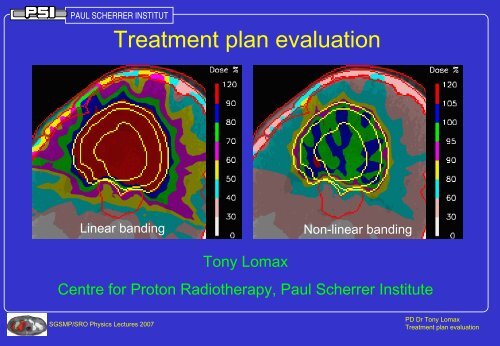
PAUL SCHERRER INSTITUTDose bandingThe mapping of <strong>dose</strong> to colours or contour levelsWide (and linear) bandingNarrow (and non-linear) bandingImproved visualisation of <strong>dose</strong>heterogeneity within PTVSGSMP/SRO Physics Lectures 2007PD Dr Tony LomaxTreatment plan evaluation
PAUL SCHERRER INSTITUTInteractivityThe ability to interact with the displayed <strong>dose</strong>1. Fast slice selection and displayFast review of full distributionSome impression of 3D nature of distribution2. Interactive <strong>dose</strong> bandingUser selection of wide/narrow,linear/non-linear bandings3. Dose queryingDisplay of <strong>dose</strong> under cursorDose statistics in user defined regionSGSMP/SRO Physics Lectures 2007PD Dr Tony LomaxTreatment plan evaluation
PAUL SCHERRER INSTITUTMulti-slice displayThe simultaneous display of many slices1. Orthogonal or obliqueslices2. Contiguous slicesSGSMP/SRO Physics Lectures 2007PD Dr Tony LomaxTreatment plan evaluation
PAUL SCHERRER INSTITUTDose <strong>volume</strong> histograms - Why?Disadvantages of 3-d<strong>dose</strong> distributions1. Huge amount ofinformation to assess2. Difficult to quantify visually3. Difficult to understandrelationship between <strong>dose</strong>and anatomy in 3-d4. Dose is itself only asurrogate for clinical outcome(Michael Goitein)Example 3-d<strong>dose</strong>distribution90 CT slices(>1.5M voxelswithin patientoutline)>500000 voxelswith non-zero <strong>dose</strong>.>60000 PTV voxels,>70000 criticalstructure voxelsSGSMP/SRO Physics Lectures 2007PD Dr Tony LomaxTreatment plan evaluation
PAUL SCHERRER INSTITUTDose <strong>volume</strong> histograms (DVH)DVHs reduce 3-d <strong>dose</strong> distributions within adefined <strong>volume</strong> of interest to simple 1-d curves.For example...Plan 1Comparative DVH’sRight globePlan 2Volume (%)Dose (%)SGSMP/SRO Physics Lectures 2007PD Dr Tony LomaxTreatment plan evaluation
PAUL SCHERRER INSTITUTCalculation and interpretationThe differential (true) histogramFrequency (<strong>volume</strong>)DoseDose distributionand defined VOIDifferential (true)histogramSGSMP/SRO Physics Lectures 2007PD Dr Tony LomaxTreatment plan evaluation
PAUL SCHERRER INSTITUTCalculation and interpretationThe cumulative <strong>dose</strong> <strong>volume</strong> ‘histogram’Frequency (<strong>volume</strong>)D meanFrequency/<strong>volume</strong>VolumeD meanDoseDifferential DVHDoseBin-by-binintegrationDoseCumulative DVHSGSMP/SRO Physics Lectures 2007PD Dr Tony LomaxTreatment plan evaluation
PAUL SCHERRER INSTITUTCalculation and interpretationInterpreting cumulative DVHsFor all DVHsFor target DVHsFor anatomy DVHsD meanWorseplanVolumeVolumeVolumeV’DoseD’Volume V’ thatreceives a <strong>dose</strong> >= D’DoseUnderdosageOverdosageBetterplanDoseSGSMP/SRO Physics Lectures 2007PD Dr Tony LomaxTreatment plan evaluation
PAUL SCHERRER INSTITUTProblems and pitfalls1. DVHs are insensitive to small ‘hot’ and ‘cold’ spots2. The shape of a DVH alone can be misleading3. DVHs can only be calculated for defined VOIsSGSMP/SRO Physics Lectures 2007PD Dr Tony LomaxTreatment plan evaluation
PAUL SCHERRER INSTITUTProblems and pitfalls1. DVHs are insensitive to small ‘hot’ and ‘cold’ spotsPlan 1 Plan 2ConsiderPlan 1Plan 2comparativeDVHs from twocompetingplansTarget <strong>volume</strong>Brain stemPosterior fossaFrom DVHs, plan2 appears to bethe best….SGSMP/SRO Physics Lectures 2007Posterior fossa…apart fromapparentlyBut this increaseinignificantcorresponds to aincrease in high105% hot spot in<strong>dose</strong> to posteriorposterior fossafossaPD Dr Tony LomaxTreatment plan evaluation
PAUL SCHERRER INSTITUTProblems and pitfalls2. The shape of a DVH alone can be misleadingConsider two target DVHs from two different casesTarget<strong>volume</strong>Case 1 41cc 5ccCase 2 1676cc 111ccCase 2Case 1Case 2Target vol
PAUL SCHERRER INSTITUTProblems and pitfalls3. DVHs can only be calculated for defined VOIs.Visual Consider inspection a set of shows DVHs the for IMRT a non-coplanar, to be unacceptableIMRT planPTVNon-coplanar IMRT planProtonIMRTLeft kidneyLiverNon-coplanar IMRT planRight kidneyFrom DVHs alone,the IMRT plan looksreasonablyfavourable incomparison to theproton plan>120% hot spot inrib in target planeSGSMP/SRO Physics Lectures 2007However….>90% hot spot in ribout of target planePD Dr Tony LomaxTreatment plan evaluation
PAUL SCHERRER INSTITUTProblems and pitfalls4. DVHs throw away all spatial informationPTVPlan 1Plan 2DVH analysis shows clearunder-dosage for plan 1,but...… it needs analysis of the<strong>dose</strong> distribution to showwhere.SGSMP/SRO Physics Lectures 2007PD Dr Tony LomaxTreatment plan evaluation
PAUL SCHERRER INSTITUTIntermediate Summary 1.Visual assessment of <strong>dose</strong> distributions• The most direct and informative representationof a treatment plan available - however….• 3-D <strong>dose</strong> distributions are large andcumbersome and difficult to analyse quantitatively• User interactivity is essential to extract the mostinformation from <strong>dose</strong> distributions (sliceselection/multi slice display, <strong>dose</strong> banding, <strong>dose</strong>querying etc).SGSMP/SRO Physics Lectures 2007PD Dr Tony LomaxTreatment plan evaluation
PAUL SCHERRER INSTITUTIntermediate Summary 2.Dose <strong>volume</strong> histograms• Provide a succinct and quantitative method ofrepresenting 3-d <strong>dose</strong> within selected VOI’s -however…• DVH’s should only be used in conjunction withcareful visual analysis of 3-d <strong>dose</strong> distributions• In particular, care should be taken whenanalysing large <strong>volume</strong>s using DVH’s• DVH’s should always be assessed inconjunction with <strong>dose</strong>-<strong>volume</strong> statistics.SGSMP/SRO Physics Lectures 2007PD Dr Tony LomaxTreatment plan evaluation
PAUL SCHERRER INSTITUTOverview1. Displaying and interpreting<strong>dose</strong> distributions2. Prescribing and scoring plans3. SummarySGSMP/SRO Physics Lectures 2007PD Dr Tony LomaxTreatment plan evaluation
PAUL SCHERRER INSTITUTThe prescription andscoring of plans1. Plan definitionPlanning criteriaProblems in strictly defining plansDefining optimisation criteria2. Scoring plansDose based scoringBiological scoringPhysical assessment of a planSGSMP/SRO Physics Lectures 2007PD Dr Tony LomaxTreatment plan evaluation
PAUL SCHERRER INSTITUTPlanning criteria1. Target coverageWhat <strong>dose</strong> is to be delivered to the targetand with what level of homogeneity?2. Normal tissue <strong>dose</strong>sWhat <strong>dose</strong>s are allowable to normal tissues?3. Plan complexityHow complex can a plan be?4. Conflict resolutionHow are conflicts between constraints 1,2 and 3 resolved?SGSMP/SRO Physics Lectures 2007PD Dr Tony LomaxTreatment plan evaluation
PAUL SCHERRER INSTITUTPlanning criteria1. Defining target coverageConsider an example target DVH in differentialformFrequency (<strong>volume</strong>)D 955%D min min95% oftargetreceives95% of<strong>dose</strong>Dose95%D maxExample criteria for targetcoverage1. Minimum <strong>dose</strong>2. Minimum <strong>dose</strong>-<strong>volume</strong>coverage3. Maximum <strong>dose</strong> spreadChoice of criteria will depend ontype of targetSGSMP/SRO Physics Lectures 2007PD Dr Tony LomaxTreatment plan evaluation
PAUL SCHERRER INSTITUTPlanning criteria2. Normal tissue <strong>dose</strong>Consider an example normal tissue DVHD meanD maxExample criteria for normal tissuesVolumeV’EUDNoThemorehomogenouslythan<strong>volume</strong>irradiatedV’ to<strong>dose</strong>receivewhich gives<strong>dose</strong>anD’equivalentbiological effectD’1. Maximum <strong>dose</strong>2. Mean <strong>dose</strong>3. Maximum or <strong>dose</strong>-<strong>volume</strong>characteristicsDose4. Biological modelsChoice of criteria will depend on type of normal tissueSGSMP/SRO Physics Lectures 2007PD Dr Tony LomaxTreatment plan evaluation
PAUL SCHERRER INSTITUTPlanning criteria3. Common Dose-Volume parametersD v –The minimum <strong>dose</strong>(%/Gy) that <strong>volume</strong> v(%/ml) of a selectedorgan receivesV95%V d –The <strong>volume</strong> (%/ml)of a selected organ thatreceives at least <strong>dose</strong> d(%/Gy)VV 505%D 95D 5DV 550%5%DSGSMP/SRO Physics Lectures 2007PD Dr Tony LomaxTreatment plan evaluation
PAUL SCHERRER INSTITUTPlanning criteria3. Common Dose-Volume parameters?Lomax et al, IJROBP, 55, 2003, 785-792SGSMP/SRO Physics Lectures 2007PD Dr Tony LomaxTreatment plan evaluation
PAUL SCHERRER INSTITUTPlanning criteria4. Homogeneity indices1 D maxis maximum<strong>dose</strong> in selectedMaxH =<strong>volume</strong>DDShaw et al, IJROBP, 27, 1993, 1231-1239DHI =P2 98×D pSGSMP/SRO Physics Lectures 2007100%D pprescription <strong>dose</strong>2 D 2, D 98<strong>dose</strong> that 2−Dand 98% of selected<strong>volume</strong> receiveWu et al, IJROBP, 56, 2003, 573-5853D( D−D)2SD i Mean×= ∑viVYoon et al, J. Clin. Med. Phys, 8, 2007, 9-17D pprescription <strong>dose</strong>D i,v i- <strong>dose</strong> and<strong>volume</strong> of voxel iD meanmean <strong>dose</strong> inwhole <strong>volume</strong>V total <strong>volume</strong>+ Simple to calculate- Misses areas ofunderdosage- Ignores shape of DVH+ Simple to calculate- Ignores shape of DVH- Difficult to calculatewithout help from TPSsystem+ Based on whole DVHPD Dr Tony LomaxTreatment plan evaluation
PAUL SCHERRER INSTITUTPlanning criteria4. Homogeneity indicesPatient H HI D SD1 1.06 2.08 0.812 1.10 10.7 2.57Patient H HI D SD6 1.16 9.1 2.009 1.09 9.1 2.33Yoon et al, J. Clin. Med.Phys, 8, 2007, 9-17Clinical relevance?SGSMP/SRO Physics Lectures 2007PD Dr Tony LomaxTreatment plan evaluation
PAUL SCHERRER INSTITUTPlanning criteria5. Conformity index1V d<strong>volume</strong> ofiso<strong>dose</strong> dVCIRTOG=VShaw et al, IJROBP, 27, 1993, 1231-1239CIV=VT,dSGSMP/SRO Physics Lectures 2007ddTV T<strong>volume</strong> of target<strong>volume</strong>2 V T,d<strong>volume</strong> of targetcovered by <strong>dose</strong> dLomax et al, IJROBP, 55, 2003, 1409-14193CNV=Vt,dTV×Vt,dvan’t Riet et al, IJROBP, 37, 1997, 731-736dV d<strong>volume</strong> ofiso<strong>dose</strong> dV T,d <strong>volume</strong> of targetcovered by <strong>dose</strong> dV d <strong>volume</strong> of iso<strong>dose</strong> dV T <strong>volume</strong> of target<strong>volume</strong>+ Simple to calculate- No check of targetcoverage- Harder to calculate- Sensitive to targetcoverage-- Most complex tocalculate+ Best combination oftarget coverage andnormal tissue <strong>dose</strong>PD Dr Tony LomaxTreatment plan evaluation
PAUL SCHERRER INSTITUTPlanning criteria5. Conformity indexLomax et al, IJROBP, 55, 2003, 1409-1419Clinical relevance?SGSMP/SRO Physics Lectures 2007PD Dr Tony LomaxTreatment plan evaluation
PAUL SCHERRER INSTITUTPlanning criteria3. Plan complexityFor many reasons, arbitrarily complex plans may notbe practicable.These include….1. Limits on the available technology2. Treatment time/patient throughput3. Clinical considerations (e.g.palliative treatments)Although rarely defined as planning criteria, suchconsiderations are implicit when designing a treatment planSGSMP/SRO Physics Lectures 2007PD Dr Tony LomaxTreatment plan evaluation
PAUL SCHERRER INSTITUTPlanning criteriaProblems in strictly defining planning criteriaExample - A multi-institutional (6 institute)treatment planning inter-comparisonDefined planning criteria...Target criteriaBoost target - 78.6 GyMain target - 68.4 GyNodes - 68.4 Gy95% PTV to becovered by 95% <strong>dose</strong>Normal tissue criteriaBrain stem - 54 GyOptic structures - 50 GyParotid gland - 35 Gy/50%Submandibular - 45 Gy/50%Physical criteria3mm setup uncertainy3% CT uncertaintySGSMP/SRO Physics Lectures 2007PD Dr Tony LomaxTreatment plan evaluation
PAUL SCHERRER INSTITUTPlanning criteriaProblems in strictly defining planning criteriaNaso-pharynx comparison results (2 from 6)Results of biological modelingPlan 1Plan 2TCP(CTV)60%60%NTCP(BS)NTCP(LOPN)0% 0%1% 8%But….Coverage of PTVin region of opticnerve deliberatelycompromised byplan 1, but not byplan 2.Plan 1Plan 2A problem of conflicting criteria. Sparing of optic nerve canonly be achieved by compromising defined safety margin.SGSMP/SRO Physics Lectures 2007PD Dr Tony LomaxTreatment plan evaluation
PAUL SCHERRER INSTITUTPlanning criteria4. Conflict resolutionIn many cases, it may not be possible to satisfy both targetcoverage and normal tissue constraints with any one plan.In this case, additional constraints relating to how suchconflicts should be dealt with are required.Examples….1. Target coverage has priority (plan 2)Plan 12. Normal tissues have priority (plan 1)3. Compromise solution based onweighting factors for different VOIs(e.g. using biological models?)Plan 24. ‘Optimised’ solution.SGSMP/SRO Physics Lectures 2007PD Dr Tony LomaxTreatment plan evaluation
PAUL SCHERRER INSTITUTOptimisation criteriaPlan optimisation is a method by which a plan’s characteristics areadjusted automatically (by computer) to fulfill the defined planspecifications (e.g. IMRT).Such algorithms fall into two broad groups:1. Physical optimisationOptimisation uses <strong>dose</strong> based specifications.E.g. max <strong>dose</strong>, min <strong>dose</strong>, <strong>dose</strong>-to-<strong>volume</strong> etc.2. Biological optimisationOptimisation uses clinically relevantspecifications. E.g. TCP, NTCP or Probability ofNon-Complicated Tumour Control (P+).SGSMP/SRO Physics Lectures 2007PD Dr Tony LomaxTreatment plan evaluation
PAUL SCHERRER INSTITUTOptimisation criteriaPro’s and con’s1. Physical optimisationPro’s: Flexible (multiple constraints easily defined)Transparent (resultant <strong>dose</strong> is directly related to constraints)Con’s: Large number of optimisation parametersDose is only surrogate of clinical outcome2. Biological optimisationPro’s: Optimisation cirteria can be reduced to single value(?)Clinically relevant definition of problemCon’s: Inflexible (need different models for different end points)Validity of models suspect for most organsAn ‘optimised’ plan can only ever be as good as the planningconstraints used as input to the optimisation processSGSMP/SRO Physics Lectures 2007PD Dr Tony LomaxTreatment plan evaluation
PAUL SCHERRER INSTITUTOptimisation criteriaWhat is optimal? An example9 intensity-modulatedbeams, evenly spacedover 360 0Consider a comparison of intensity modulatedprotons (IMPT) and X-rays (IMXT)...Nominal IMPTNominal IMXT3 Target VolumesGross <strong>volume</strong>: 76GySubclinical: 66GyMicroscopic: 54GyNominal constraintsOptic nerves < 56GyBrainstem < 53GyEyes < 50GyBoth plans calculated with exactly the sameconstraints, but clear differences in <strong>dose</strong>sSGSMP/SRO Physics Lectures 2007PD Dr Tony LomaxTreatment plan evaluation
PAUL SCHERRER INSTITUTOptimisation criteriaWhat is optimal? An exampleRight globeRelative <strong>volume</strong>(%)IMPTIMXT 1Single <strong>dose</strong> weightingfunctionOptimisation makesno attempt to reduce<strong>dose</strong>s below constraint(zero weight)Dose (%)What happens when we use a <strong>dose</strong>-<strong>volume</strong> constraint toattempt to match IMXT DVH to IMPT (nominal) DVH?SGSMP/SRO Physics Lectures 2007PD Dr Tony LomaxTreatment plan evaluation
PAUL SCHERRER INSTITUTOptimisation criteriaWhat is optimal? An exampleRight globeIMXT plan 1 IMXT plan 2Relative <strong>volume</strong>(%)Dose (%)IMPTIMXT 1IMXT 2Significantly reduced<strong>dose</strong> in globe throughuse of stricterconstraint…The quality of an ‘optimised’ plan depends on thedefined constraints..at cost of slightlydecreased targethomogeneitySGSMP/SRO Physics Lectures 2007PD Dr Tony LomaxTreatment plan evaluation
PAUL SCHERRER INSTITUTOptimisation criteriaWhat is optimal? An exampleIMXT plan 1Two ‘optimised’ X-ray plans, with twoquite different <strong>dose</strong>distributions.Which is optimal, oreven, which is best?IMPT planIMXT plan 2SGSMP/SRO Physics Lectures 2007PD Dr Tony LomaxTreatment plan evaluation
PAUL SCHERRER INSTITUTScoring plans.1. Dose based scoringScore plans based on predicted <strong>dose</strong>s tothe target and normal tissues2. Biological scoringScore plan based on predicted clinical outcome(control and complication probabilities)3. Physical assessmentThe assessment of a plan’s sensitivity toset-up errors and motions.SGSMP/SRO Physics Lectures 2007PD Dr Tony LomaxTreatment plan evaluation
PAUL SCHERRER INSTITUTDose based scoringThe ‘gold’ standard forassessing and ranking a plan?Possible score functions1. Visual assessment of the 3-d<strong>dose</strong> distribution2. Visual assessment of DVHs3. Quantitative analysis of <strong>dose</strong>distributions (conformity index,homogeneity index etc)4. Quantitative analysis of DVHs(max, min, <strong>dose</strong>-to-<strong>volume</strong> etc)SGSMP/SRO Physics Lectures 2007PD Dr Tony LomaxTreatment plan evaluation
PAUL SCHERRER INSTITUTDose based scoring.Problems with <strong>dose</strong> based scoringVisual assessmentsdifficult to quantify.RectumPlan 12 hasbettersparing ofrectum...Many, oftenconflicting indicesrequired to fullycharacterise a planOr.. E.g.PTV…but …AND worsebetter targettarget coveragecoverageConflicting indices difficult to resolvewithout knowledge of underlying biologySGSMP/SRO Physics Lectures 2007PD Dr Tony LomaxTreatment plan evaluation
PAUL SCHERRER INSTITUTBiological scoring.Plan scoring based on biologicalindices such as TCP and NTCPAdvantages1. Clinically relevant scoringfunction2. Small number of indices requiredto characterise plan3. In theory, can be reduced tosingle quality figure (P+)SGSMP/SRO Physics Lectures 2007PD Dr Tony LomaxTreatment plan evaluation
PAUL SCHERRER INSTITUTBiological scoring.E.G Lyman’s model for NTCP(Lyman LY, Wolbarst B, Int. J. Radiat. Oncol. Biol. Phys, 13:103-109 1987)A 3 parameter model – TD 50 Dose to whole organ resulting in50% probability of complicationm Gradient of response curve at TD 50n ‘Volume’ parametermv=1v=0.6n ≈ 1(Parallelorgan)v=1n ≈ 0(Serialorgan)NTCPTD 50nv=0.3NTCPv=0.6v=0.3DoseDoseSGSMP/SRO Physics Lectures 2007PD Dr Tony LomaxTreatment plan evaluation
PAUL SCHERRER INSTITUTBiological scoring.E.G The Equivalent Uniform Dose (EUD) model(Wu et al, Int. J. Radiat. Oncol. Biol. Phys, 52:224-235, 2002)EUD⎛ 1= ⎜ ∑⎝ N iEUDaD i⎞⎟⎠1aThe homogenouslyirradiated <strong>dose</strong>which would givean equivalentbiological effectSingle parameter model (a)that can be used for bothtumours and critical organsa = 1 EUD ≡ mean <strong>dose</strong>a >> 1 EUD -> min/max <strong>dose</strong>For tumours -> a < 0For OAR’s -> a > 0E.g.Prostate carcinoma a ≈ -10Rectum a ≈ 6SGSMP/SRO Physics Lectures 2007PD Dr Tony LomaxTreatment plan evaluation
PAUL SCHERRER INSTITUTBiological scoring.Reasons to be cautious.1. Validity of the biological parameters.Consider two competingDVHs for the rectumRectumPlan 1Plan 2Apply Lyman’s NTCPmodel with standard<strong>volume</strong> parameter n=0.12(Emami and Burman)Plan 1 - 10.4%Plan 2 - 24.2%Apply Lyman’s NTCPmodel with modified<strong>volume</strong> parameter n=0.2Plan 1 - 8.4%Plan 2 - 7.1%Ranking of plan changes for even a moderate change of a singleinput parameterSGSMP/SRO Physics Lectures 2007PD Dr Tony LomaxTreatment plan evaluation
PAUL SCHERRER INSTITUTBiological scoring.Reasons to be cautious.2. Normalising to low NTCP values.Consider a set of <strong>dose</strong>-response curves for the rectum with the estimatedNTCPs for 60 and 80 Gy varied by +/- 5%Variation in NTCP5 dependingon response curve usedNTCP (%)Dose (cGy)55 - 68 GyIf TCP curve is well separatedfrom NTCP curve, such anuncertainty can result in muchlarger uncertainties in TCPestimationTCP 20 - 80 % in this case!SGSMP/SRO Physics Lectures 2007PD Dr Tony LomaxTreatment plan evaluation
PAUL SCHERRER INSTITUTBiological scoring.Reasons to be cautious.1. Validity of the biological parameters.2. Normalising to low NTCP values.3. NTCP models usually defined for singleand most severe end-pointsTreatment related pathologies can includea whole spectrum of end-points and effects4. The combination of NTCPs and TCP into asingle value (P+) must be viewed with suspicionHow can a 5% increase in probability of aspinal cord transection be balancedagainst a 5% increase in TCP?SGSMP/SRO Physics Lectures 2007PD Dr Tony LomaxTreatment plan evaluation
PAUL SCHERRER INSTITUTPhysical assessment.The assessment of the practicalities of treatment delivery1. Plan complexityLimits on the available technologyTreatment time/patient throughputClinical considerations (e.g. palliative treatments)2. Safety of deliverySensitivity of plan to set-up errorsSensitivity of plan to dynamic variations (e.gorgan motion)SGSMP/SRO Physics Lectures 2007PD Dr Tony LomaxTreatment plan evaluation
PAUL SCHERRER INSTITUTPhysical assessment.Sensitivity of a plan to set-up errorsThe definition of an Internal Target Volume (toaccount for motion) and a Planning Target Volume(to account for set-up errors) will not necessarilyaccount for these effects in the case of dynamicallyapplied or intensity modulated treatmentsE.g. Protons, IMRT etc.SGSMP/SRO Physics Lectures 2007PD Dr Tony LomaxTreatment plan evaluation
PAUL SCHERRER INSTITUTPhysical assessment.Sensitivity of an IM plan to set-up errors- An exampleA three field, intensity modulated proton planField 3Field 1 Field 2CombineddistributionSGSMP/SRO Physics Lectures 2007PD Dr Tony LomaxTreatment plan evaluation
PAUL SCHERRER INSTITUTSet-up error analysisRecalculate <strong>dose</strong> for spatiallyshifted CT data setsE.g. shift CT +/- 5mm alongeach major axisPhysical assessment.Sensitivity of an IM plan to set-up errors- An example5mm setup errors(‘worst’ case distribution)CTVResult - 6 (or more) ‘error’<strong>dose</strong> distributions>5% cold spotswithin CTVSGSMP/SRO Physics Lectures 2007PD Dr Tony LomaxTreatment plan evaluation
PAUL SCHERRER INSTITUTPhysical assessment.Sensitivity of a 9 field IMRT plan to possibleintra-fraction errorsZ=63NominalWorst-case distribution for 5mmintra-fraction errors5mmSGSMP/SRO Physics Lectures 2007PD Dr Tony LomaxTreatment plan evaluation
PAUL SCHERRER INSTITUTSummary.Plan definition.1. Plans should be defined as strictly aspossible, especially when doingcomparisons2. The method of resolving conflictsbetween criteria can greatly effect planranking and analysis3. An ‘optimised’ plan is only as good as it’sinput parameters.SGSMP/SRO Physics Lectures 2007PD Dr Tony LomaxTreatment plan evaluation
PAUL SCHERRER INSTITUTSummary.Plan scoring.1. Dose based assessment is the ‘goldstandard’, but can be difficult to quantify2. Biological scores give succinct results,but must always be interpreted with greatcaution3. For dynamic and IMRT plans, thedefinition of safety margins to account formotion and set-up errors is NOT sufficient.SGSMP/SRO Physics Lectures 2007PD Dr Tony LomaxTreatment plan evaluation