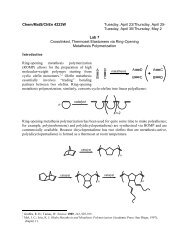
Chem/MatS/ChEn 4223W Tuesday, April 2/Thursday, April 4 ...
Chem/MatS/ChEn 4223W Tuesday, April 2/Thursday, April 4 ...
Chem/MatS/ChEn 4223W Tuesday, April 2/Thursday, April 4 ...

Create successful ePaper yourself
Turn your PDF publications into a flip-book with our unique Google optimized e-Paper software.
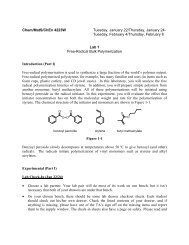
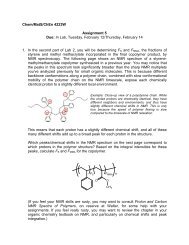
<strong>Chem</strong>/<strong>MatS</strong>/<strong>ChEn</strong> <strong>4223W</strong>Lab 6 Appendix AProcessing DSC Data with TA Instruments Advantage (Thermal)It may help to read Assignment 18 before following these instructions.In this lab, you will be analyzing your DSC data using Advantage (Thermal), a software packagethat accompanies the TA Instruments Q1000 DSC. This software has already been installed oncomputers in the Microcomputer Lab (Smith 101D), but you can also install it on your owncomputer, as long as it runs a Windows operating system.To install the software on your own computer:Go to the TA Instruments Advantage software download page (http://tinyurl.com/taadv), andclick on “Advantage Software v5.4.0” to download the installation .exe file.Run the downloaded file to install the software. You can do this automatically by clicking acheck box during the download (“Run this file after download”), or by finding the file onyour computer after it is downloaded. During installation, as you follow the prompts, thewizard will give you the choice of two “setup types”: Complete or Custom. I recommend youchoose Custom, and then choose only to install “Universal Analysis” in the next window.The program will finish by placing “TA Universal Analysis” shortcuts on the desktop andStart menu.To use the software to analyze your DSC data:Download your data files from the course website to your local computer. The files are textfiles, although they may not have “.txt” for a suffix.Open the Advantage software. Open one of your data files by choosing File → Open or theicon. The program will display information about your sample; if you see anything thatneeds to be corrected (e.g., the mass of your sample), do it in this window.Your DSC thermograms will be displayed in the main window, with the “endotherm up”—that is, with the vertical axis inverted so that negative heat flow values (where heat is put intothe system) are up and positive values are down. If your run involves multiple passes, it willshow all of them. You can toggle which runs are visible in Edit → Cycle List. if you areanalyzing a peak or feature from a specific pass, it may help to toggle the others off.To zoom in on a particular region of the spectrum, select Rescale → Manual…, and enter theaxis boundaries you would like to focus on. To return to the full spectrum, select Rescale →Zoom Out.To analyze a glass transition,o Select Analyze → Glass transition.