DarboeLIST OF REFERENCESAlbaret et al. 1987. <strong>Fish</strong> communities <strong>in</strong> <strong>The</strong> Casamance River (Senegal). Dur<strong>in</strong>g adrought period. Rev.Hydrobiology trop.20 (3-4):291-310.Albaret J.J., 1994. Les poissons : biologie et peuplements. In: Dur<strong>and</strong> J.R., Dufour P.,Guiral D., Zabi S.G. (Eds.), Environnement et ressources aquatiques de Côte d'Ivoire.Tome 2. Les milieux lagunaires. ORSTOM, Paris, pp. 239-279.Baklashova T.A. 1980. Ictiologia, biologia y ecologia mar<strong>in</strong>as. Pishevayapromyshliennostj. Libro, Ruso.http://www.<strong>in</strong>foryba.com/modules.php?op=modload&name=Publications&file=<strong>in</strong>dex&p_op=showcontent&secid=7&pnid=1136566810Baran, E. 2000. Biodiversity of Estuar<strong>in</strong>e <strong>Fish</strong> Faunas <strong>in</strong> West Africa. <strong>The</strong> ICLARMquarterly (vol.23 no. 4Cameron, W. M. <strong>and</strong> D. W. Pritchard (1963) Estuaries. In M. N. Hill (editor): <strong>The</strong>Sea vol. 2, John Wiley <strong>and</strong> Sons, New York, 306 – 324Diouf P.S., 1996, Les peuplements de poissons des milieux estuariens d'Afrique del'Ouest : l'exemple de l'estuaire hyperhal<strong>in</strong> du S<strong>in</strong>e-Saloum. Thèses et Documentsmicrofiches No. 156, ORSTOM, Paris.Food <strong>and</strong> Agriculture Organization (FAO) 1996. An Ecological framework for mar<strong>in</strong>efisheries <strong>in</strong>vestigations: <strong>Fish</strong>eries Technical paper 283Hopk<strong>in</strong>son C.S. Jr <strong>and</strong> Hoffman F.A. 1983. “<strong>The</strong> Estuary Extended – A recipient-System Study of Estuar<strong>in</strong>e Outwell<strong>in</strong>g <strong>in</strong> Georgia,” <strong>The</strong> Estuary as a Filter, V.S.Kennedy ed, Academic Press, Orl<strong>and</strong>o, Fl. Pp. 313-327.Izrael Yu. A. 1991. USSR: Climate Change Impact Study: IPCC Work<strong>in</strong>g Group IIReport.Jallow, B.P. 1995. Identification of <strong>and</strong> response to drought by local communities <strong>in</strong>Fulladu West District, <strong>The</strong> <strong>Gambia</strong>. S<strong>in</strong>gapore Journal of Tropical Geography, 16(1),22-41.Macpherson, E., et. al. 2001. Biomass size of littoral <strong>Fish</strong>es <strong>in</strong> Protected <strong>and</strong>Unprotected Areas <strong>in</strong> Northwest MediterraneanMott <strong>and</strong> MacDonald International. 1992. Hydrological Assessment of West AfricanCountries, Country Report: <strong>The</strong> <strong>Gambia</strong>.Perk<strong>in</strong>s, E.J. 1974. Department of Biology , University of Strathclyde, Scotl<strong>and</strong>.Young G.C <strong>and</strong> Palter I.C. 2001. Influence of exceptionally high Sal<strong>in</strong>ities, Markedvariations <strong>in</strong> freshwater Discharge <strong>and</strong> openn<strong>in</strong>g of <strong>estuary</strong> Mouth on thecharacteristics of the Ichthyofauna of a normally-closed <strong>estuary</strong>.UNU – <strong>Fish</strong>eries Tra<strong>in</strong><strong>in</strong>g Programme 30
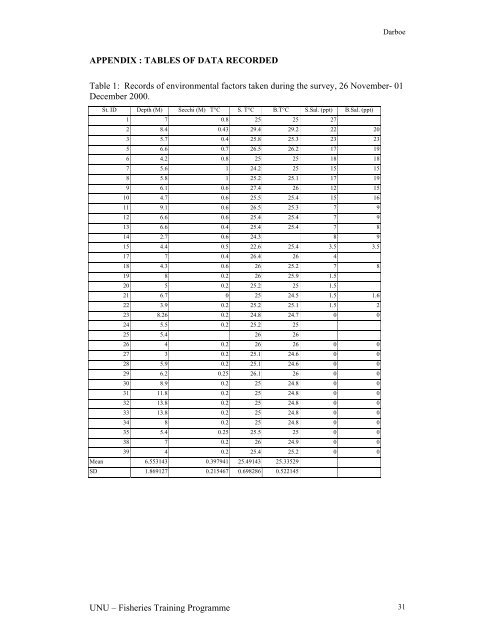
DarboeAPPENDIX : TABLES OF DATA RECORDEDTable 1: Records of environmental factors taken dur<strong>in</strong>g the survey, 26 November- 01December 2000.St. ID Depth (M) Secchi (M) T°C S. T°C B.T°C S.Sal. (ppt) B.Sal. (ppt)1 7 0.8 25 25 272 8.4 0.43 29.4 29.2 22 203 5.7 0.4 25.8 25.3 23 235 6.6 0.7 26.5 26.2 17 196 4.2 0.8 25 25 18 187 5.6 1 24.2 25 15 158 5.8 1 25.2 25.1 17 199 6.1 0.6 27.4 26 12 1510 4.7 0.6 25.5 25.4 15 1611 9.1 0.6 26.5 25.3 7 912 6.6 0.6 25.4 25.4 7 913 6.6 0.4 25.4 25.4 7 814 2.7 0.6 24.3 8 915 4.4 0.5 22.6 25.4 3.5 3.517 7 0.4 26.4 26 418 4.3 0.6 26 25.2 7 819 8 0.2 26 25.9 1.520 5 0.2 25.2 25 1.521 6.7 0 25 24.5 1.5 1.622 3.9 0.2 25.2 25.1 1.5 223 8.26 0.2 24.8 24.7 0 024 5.5 0.2 25.2 2525 5.4 26 2626 4 0.2 26 26 0 027 3 0.2 25.1 24.6 0 028 5.9 0.2 25.1 24.6 0 029 6.2 0.25 26.1 26 0 030 8.9 0.2 25 24.8 0 031 11.8 0.2 25 24.8 0 032 13.8 0.2 25 24.8 0 033 13.8 0.2 25 24.8 0 034 8 0.2 25 24.8 0 035 5.4 0.25 25.5 25 0 038 7 0.2 26 24.9 0 039 4 0.2 25.4 25.2 0 0Mean 6.553143 0.397941 25.49143 25.33529SD 1.869127 0.215467 0.698286 0.522145UNU – <strong>Fish</strong>eries Tra<strong>in</strong><strong>in</strong>g Programme 31