The use of MIXED models in the analysis of animal.pdf - Esalq
The use of MIXED models in the analysis of animal.pdf - Esalq
The use of MIXED models in the analysis of animal.pdf - Esalq

Create successful ePaper yourself
Turn your PDF publications into a flip-book with our unique Google optimized e-Paper software.
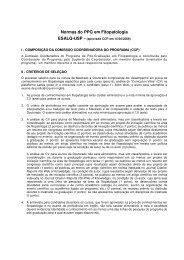
2 CANADIAN JOURNAL OF ANIMAL SCIENCEajustées aux critères d’<strong>in</strong>formation bayésiens d’Akaike et Schwarz. Il procure donc le meilleur ajustement. On estime que lesvaleurs F, la valeur estimative des mo<strong>in</strong>dres carrés et l’erreur-type reposant sur le modèle ANTE (1) sont celles qui conviennentle mieux parmi les c<strong>in</strong>q modèles exam<strong>in</strong>és. Les auteurs préconisent le modèle mixte pour analyser les mesures répétitives dans lesétudes sur les animaux.Mots clés: Mesures répétitives, modèle l<strong>in</strong>éaire général, modèle mixte, dispositif en tiroir, structure de la covarianceCan. J. Anim. Sci. Downloaded from pubs.aic.ca by CAPES M<strong>in</strong> da Educacao - Brazil on 05/31/12For personal <strong>use</strong> only.<strong>The</strong> repeated measures experiment is a common design <strong>in</strong><strong>animal</strong> science research (Goonewardene et al. 2000; ZoBellet al. 2003), and <strong>the</strong> <strong>analysis</strong> refers to multiple measurementsmade on <strong>the</strong> same experimental unit, observed ei<strong>the</strong>rover time or space. In repeated measures designs, <strong>the</strong> usualpractice is to apply treatments to experimental units <strong>in</strong> acompletely randomized design and measurements are madesequentially over time. With this type <strong>of</strong> experimentaldesign, <strong>the</strong>re are basically two fixed effects (treatment andtime) and two sources <strong>of</strong> random variation (between andwith<strong>in</strong> <strong>animal</strong>s). Some <strong>of</strong> <strong>the</strong> more common designs <strong>in</strong> <strong>animal</strong>sciences <strong>in</strong>clude repeated measurements <strong>of</strong> such th<strong>in</strong>gsas weight, ga<strong>in</strong>, blood parameters, and products <strong>of</strong> metabolismand digestibility <strong>of</strong> nutrients. Such measurements arecommonly taken on subjects which have been randomlyallocated to fixed treatment effects such as feeds, drugs, hormones,etc., with pens or blocks considered as randomeffects <strong>in</strong> <strong>the</strong> design (Silvia et al. 1995; Wells and Preston1998; Goonewardene et al. 2000; Platter et al. 2003).Sometimes a repeated measures <strong>analysis</strong> can be comb<strong>in</strong>edwith a Lat<strong>in</strong> square design and analyzed as a split-plot withmultiple error terms (SAS/STAT 1990; Yandell 1997).Often, measurements made on <strong>the</strong> same <strong>animal</strong> are morelikely to be correlated than two measurements taken on different<strong>animal</strong>s, and two measurements taken closer <strong>in</strong> time on <strong>the</strong>same <strong>animal</strong> are likely to be more correlated than measurementstaken fur<strong>the</strong>r apart <strong>in</strong> time. <strong>The</strong> basic objectives forrepeated measures data are to exam<strong>in</strong>e simple factor effects(ma<strong>in</strong> effects) and <strong>the</strong> <strong>in</strong>teraction effects between <strong>the</strong>m. <strong>The</strong>dist<strong>in</strong>guish<strong>in</strong>g characteristic <strong>of</strong> <strong>the</strong> repeated measurements<strong>analysis</strong> model from o<strong>the</strong>r <strong>models</strong> is <strong>the</strong> assumption about <strong>the</strong>error variance and covariance structure (Wolf<strong>in</strong>ger 1996; Littellet al. 1996; 1998; Templeman et al. 2002). With <strong>the</strong> repeatedmodel, <strong>the</strong> usual assumptions about error variances be<strong>in</strong>g <strong>in</strong>dependentand homogeneous are no longer valid (Wolf<strong>in</strong>ger1996; Littell et al. 2000; SAS Institute, Inc. 2002). <strong>The</strong> <strong>analysis</strong><strong>of</strong> repeated measures data <strong>the</strong>refore requires an appropriateaccount<strong>in</strong>g for correlations between <strong>the</strong> observations made on<strong>the</strong> same subject and possible heterogeneous variances amongobservations on <strong>the</strong> same subject over time.Objective and FocusA scan <strong>of</strong> Volume 82 (2002) <strong>of</strong> <strong>the</strong> Canadian Journal <strong>of</strong> AnimalScience shows that repeated measures analyses have been <strong>use</strong>d<strong>in</strong> 25 papers. Many authors <strong>use</strong>d <strong>the</strong> GLM procedure <strong>in</strong> SAS toanalyze <strong>the</strong>ir data although some <strong>use</strong>d <strong>the</strong> <strong>MIXED</strong> model witha repeated statement. While <strong>the</strong> GLM procedure may havebeen appropriate to <strong>use</strong> <strong>the</strong>n, <strong>the</strong> <strong>MIXED</strong> procedure <strong>of</strong> SAS isa more robust and flexible procedure for <strong>the</strong> <strong>analysis</strong> <strong>of</strong> suchdata (Cnaan et al. 1997; SAS Institute, Inc.1997; Littell et al.1998; Templeman et al. 2002). However, it appears that unfamiliaritywith mixed model methodology and PROC <strong>MIXED</strong>limits its <strong>use</strong>. <strong>The</strong> objective <strong>of</strong> this paper is to provide a m<strong>in</strong>imalbackground understand<strong>in</strong>g <strong>of</strong> <strong>the</strong> mixed model <strong>in</strong> repeatedmeasures <strong>analysis</strong> <strong>in</strong> <strong>animal</strong> science by us<strong>in</strong>g steer data from agrowth study, and to demonstrate <strong>the</strong> <strong>use</strong> <strong>of</strong> PROC <strong>MIXED</strong> <strong>of</strong><strong>the</strong> SAS system. <strong>The</strong> focus <strong>of</strong> this paper is on how to <strong>use</strong> PROC<strong>MIXED</strong> to analyze balanced repeated measures data from <strong>the</strong><strong>use</strong>r’s po<strong>in</strong>t <strong>of</strong> view. <strong>The</strong> <strong>use</strong> <strong>of</strong> PROC <strong>MIXED</strong> to analyzeunbalanced repeated measures data will be discussed <strong>in</strong> ano<strong>the</strong>rpaper. Detailed <strong>the</strong>oretical treatments and descriptions aboutmixed model methodology are provided by o<strong>the</strong>r authors(Wolf<strong>in</strong>ger 1996; Cnaan et al. 1997; SAS Institute, Inc.1997;Littell et al. 2000). <strong>The</strong> general approach discussed <strong>in</strong> this paperis divided <strong>in</strong>to two parts; <strong>the</strong> first part attempts to estimate <strong>the</strong>variance and covariance, <strong>the</strong> second part attempts to substitutevariance and covariance estimates <strong>in</strong>to <strong>the</strong> mixed model and<strong>use</strong> generalized least squares methodology to assess significancefor fixed effects.Data for IllustrationData from a steer growth trial published by Mir et al. (1998)are <strong>use</strong>d to demonstrate mixed model methodology and analyzerepeated measures data. In this experiment, six diets(1–6) were randomly assigned to 60 steers, with 10 steersper diet, over 105 d. Body weights were measured every 21d (3 wk) at 0 (INWT = 237 ± 17 kg), 21, 42, 63, 84 and105 d (end). <strong>The</strong>se will be referred to as time 0, 1, 2, 3, 4,and 5 throughout this paper. <strong>The</strong>se data were analyzed byus<strong>in</strong>g PROC <strong>MIXED</strong> with start body weight measured at 0-d as a covariate, and <strong>the</strong> subsequent weights as repeatedmeasures <strong>in</strong> <strong>the</strong> analyses. Five commonly <strong>use</strong>d covariance<strong>models</strong>, SIMPLE, CS, AR(1), ANTE(1) and UN, were fittedto <strong>the</strong> steer growth data. However, <strong>the</strong>re are many covariancestructures that are available <strong>in</strong> <strong>the</strong> <strong>MIXED</strong> procedure,and a list <strong>of</strong> <strong>the</strong> available covariance structures can be foundon <strong>the</strong> SAS onl<strong>in</strong>e documentation for Version 8.1.STATISTICAL METHODOLOGY<strong>The</strong> approaches <strong>use</strong>d <strong>in</strong> repeated measures analyses can becategorized as conventional and modern. <strong>The</strong> conventionalapproach <strong>use</strong>s PROC GLM <strong>in</strong> <strong>the</strong> SAS system and <strong>the</strong>analyses are done us<strong>in</strong>g ei<strong>the</strong>r a univariate <strong>analysis</strong> <strong>of</strong> variance(ANOVA) or a multivariate <strong>analysis</strong> <strong>of</strong> variance(MANOVA), and are <strong>of</strong>ten referred as <strong>the</strong> split-plot <strong>in</strong> timeand <strong>the</strong> <strong>analysis</strong> <strong>of</strong> contrasts respectively (Littell et al. 1991;Wolf<strong>in</strong>ger 1992). <strong>The</strong> mixed model approach <strong>use</strong>s mixedmodel methodology or PROC <strong>MIXED</strong> <strong>in</strong> <strong>the</strong> SAS system.<strong>The</strong> advantages, limitations, strengths and weaknesses <strong>of</strong>conventional analyses as well as <strong>the</strong> mixed model methodare summarized <strong>in</strong> Fig. 1. Some <strong>of</strong> <strong>the</strong>se attributes will bediscussed fur<strong>the</strong>r <strong>in</strong> subsequent sections.
WANG AND GOONEWARDENE — <strong>MIXED</strong> MODELS FOR REPEATED DATA 3Can. J. Anim. Sci. Downloaded from pubs.aic.ca by CAPES M<strong>in</strong> da Educacao - Brazil on 05/31/12For personal <strong>use</strong> only.Fig. 1. A summary <strong>of</strong> <strong>the</strong> advantages and limitations <strong>of</strong> <strong>the</strong> conventional and mixed model approaches for <strong>the</strong> <strong>analysis</strong> <strong>of</strong> repeated data.Conventional ApproachesUnivariate Analysis <strong>of</strong> Variance<strong>The</strong> univariate <strong>analysis</strong> <strong>of</strong> variance <strong>of</strong> <strong>the</strong> repeated measuresdata can be performed us<strong>in</strong>g PROC GLM with <strong>the</strong> follow<strong>in</strong>gSAS code. Assume that <strong>the</strong> repeated data set was namedSTEERS associated with <strong>the</strong> libname IN. <strong>The</strong> first 10 observations<strong>of</strong> STEERS are provided <strong>in</strong> Table 1. <strong>The</strong>re are manyways to br<strong>in</strong>g data sets <strong>in</strong>to <strong>the</strong> SAS system from o<strong>the</strong>r databaseapplications for statistical <strong>analysis</strong> and details canei<strong>the</strong>r be found <strong>in</strong> <strong>the</strong> SAS onl<strong>in</strong>e documentation or o<strong>the</strong>rsources (Cody and Smith 1991; Littell et al. 1998).PROC GLM DATA=IN.STEERS;CLASS DIET TIME ANIM;MODEL FNWT=DIET ANIM(DIET) TIME DIET*TIME;RANDOM ANIM(DIET)/TEST;RUN;QUIT;This type <strong>of</strong> <strong>analysis</strong> has been <strong>use</strong>d commonly <strong>in</strong> <strong>animal</strong>research experiments for many years (Goonewardene 1990;Milliken and Johnson 1992). <strong>The</strong> <strong>analysis</strong> basically treats <strong>the</strong>repeated measures data as split-plot design, where <strong>the</strong> experimentalunits regard<strong>in</strong>g treatments are considered as <strong>the</strong> wholeplotunits, while <strong>the</strong> experimental units at a specific time areconsidered as <strong>the</strong> sub-plot or split-plot units. It is worth not<strong>in</strong>gthat <strong>the</strong> <strong>animal</strong> assigned to a diet is specified as a RANDOMeffect <strong>in</strong> <strong>the</strong> above code <strong>in</strong> order to carry out a correct F-test.<strong>The</strong> /TEST option <strong>in</strong> <strong>the</strong> RANDOM statement performshypo<strong>the</strong>sis tests for <strong>the</strong> effects specified <strong>in</strong> <strong>the</strong> model statementwith appropriate error terms as determ<strong>in</strong>ed by <strong>the</strong> expectedmean squares. <strong>The</strong> statistical model <strong>use</strong>d for this <strong>analysis</strong> isdef<strong>in</strong>ed <strong>in</strong> Eq. 1:Table 1. <strong>The</strong> first 10 observations <strong>of</strong> <strong>the</strong> example data set STEERSDIET ANIM TIME INWT z FNWT y4 61 1 266 2854 61 2 266 3134 61 3 266 3304 61 4 266 3444 61 5 266 3721 62 1 212 2351 62 2 212 2511 62 3 212 2601 62 4 212 2721 62 5 212 282z Initial body weight at <strong>the</strong> beg<strong>in</strong>n<strong>in</strong>g <strong>of</strong> <strong>the</strong> trial.y F<strong>in</strong>al body weight at <strong>the</strong> end <strong>of</strong> <strong>the</strong> trial.y ijt= µ + α i+ d j(i)+ γ t+ (αγ) it+ e ijt(1)where:y ijtis <strong>the</strong> live body weight measured at time t on <strong>the</strong> jth steerassigned to <strong>the</strong> ith diet,µ is <strong>the</strong> overall mean effect,α iis <strong>the</strong> ith fixed diet effect,d j(i)is <strong>the</strong> random effect <strong>of</strong> <strong>the</strong> jth steer with<strong>in</strong> <strong>the</strong> ith diet,d j(i)~ NID(0, σ d 2 ) (approximately normally <strong>in</strong>dependentlydistributed with mean <strong>of</strong> 0 and variance <strong>of</strong> σ d 2 ),γ t is <strong>the</strong> fixed tth time effect when <strong>the</strong> measurement was taken,(γα) itis <strong>the</strong> fixed <strong>in</strong>teraction effect between diet and time,e ijtis <strong>the</strong> random error associated with <strong>the</strong> jth steer assignedto <strong>the</strong> ith diet at time t, e ijt~ NID(0, σ e 2 ) (approximately normally<strong>in</strong>dependently distributed with mean <strong>of</strong> 0 and variance<strong>of</strong> σ e 2 ).Assum<strong>in</strong>g d j(i)and e ijtare <strong>in</strong>dependent.E (y ijt) = µ + α i+ γ t+ (αγ) it
WANG AND GOONEWARDENE — <strong>MIXED</strong> MODELS FOR REPEATED DATA 5Can. J. Anim. Sci. Downloaded from pubs.aic.ca by CAPES M<strong>in</strong> da Educacao - Brazil on 05/31/12For personal <strong>use</strong> only.data than <strong>the</strong> MANOVA. <strong>The</strong>refore, <strong>the</strong> mixed modelapproach is considered superior to <strong>the</strong> conventionalapproaches. In addition, with an appropriate covariancestructure specified, <strong>the</strong> <strong>MIXED</strong> procedure <strong>use</strong>s GLS toestimate and test <strong>the</strong> fixed effects <strong>in</strong> <strong>the</strong> model, which isconsidered superior to <strong>the</strong> OLS method <strong>use</strong>d by <strong>the</strong> GLMprocedure (SAS Institute, Inc. 1999). <strong>The</strong> GLS procedurecan account for all <strong>of</strong> <strong>the</strong> covariance parameters modeledfor <strong>the</strong> data whereas OLS cannot. Beca<strong>use</strong> <strong>of</strong> this, <strong>the</strong>mixed model <strong>analysis</strong> is more precise and <strong>the</strong>refore recommended,although assess<strong>in</strong>g an appropriate covariancestructure for <strong>the</strong> data is not easy.Statistical Model for <strong>the</strong> Example Data<strong>The</strong> statistical model for <strong>the</strong> mixed model <strong>analysis</strong> <strong>in</strong> <strong>the</strong>example data set can be def<strong>in</strong>ed as:y ijt= µ + α i+ d j(i)+ γ t+ (αγ) it(b + ϕ j) x ij+ e ijt(3)where:b is <strong>the</strong> common regression coefficient <strong>of</strong> <strong>in</strong>itial weight <strong>of</strong> x ij,ϕ iis <strong>the</strong> slope deviation <strong>of</strong> <strong>the</strong> ith diet from <strong>the</strong> commonslope b,x ijis <strong>the</strong> <strong>in</strong>itial body weight measure <strong>of</strong> steer j on diet i at <strong>the</strong>beg<strong>in</strong>n<strong>in</strong>g <strong>of</strong> <strong>the</strong> study and <strong>the</strong> rema<strong>in</strong><strong>in</strong>g terms are <strong>the</strong> sameas <strong>in</strong> Eq. 1.E (y it) = µ + α i+ γ t+ (αγ) it+ (b + ϕ j) x ij(4)Cov (y ijt,y i′j′t′) = V ijwhere, V ijis a block diagonal covariance matrix for eachsubject j with diet i. <strong>The</strong> V ijcan take many different formsdepend<strong>in</strong>g on <strong>the</strong> nature <strong>of</strong> <strong>the</strong> repeated measure data.Commonly Used Covariance Structures for <strong>the</strong>Repeated Measures ModelMixed Model Analysis with a SIMPLE CovarianceStructure<strong>The</strong> SIMPLE covariance structure assumes that all observationsare <strong>in</strong>dependent <strong>of</strong> each o<strong>the</strong>r and <strong>the</strong>re is no correlation(covariance) between any pair <strong>of</strong> observations, evenbetween <strong>the</strong> repeated measures on <strong>the</strong> same subject. <strong>The</strong>SIMPLE structure has an equal variance σ 2 on <strong>the</strong> ma<strong>in</strong>diagonal and 0 elsewhere <strong>in</strong> <strong>the</strong> covariance matrix and isexpressed as:⎡ 2σ⎢Vij = ⎢⎢⎢⎣⎢Symmetric0 L 0 ⎤2 ⎥σ L 0 ⎥O M ⎥⎥2σ ⎦⎥This structure is considered simple beca<strong>use</strong> only a s<strong>in</strong>gleparameter estimate is required. This is <strong>the</strong> covariance structureassumed <strong>in</strong> <strong>the</strong> standard fixed model <strong>analysis</strong> <strong>of</strong> variance.However, <strong>the</strong> SIMPLE covariance structure is seldomtrue with repeated measures data.(5)Mixed Model Analysis with CS CovarianceStructure<strong>The</strong> compound symmetry refers to equal variances (σ d 2 +σ e 2 ) on<strong>the</strong> ma<strong>in</strong> diagonal and equal covariances (σ d) on all <strong>of</strong>f diagonals.This structure is <strong>the</strong> simplest correlated covariance structurefor repeated measures data s<strong>in</strong>ce it assumes a constantcorrelation between observations regardless <strong>of</strong> <strong>the</strong> distancebetween time po<strong>in</strong>ts. This is essentially <strong>the</strong> same as <strong>the</strong> univariateANOVA (split-plot <strong>in</strong> time) <strong>analysis</strong>, which was <strong>use</strong>dfor many years <strong>in</strong> <strong>the</strong> past. <strong>The</strong> CS structure requires two parameters,<strong>the</strong> between subject (σ d 2 ) and <strong>the</strong> with<strong>in</strong>-subject (σ e 2 )variance estimates. <strong>The</strong> covariance matrix is expressed as:⎡ 2 2σd + σe σd L σ ⎤d⎢2 2⎥Vd + e dij =⎢σ σ L σ ⎥⎢O M ⎥⎢⎥2 2⎣⎢Symmetricσd+ σe⎦⎥<strong>The</strong> CS covariance structure is only appropriate when <strong>the</strong> socalledHuynh-Feldt condition is met, that is equal correlationbetween measures on <strong>the</strong> same subject (Huynh and Feldt 1970,1976). However, <strong>the</strong> HF condition is also seldom true withrepeated measures beca<strong>use</strong> <strong>the</strong> time-dependent correlationsmost likely exist with repeated measures data. If <strong>the</strong> HF conditionis not met, o<strong>the</strong>r covariance structures should be pursued.Mixed Model Analysis with AR(1) CovarianceStructure<strong>The</strong> first-order autoregressive covariance structure assumes <strong>the</strong>correlation between adjacent measures is ρ, regardless <strong>of</strong> <strong>the</strong>order <strong>of</strong> <strong>the</strong> adjacent pairs such as 1st and 2nd, 2nd and 3rd, andso on. It also assumes that <strong>the</strong> correlation for any pair <strong>of</strong> observationsthat are measured n units apart have a correlation <strong>of</strong> ρ n .<strong>The</strong> correlation between observations is a function <strong>of</strong> distance<strong>in</strong> time. In addition, it assumes equal variances σ 2 on <strong>the</strong> ma<strong>in</strong>diagonal and <strong>the</strong> variance times <strong>the</strong> correspond<strong>in</strong>g correlationson <strong>the</strong> <strong>of</strong>f diagonals <strong>of</strong> covariance matrix, and is expressed as:⎡ 1⎢Vij = 2σ ⎢⎢⎢⎣⎢Symmetric2 3ρ ρ ρ ⎤2 ⎥1 ρ ρ ⎥1 ρ ⎥⎥1 ⎦⎥In <strong>the</strong> AR(1) structure, s<strong>in</strong>ce <strong>the</strong> correlations are <strong>in</strong>creas<strong>in</strong>g <strong>in</strong>power as distances <strong>in</strong>crease between pairs <strong>of</strong> observations, <strong>the</strong>correspond<strong>in</strong>g covariances decrease. <strong>The</strong> AR(1) structurerequires equally spaced times, and time must be ordered correctlyand <strong>the</strong> structure needs only two parameter estimates. Ifunequally spaced time po<strong>in</strong>ts are present, one should considero<strong>the</strong>r covariance structures such as SP(POW).Mixed Model Analysis with ANTE(1) CovarianceStructure<strong>The</strong> first-order ante dependence covariance structure allowsunequal variances over time and unequal correlations and(6)(7)
6 CANADIAN JOURNAL OF ANIMAL SCIENCECan. J. Anim. Sci. Downloaded from pubs.aic.ca by CAPES M<strong>in</strong> da Educacao - Brazil on 05/31/12For personal <strong>use</strong> only.covariance among different pairs <strong>of</strong> measurements. <strong>The</strong> magnitude<strong>of</strong> <strong>the</strong> covariance depends on <strong>the</strong> values <strong>of</strong> both <strong>the</strong> correlationsand standard deviations associated with <strong>the</strong>m. <strong>The</strong>covariance matrix is expressed as:⎡ σ ⎤1 2 σσρ 1 2 1 σσρρ 1 3 1 2 σσρρρ 1 4 1 2 3⎢2⎥Vij = ⎢σ2σ2σ3ρ2 σ2σ4ρ2ρ3⎥(8)⎢σ σ σ ρ ⎥⎢3 2 3 4 3 ⎥2⎣⎢Symmetricσ4⎦⎥This structure requires t + (t – 1) parameter estimates wheret is <strong>the</strong> number <strong>of</strong> times repeated. With this structure, timeperiods must be ordered correctly but equal spac<strong>in</strong>g betweentimes is not necessary.Mixed Model Analysis with UN Structure<strong>The</strong> unstructured covariance structure allows unequal variancesover time and unequal covariances for each time comb<strong>in</strong>ation.This is <strong>the</strong> most complex structure and t(t – 1)/2parameters need to be estimated where t is <strong>the</strong> same asdef<strong>in</strong>ed <strong>in</strong> Eq. 8, and expressed as:⎡ σ ⎤1 2 σ12 σ13 σ14⎢2⎥Vij = ⎢σ2σ23 σ24⎥⎢σ σ ⎥⎢3 2 34 ⎥2⎣⎢Symmetricσ4⎦⎥This covariance structure is modeled by <strong>the</strong> MANOVA repeatedmeasures <strong>analysis</strong>. Beca<strong>use</strong> <strong>of</strong> <strong>the</strong> complexity <strong>of</strong> <strong>the</strong> UNstructure, it is generally more difficult to fit. A smaller data setwith many repeated observations on one subject may fail toconverge. As <strong>the</strong> UN structure estimates many parameters(over parameterization), it may waste a considerable amount <strong>of</strong><strong>in</strong>formation <strong>in</strong> <strong>the</strong> data and result <strong>in</strong> less powerful tests.MODEL DEVELOPMENTLittell et al. (2000) recommended <strong>the</strong> follow<strong>in</strong>g steps forselect<strong>in</strong>g an appropriate covariance structure <strong>in</strong> <strong>the</strong> <strong>analysis</strong><strong>of</strong> repeated measures data us<strong>in</strong>g PROC <strong>MIXED</strong>:(a) Model <strong>the</strong> mean structure (<strong>the</strong> model expectation) byspecify<strong>in</strong>g <strong>the</strong> fixed effects <strong>in</strong> <strong>the</strong> model to fit <strong>the</strong> repeatedmeasures data. At this step, try to fit all possible fixedeffects <strong>in</strong> <strong>the</strong> mean model, test for <strong>the</strong> significance and <strong>the</strong>nreduce <strong>the</strong> model to obta<strong>in</strong> a desirable mean model us<strong>in</strong>gPROC GLM.(b) Specify a closer covariance structure for between andwith<strong>in</strong>-subject effects. Usually, <strong>the</strong> covariance for <strong>the</strong> with<strong>in</strong>-subjectmeasurements can be complex for repeated measuresdata, but generally assumes that <strong>the</strong> repeated measureswith<strong>in</strong> subjects are correlated and between subjects are <strong>in</strong>dependent.<strong>The</strong>refore, most <strong>of</strong> <strong>the</strong> time, <strong>the</strong> with<strong>in</strong>-subjectcovariance is a block diagonal matrix with one block persubject. <strong>The</strong>n specify an appropriate covariance structure <strong>in</strong>each block. <strong>The</strong> guidel<strong>in</strong>es on how to specify an appropriate(9)covariance structure are discussed <strong>in</strong> <strong>the</strong> next section. <strong>The</strong>details <strong>of</strong> available covariance structures can be found <strong>in</strong>SAS help Version 8 under PROC <strong>MIXED</strong>: REPEATEDStatement – TYPE = option.(c) Use <strong>the</strong> covariance structure identified <strong>in</strong> step b and fit<strong>the</strong> mean model us<strong>in</strong>g <strong>the</strong> <strong>MIXED</strong> procedure <strong>in</strong> SAS. Thisaccounts for <strong>the</strong> covariance <strong>in</strong> <strong>the</strong> data, which <strong>the</strong> preced<strong>in</strong>gGLM <strong>analysis</strong> <strong>in</strong> step a did not. In this step, one may be ableto fur<strong>the</strong>r reduce <strong>the</strong> mean model to obta<strong>in</strong> a more parsimoniousmodel based on <strong>the</strong> tests for <strong>the</strong> fixed effects and <strong>the</strong>model fit statistics <strong>in</strong>formation criteria. <strong>The</strong> model fit statisticswill be discussed subsequently.(d) Based on <strong>the</strong> results obta<strong>in</strong>ed <strong>in</strong> step c, make statistical<strong>in</strong>ferences and draw conclusions about <strong>the</strong> <strong>analysis</strong> based on<strong>the</strong> objectives <strong>of</strong> <strong>the</strong> study.Specification <strong>of</strong> an Appropriate CovarianceStructureA model with an appropriate covariance structure for <strong>the</strong> with<strong>in</strong>-subjectcorrelation is essential to arrive at an accurate conclusion<strong>in</strong> a repeated measures <strong>analysis</strong>. Ignor<strong>in</strong>g <strong>the</strong> importantwith<strong>in</strong>-subject correlation by us<strong>in</strong>g a model that is too simplewill <strong>in</strong>crease <strong>the</strong> Type I error rate for fixed effect tests <strong>in</strong> <strong>the</strong><strong>analysis</strong>, while too complicated a model will lead to a sacrifice<strong>in</strong> test power and <strong>the</strong> efficiency <strong>of</strong> tests for <strong>the</strong> fixed effects. Ithas been shown that <strong>in</strong>ference <strong>in</strong> <strong>the</strong> repeated measures <strong>analysis</strong>can be severely compromised by a poor choice <strong>of</strong> covariance<strong>models</strong> (Wolf<strong>in</strong>ger 1996; Guer<strong>in</strong> et al. 2000). Although<strong>the</strong> true covariance structure for a particular dataset is seldomknown, an approximately correct covariance model must bespecified <strong>in</strong> order to obta<strong>in</strong> a valid <strong>analysis</strong>.<strong>The</strong> first th<strong>in</strong>g one should do is to exclude <strong>the</strong> covariancestructures that clearly make no sense to <strong>the</strong> data before start<strong>in</strong>gto select a covariance structure. In general, <strong>the</strong> SIMPLE covariancestructure may not be an appropriate choice for repeatedmeasures data; equal time spac<strong>in</strong>g covariance structures, suchas AR(1), should not be considered for unequally time-spaceddata; homogeneous covariance structures, such as AR(1),should be ruled out if <strong>the</strong> data show heterogeneous variancesover time. After rul<strong>in</strong>g out some <strong>of</strong> covariance structures thatclearly make no sense to <strong>the</strong> data, <strong>the</strong>se steps should be followedto select an appropriate covariance structure for <strong>the</strong> data.(a) Try to run <strong>the</strong> UN covariance structure first to exam<strong>in</strong>e<strong>the</strong> pattern <strong>of</strong> <strong>the</strong> covariance matrix <strong>of</strong> <strong>the</strong> data. <strong>The</strong> pattern<strong>of</strong>ten suggests a simpler covariance structure that may fit <strong>the</strong>data better. <strong>The</strong> UN is <strong>the</strong> most complex structure and itmay fail to converge for smaller data sets with many repeatedmeasures on a s<strong>in</strong>gle subject. When <strong>the</strong> UN model failsto converge, <strong>the</strong>n analyze <strong>the</strong> data us<strong>in</strong>g <strong>the</strong> MANOVA procedureand <strong>the</strong>n look at <strong>the</strong> correlation matrix provided by<strong>the</strong> MANOVA <strong>analysis</strong>. <strong>The</strong> pattern <strong>of</strong> <strong>the</strong> correlationmatrix could provide a h<strong>in</strong>t for a simpler more appropriatecovariance structure that fits <strong>the</strong> data.(b) Based on <strong>the</strong> pattern obta<strong>in</strong>ed from <strong>the</strong> above <strong>analysis</strong>,<strong>the</strong> biology <strong>of</strong> <strong>the</strong> study and experimental knowledge about
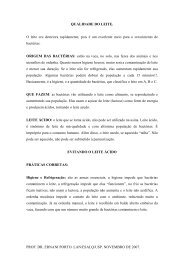
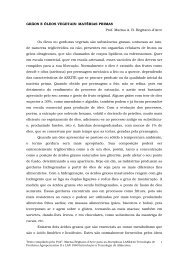
WANG AND GOONEWARDENE — <strong>MIXED</strong> MODELS FOR REPEATED DATA 7Can. J. Anim. Sci. Downloaded from pubs.aic.ca by CAPES M<strong>in</strong> da Educacao - Brazil on 05/31/12For personal <strong>use</strong> only.your data, a few covariance structures that appear to be reasonablefor <strong>the</strong> data may be tried.(c) Compare <strong>the</strong> model fitt<strong>in</strong>g statistics <strong>in</strong>formation from <strong>the</strong>above runs <strong>of</strong> different <strong>models</strong>, and <strong>the</strong>n select <strong>the</strong> modelthat best fits <strong>the</strong> data. In general, a simpler covariance structurethat best fits to <strong>the</strong> data should be chosen.Model ComparisonA comparison <strong>of</strong> candidate <strong>models</strong> can be achieved by runn<strong>in</strong>g<strong>the</strong> PROC <strong>MIXED</strong> procedure with various covariancestructures. <strong>The</strong> <strong>in</strong>formation criteria provided by PROC<strong>MIXED</strong> can be <strong>use</strong>d as a statistical tool to assist <strong>in</strong> <strong>models</strong>election. Three <strong>in</strong>formation criteria are provided <strong>in</strong> SASversion 8.1 and <strong>the</strong>y are <strong>the</strong> Akaike Information Criteria(AIC), <strong>the</strong> f<strong>in</strong>ite-sample corrected Akaike InformationCriteria (AICC) and <strong>the</strong> Schwarz’s Bayesian InformationCriteria (BIC). <strong>The</strong> value <strong>of</strong> <strong>in</strong>formation criteria closest tozero <strong>in</strong>dicates a better model fit to <strong>the</strong> data (SAS Institute,Inc. 1999). As its name implies, AICC is a f<strong>in</strong>ite-samplecorrected AIC for small samples, and it reduces <strong>the</strong> bias thatresults from AIC. With large samples, <strong>the</strong> AICC convergesto <strong>the</strong> AIC. In general, AICC is preferred to AIC. <strong>The</strong> BICtends to choose a simpler model than AIC beca<strong>use</strong> it<strong>in</strong>creases <strong>the</strong> penalties, as <strong>the</strong> number <strong>of</strong> parametersrequired <strong>in</strong> <strong>the</strong> model <strong>in</strong>creases. As suggested above, when<strong>the</strong> model becomes too simple, it tends to <strong>in</strong>flate <strong>the</strong> Type Ierror rate. <strong>The</strong>refore, when Type I error control is critical <strong>in</strong><strong>the</strong> study, AICC should be <strong>use</strong>d. On <strong>the</strong> o<strong>the</strong>r hand, if a testpower is <strong>the</strong> major concern, <strong>the</strong>n BIC may be preferable. Ingeneral, for repeated measure <strong>analysis</strong>, among plausiblewith<strong>in</strong>-subject covariance <strong>models</strong> for a particular study, <strong>the</strong>model that m<strong>in</strong>imizes ei<strong>the</strong>r AICC or BIC is preferable.When AICC and BIC values are close, <strong>the</strong>n <strong>the</strong> simplercovariance model is generally preferred.ANALYZING THE EXAMPLE DATA USINGTHE <strong>MIXED</strong> MODEL<strong>The</strong> Data Pr<strong>of</strong>iles<strong>The</strong> <strong>in</strong>dividual body weights were plotted aga<strong>in</strong>st time, andfor clarity, data from only 17 <strong>of</strong> <strong>the</strong> steers are shown <strong>in</strong> Fig.2. A close exam<strong>in</strong>ation <strong>of</strong> Fig. 2 reveals (a) a fann<strong>in</strong>g shapeover time, which provides evidence that variation <strong>in</strong> bodyweight is <strong>in</strong>creas<strong>in</strong>g as weight <strong>in</strong>creases. As such a constantvariance over time is no longer a valid assumption, and heterogeneousvariance is <strong>the</strong> reality, (b) with<strong>in</strong> <strong>the</strong> study period,as each steer’s growth pr<strong>of</strong>ile approximates a l<strong>in</strong>earrelationship over time, it <strong>in</strong>dicates that a l<strong>in</strong>ear model is likelyto be appropriate, and (c) larger or smaller steers tend torema<strong>in</strong> larger or smaller dur<strong>in</strong>g <strong>the</strong> entire trial, and this <strong>in</strong>dicatesa clear subject-to-subject variability <strong>in</strong> steer growthover time. Also, measures on <strong>the</strong> same <strong>animal</strong> are likely tobe more closely correlated than measures taken from different<strong>animal</strong>s. Two measures taken on <strong>the</strong> same <strong>in</strong>dividual arepositively correlated beca<strong>use</strong> <strong>the</strong>y possess common effectsfrom <strong>the</strong> same <strong>animal</strong>. Hence, a l<strong>in</strong>ear mixed model with anappropriate covariance structure can be expected to accommodate<strong>the</strong>se features exhibited by <strong>the</strong> data.<strong>The</strong> diet means for body weight over <strong>the</strong> trial period areshown <strong>in</strong> Fig 3. <strong>The</strong> diet means for body weights are similarat <strong>the</strong> start <strong>of</strong> <strong>the</strong> study, but <strong>the</strong> magnitude <strong>of</strong> differencesamong <strong>the</strong> diets beg<strong>in</strong>s to differentiate over time. For example,<strong>the</strong> magnitude <strong>of</strong> <strong>the</strong> difference between diets 1 and 3is small at <strong>the</strong> beg<strong>in</strong>n<strong>in</strong>g (day 0) but large at <strong>the</strong> end(day 105), whereas, between 1 and 4, <strong>the</strong> largest differenceappears at time 2 and <strong>the</strong> difference at time 5 and 6 is virtuallyabsent. Figure 3 <strong>in</strong>dicates that a general conclusionabout diet means cannot be made <strong>in</strong>dependent <strong>of</strong> time. Inorder to make a comparison <strong>of</strong> <strong>the</strong> diets, appropriate estimates<strong>of</strong> <strong>the</strong> differences between treatment means at differenttimes and <strong>of</strong> <strong>the</strong> differences between means for <strong>the</strong> sametreatment at different times would be <strong>in</strong>terest<strong>in</strong>g and should<strong>the</strong>refore be considered.Exam<strong>in</strong>ation <strong>of</strong> <strong>the</strong> Covariance StructureA prelim<strong>in</strong>ary <strong>analysis</strong> showed that <strong>the</strong> with<strong>in</strong> diet, regression<strong>of</strong> INWT on FNWT was not significant (P > 0.05), <strong>the</strong>refore acommon slope for diets was <strong>use</strong>d <strong>in</strong> <strong>the</strong> subsequent <strong>analysis</strong>.Table 3 was obta<strong>in</strong>ed by fitt<strong>in</strong>g Eq. 3 with a UN covariancestructure to <strong>the</strong> example data. <strong>The</strong> variances are on <strong>the</strong> diagonal,correlations and covariances between repeated measuresare shown above and below <strong>the</strong> diagonal, respectively (Table3). It appears that <strong>the</strong> variances <strong>in</strong>crease over time (heterogeneous)and <strong>the</strong> correlations with<strong>in</strong> <strong>the</strong> same subject decreaseover time. It can also be seen that covariances or correlationsbetween adjacent measurements on <strong>the</strong> same steer are morecorrelated at later time periods than at earlier times. For example,<strong>the</strong> covariance and correlation between adjacent measurements<strong>of</strong> time 4 and 5 are 162.87 and 0.92, respectively, whichare much larger than <strong>the</strong>ir correspond<strong>in</strong>g covariance and correlationbetween adjacent measurements <strong>of</strong> 30.02 and 0.58 attimes 1 and 2. <strong>The</strong>refore, <strong>the</strong> conventional ANOVA method <strong>of</strong><strong>analysis</strong> for repeated data is not justified. Hence, a mixed l<strong>in</strong>earmodel with heterogeneous and correlated covariance structureshould be considered for <strong>the</strong>se data.Fitt<strong>in</strong>g Different Covariance ModelsIn order to illustrate <strong>the</strong> advantages <strong>of</strong> us<strong>in</strong>g mixed model<strong>analysis</strong> over <strong>the</strong> conventional approaches, <strong>the</strong> same data setwas fitted to five different covariance structures [SIMPLE, CS,AR(1), ANTE(1) and UN]. <strong>The</strong> SAS code given below is forPROC <strong>MIXED</strong> with a simple covariance structure. <strong>The</strong> SIM-PLE covariance structure is <strong>the</strong> default option for TYPE =options <strong>in</strong> <strong>the</strong> <strong>MIXED</strong> procedure. Also, SIMPLE is <strong>the</strong> covariancestructure assumed <strong>in</strong> <strong>the</strong> standard fixed model ANOVA.O<strong>the</strong>r covariance <strong>models</strong> [CS, AR(1), ANTE(1) and UN] canbe <strong>in</strong>voked by simply replac<strong>in</strong>g <strong>the</strong> SIMPLE <strong>in</strong> <strong>the</strong> ‘TYPE =’options with CS, AR(1) ANTE(1), or UN covariance structures.To <strong>use</strong> <strong>the</strong> covariance structures available <strong>in</strong> <strong>the</strong> SAS systemo<strong>the</strong>r than those listed above, one just needs to replace <strong>the</strong>SIMPLE <strong>in</strong> <strong>the</strong> ‘TYPE =’ option with your choice <strong>of</strong> 31 availablecovariance structures that can be found <strong>in</strong> <strong>the</strong> onl<strong>in</strong>e documentation<strong>of</strong> SAS version 8.1./* <strong>MIXED</strong> MODEL APPROACH - ANALYSIS THE STEERGROWTH DATA */PROC <strong>MIXED</strong> DATA=IN STEERS COVTEST;
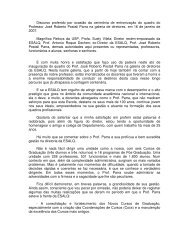
8 CANADIAN JOURNAL OF ANIMAL SCIENCECan. J. Anim. Sci. Downloaded from pubs.aic.ca by CAPES M<strong>in</strong> da Educacao - Brazil on 05/31/12For personal <strong>use</strong> only.Fig. 2. Tri-weekly body weight pr<strong>of</strong>iles <strong>of</strong> 17 steers dur<strong>in</strong>g a 105-d growth study. (Only part <strong>of</strong> <strong>the</strong> data are shown.)Fig. 3. Tri-weekly average body weight pr<strong>of</strong>iles <strong>of</strong> steers on six diets dur<strong>in</strong>g a 105-d growth trial.Table 3. <strong>The</strong> covariance and correlation matrix z obta<strong>in</strong>ed by fitt<strong>in</strong>g <strong>the</strong>UN structure for <strong>the</strong> example data set STEERSTIME 1 2 3 4 51 34.30 0.58 0.53 0.49 0.382 30.02 77.27 0.86 0.81 0.753 34.06 82.41 120.15 0.90 0.854 34.90 86.14 118.72 146.36 0.925 32.67 95.66 136.40 162.87 213.19z Variances along <strong>the</strong> diagonal, covariances are <strong>in</strong> <strong>the</strong> lower triangle andcorrelations are <strong>in</strong> <strong>the</strong> upper triangle.CLASS ANIM DIET TIME;MODEL FNWT = DIET | TIME INWT / DDFM=KR;REPEATED TIME / SUBJECT=ANIM (DIET) TYPE = SIMPLER RCORR;RUN;QUIT;<strong>The</strong> fit statistics for <strong>the</strong> five <strong>models</strong> are presented <strong>in</strong> Table4. <strong>The</strong> AICC and BIC values for <strong>the</strong> ANTE(1) covariancemodel are both smaller than <strong>the</strong> correspond<strong>in</strong>g AICC andBIC for <strong>the</strong> rest <strong>of</strong> <strong>the</strong> covariance <strong>models</strong>. We can concludethat <strong>the</strong> ANTE(1) covariance model provides <strong>the</strong> best fit to<strong>the</strong> data among <strong>the</strong> five <strong>models</strong> selected and is <strong>the</strong>refore <strong>the</strong>model <strong>of</strong> choice.Table 4. Model fit statistics z with five different covariance structuresfor <strong>the</strong> example data set STEERSCovariance structures yFit statistics x SIMPLE CS AR(1) ANTE(1) UN-2 Log likelihood 2103.7 1940.4 1852.6 1798.4 1791.0AIC 2105.7 1944.4 1856.6 1816.4 1821.0AICC 2105.7 1944.4 1856.6 1817.1 1822.9BIC 2107.8 1948.6 1860.8 1835.2 1852.5z A smaller model fit statistic value <strong>in</strong>dicates a better fit to <strong>the</strong> data.y SIMPLE = simple, CS = compound symmetry, AR(1) = first order autoregressive,ANTE(1) = ante dependence, UN = unstructured.x AIC = Akaike <strong>in</strong>formation criterion, AICC = f<strong>in</strong>ite sample correctedAkaike <strong>in</strong>formation criterion, BIC = Schwarz’s Bayesian <strong>in</strong>formationcriterion.Test <strong>of</strong> <strong>the</strong> Fixed Effects for <strong>the</strong> Five-covarianceModelsOne may choose to request tests for fixed effects and specific<strong>in</strong>teractions. In this example, DIET, TIME and <strong>in</strong>teraction<strong>of</strong> DIET × TIME were requested. Table 5 presents <strong>the</strong>value <strong>of</strong> F-tests <strong>of</strong> <strong>the</strong> fixed effects computed by <strong>the</strong><strong>MIXED</strong> procedure for <strong>the</strong> five-selected covariance <strong>models</strong>.<strong>The</strong> values <strong>of</strong> <strong>the</strong> F-test are similar for <strong>the</strong> ANTE(1) and UN<strong>models</strong>, which happen to fit <strong>the</strong> data better than SIMPLE,CS and AR(1) (Table 4). On <strong>the</strong> o<strong>the</strong>r hand, <strong>the</strong> F values differsubstantially for SIMPLE, CS and AR(1) <strong>models</strong>, whichdid not provide a good fit to <strong>the</strong> data. <strong>The</strong> failure <strong>of</strong> SIMPLEmodel to recognize between steer variations resulted <strong>in</strong>excessively large F values for DIET and INWT, and <strong>the</strong>seare both <strong>animal</strong> effects. <strong>The</strong> CS model gives essentially <strong>the</strong>same result that would be obta<strong>in</strong>ed with <strong>the</strong> univariateANOVA. This model produces excessively large F values
WANG AND GOONEWARDENE — <strong>MIXED</strong> MODELS FOR REPEATED DATA 9Table 5. F test <strong>of</strong> fixed effects for five covariance structures z for <strong>the</strong> example data set STEERSEffect SIMPLE CS AR(1) ANTE(1) UNDIET 43.9** 11.91** 11.2** 11.37** 11.34**TIME 402.91** 1181.76** 604.96** 399.79** 417.98**DIET*TIME 1.88 * 5.51** 3.25** 2.91** 3.22**INWT 1174.12** 318.54** 317.97** 477.5** 444.54**z SIMPLE = simple, CS = compound symmetry, AR(1) = first order autoregressive, ANTE(1) = ante dependence, UN = unstructured.* F-test significant at <strong>the</strong> 0.05 level.** F-test significant at <strong>the</strong> 0.01 level.Can. J. Anim. Sci. Downloaded from pubs.aic.ca by CAPES M<strong>in</strong> da Educacao - Brazil on 05/31/12For personal <strong>use</strong> only.Table 6. Least square mean estimates (EST) and standard errors (SE) <strong>of</strong> six diets from five covariance <strong>models</strong> z for <strong>the</strong> example data set STEERSSIMPLE CS AR(1) ANTE(1) UNDiet EST SE EST SE EST SE EST SE EST SE1 280.23 1.4706 280.23 2.8235 280.23 2.9076 280.23 2.9824 280.23 2.97922 287.23 1.4741 287.23 2.8302 287.26 2.9142 286.68 2.9853 286.73 2.98233 304.33 1.4733 304.33 2.8286 304.31 2.9126 304.81 2.9846 304.77 2.98164 279.88 1.4717 279.88 2.8255 279.89 2.9096 279.57 2.9833 279.6 2.98025 291.29 1.4706 291.29 2.8235 291.29 2.9076 291.31 2.9825 291.31 2.97926 298.09 1.4720 298.09 2.8261 298.08 2.9102 298.44 2.9836 298.41 2.9805z SIMPLE = simple, CS = compound symmetry, AR(1) = first order autoregressive, ANTE(1) = ante dependence, UN = unstructured. All estimates (EST) aresignificant at <strong>the</strong> 0.01 level.for TIME and DIET by TIME <strong>in</strong>teraction effects. This is acommon problem when apply<strong>in</strong>g <strong>the</strong> CS model to analyzerepeated measures data, as <strong>the</strong> HF condition is not met. <strong>The</strong>F value for TIME that results from AR(1) model is large dueto <strong>the</strong> fact that AR(1) model failed to account for <strong>the</strong> correlationsbetween measures observed on <strong>the</strong> same <strong>animal</strong> fur<strong>the</strong>rapart <strong>in</strong> time and <strong>the</strong> heterogeneous variances overtime. <strong>The</strong> F values based on <strong>the</strong> ANTE(1) and UN <strong>models</strong>are similar beca<strong>use</strong> both <strong>models</strong> are adequately model<strong>in</strong>g<strong>the</strong> covariance <strong>of</strong> <strong>the</strong> data and <strong>the</strong>refore result <strong>in</strong> valid tests.However, <strong>the</strong> ANTE(1) has <strong>the</strong> lowest AICC and BIC fitstatistics and hence is <strong>the</strong> model <strong>of</strong> choice from among <strong>the</strong>five <strong>models</strong> tested.Effect <strong>of</strong> Covariance Structures on Least SquareMeans for Fixed EffectsLeast square means can be obta<strong>in</strong>ed <strong>in</strong> <strong>the</strong> same way as <strong>in</strong><strong>the</strong> PROC GLM procedure by add<strong>in</strong>g <strong>the</strong> follow<strong>in</strong>gLSMEANS statement <strong>in</strong> <strong>the</strong> PROC <strong>MIXED</strong> code as shownpreviously. <strong>The</strong> /PDIFF <strong>in</strong> <strong>the</strong> LSMEANS statement<strong>in</strong>vokes SAS to provide <strong>the</strong> difference between all pairs <strong>of</strong>means and <strong>the</strong> standard error <strong>of</strong> <strong>the</strong> difference.LSMEANS DIET DIET*TIME/PDIFF;Table 6 provides least square mean estimates for <strong>the</strong> sixdiets for <strong>the</strong> five covariance structures. Least square meansare similar for each diet regardless <strong>of</strong> <strong>the</strong> covariance structure,beca<strong>use</strong> <strong>the</strong> example data are balanced. With unbalanceddata, <strong>the</strong> least square mean estimates would bedifferent (Cnaan et al. 1997). <strong>The</strong> standard errors <strong>of</strong> <strong>the</strong> leastsquare estimates differ for <strong>the</strong> different covariance <strong>models</strong>beca<strong>use</strong> <strong>the</strong>y are adjusted for <strong>the</strong> covariance parameters <strong>in</strong><strong>the</strong> mixed model (Littell et al. 1998). However, <strong>the</strong> leastsquare means are <strong>the</strong> same <strong>in</strong> GLM and <strong>MIXED</strong> as <strong>the</strong>y areboth calculated <strong>in</strong> <strong>the</strong> same way.Effect <strong>of</strong> <strong>the</strong> Covariance Structures on L<strong>in</strong>earComb<strong>in</strong>ations <strong>of</strong> Fixed EffectsLet us now exam<strong>in</strong>e <strong>the</strong> different covariance structures oncomparisons for diet 1 and diet 3 at five different time periodsas shown <strong>in</strong> Table 7. <strong>The</strong> values <strong>in</strong> Table 7 can beobta<strong>in</strong>ed by add<strong>in</strong>g <strong>the</strong> ESTIMATE statement with appropriatel<strong>in</strong>ear contrasts <strong>in</strong> <strong>the</strong> SAS code as follows:ESTIMATE ‘D1-D3 at T1’ DIET 1 0 -1000 DIET*TIME1000000000-10000;ESTIMATE ‘D1-D3 at T2’ DIET 1 0 -1000 DIET*TIME01000000000-1000;ESTIMATE ‘D1-D3 at T3’ DIET 1 0 -1000 DIET*TIME001000000000-100;ESTIMATE ‘D1-D3 at T4’ DIET 1 0 -1000 DIET*TIME0001000000000-10;ESTIMATE ‘D1-D3 at T5’ DIET 1 0 -1000 DIET*TIME00001000000000-1;<strong>The</strong> estimates <strong>of</strong> <strong>the</strong> difference between diet 1 and diet 3 aresimilar across <strong>models</strong>, but <strong>the</strong> standard errors <strong>of</strong> <strong>the</strong> estimatesare similar and constant over time for SIMPLE, CSand AR(1) <strong>models</strong> beca<strong>use</strong> <strong>the</strong>se <strong>models</strong> assume a constantvariance over time as previously shown. On <strong>the</strong> o<strong>the</strong>r hand,standard errors <strong>of</strong> <strong>the</strong> estimates with ANTE(1) and UN<strong>models</strong> are similar with<strong>in</strong> <strong>the</strong> same time period, and <strong>in</strong>creaseover time. This is beca<strong>use</strong> both ANTE(1) and UN <strong>models</strong>are able to recognize heterogeneous variation over time asobserved <strong>in</strong> <strong>the</strong>se data. <strong>The</strong> results <strong>in</strong> Table 7 clearly <strong>in</strong>dicatethat <strong>the</strong> <strong>in</strong>appropriate choice <strong>of</strong> <strong>the</strong> SIMPLE, CS andAR(1) <strong>models</strong> resulted <strong>in</strong> a high risk for Type I statisticalerror <strong>in</strong> <strong>the</strong> earlier time periods (1 and 2) and a high risk forType II error (fail<strong>in</strong>g to reject <strong>the</strong> null hypo<strong>the</strong>sis when <strong>the</strong>alternate hypo<strong>the</strong>sis is true) <strong>in</strong> later time periods (4 and 5)for <strong>the</strong> above estimates compared with ANTE(1) and UNmodel. <strong>The</strong>refore, ANTE(1) and UN <strong>models</strong> adequatelydescribe <strong>the</strong> example data while <strong>the</strong> Simple, CS and AR(1)<strong>models</strong> do not.
10 CANADIAN JOURNAL OF ANIMAL SCIENCECan. J. Anim. Sci. Downloaded from pubs.aic.ca by CAPES M<strong>in</strong> da Educacao - Brazil on 05/31/12For personal <strong>use</strong> only.Table 7. Least square mean estimates (EST) and standard errors (SE) <strong>of</strong> differences between diets 1 and 3 at different time periods from five covariancez <strong>models</strong> for <strong>the</strong> data set STEERSSIMPLE CS AR(1) ANTE(1) UNDifference y EST SE EST SE EST SE EST SE EST SED1–D3 at T1 –11.99 4.65 –11.99 4.68 –11.97 4.72 –12.47 2.63 –12.43 2.62D1–D3 at T2 –16.99 4.65 –16.99 4.68 –16.97 4.72 –17.47 3.96 –17.43 3.93D1–D3 at T3 –25.49 4.65 –25.49 4.68 –25.47 4.72 –25.97 4.95 –25.93 4.90D1–D3 at T4 –31.69 4.65 –31.69 4.68 –31.67 4.72 –32.17 5.46 –32.13 5.41D1–D3 at T5 –34.34 4.65 –34.34 4.68 –34.32 4.72 –34.82 6.60 –34.78 6.53z SIMPLE = simple, CS = compound symmetry, AR(1) = first order autoregressive, ANTE(1) = ante dependence, UN = unstructured.All estimates (EST) aresignificant at <strong>the</strong> 0.01 level.y D1–D3 at T1 = difference between diet 1 and 3 at time 1. D1–D3 at T2 = difference between diet 1 and 3 at time 2. D1–D3 at T3 = difference between diet1 and 3 at time 3. D1–D3 at T4 = difference between diet 1 and 3 at time 4. D1–D3 at T5 = difference between diet 1 and 3 at time 5.CONCLUSIONS<strong>The</strong> univariate ANOVA method <strong>of</strong>ten does not handle <strong>the</strong>time-dependent correlations adequately <strong>in</strong> repeated measuresdata and may <strong>of</strong>ten result <strong>in</strong> a Type I statistical error, that isrejection <strong>the</strong> null hypo<strong>the</strong>sis when it is true. <strong>The</strong> MANOVAmethod assumes an unstructured covariance matrix that is farmore general than required by most repeated measures data.It also wastes large amounts <strong>of</strong> <strong>in</strong>formation <strong>the</strong>reby reduc<strong>in</strong>g<strong>the</strong> power <strong>of</strong> <strong>the</strong> test, and cannot handle miss<strong>in</strong>g data effectively.<strong>The</strong> mixed model allows a flexible approach to modelappropriate covariance structures that would adequatelyaccount for with<strong>in</strong>-subject correlations over time. <strong>The</strong> mixedmodel <strong>use</strong>s a generalized least squares method to estimate andtest <strong>the</strong> fixed effects, which is generally superior to <strong>the</strong> ord<strong>in</strong>aryleast squares <strong>use</strong>d by GLM. Mixed model methodologyhas <strong>the</strong> ability to handle miss<strong>in</strong>g data and unequal spac<strong>in</strong>g,and allows a covariate <strong>in</strong> <strong>the</strong> model. It is recommended that<strong>the</strong> mixed model be <strong>use</strong>d for <strong>the</strong> <strong>analysis</strong> <strong>of</strong> repeated measuresdesigns <strong>in</strong> <strong>animal</strong> studies. This is demonstrated by ourexample <strong>in</strong> which <strong>the</strong> ANTE(1) covariance structure fitted <strong>the</strong>data best among <strong>the</strong> five <strong>models</strong> selected and provided <strong>the</strong>most appropriate F tests for fixed effects, estimates <strong>of</strong> leastsquare means and standard errors.ACKNOWLEDGMENTSWe thank Dr. Zahir Mir for provid<strong>in</strong>g <strong>the</strong> data and Dr. D.Spaner for review<strong>in</strong>g <strong>the</strong> manuscript.Cody, R. P. and Smith, J. K. 1991. Applied statistics and <strong>the</strong> SASprogramm<strong>in</strong>g language. North-Holland, Elsevier Publish<strong>in</strong>g Co.,New York, NY.Cnaan, A., Laird, N. M. and Slasor, P. 1997. Us<strong>in</strong>g <strong>the</strong> generall<strong>in</strong>ear mixed model to analyze unbalanced repeated measures andlongitud<strong>in</strong>al dada. Stat. Med. 16: 2349–2380.Goonewardene, L. A. 1990. Application <strong>of</strong> <strong>the</strong> repeated measuresANOVA <strong>in</strong> agriculture. Proceed<strong>in</strong>gs <strong>of</strong> <strong>the</strong> First All-AlbertaApplied Statistics and Biometrics Workshop. AlbertaEnvironmental Center, Alberta Research Institute and AlbertaAgriculture, Edmonton, AB. pp. 54–64.Goonewardene, L. A., Price, M. A., Stookey, J. M., Day, P. A.and M<strong>in</strong>chau, G. 2000. Handl<strong>in</strong>g, electric goad and head restra<strong>in</strong>t:Effects on calves’ behavior. J. Appl. Anim. Welfare Sci. 3: 5–22.Guer<strong>in</strong>, L and Stroup, W. W. 2000. A simulation study to evaluatePROC <strong>MIXED</strong> Analysis <strong>of</strong> Repeated Measures Data. Proc. Conf.Appl. Stat. <strong>in</strong> Agric., Kansas State University, Manhatten, KS.Huynh, H. and Feldt, L S. 1970. Conditions under which meansquare ratios <strong>in</strong> repeated measurements designs have exact F-distributions.J. Am. Stat. Assoc. 65: 1582–1589.Huynh, H. and Feldt, L S. 1976. Estimation <strong>of</strong> <strong>the</strong> Box correctionfor degrees <strong>of</strong> freedom from sample data <strong>in</strong> <strong>the</strong> randomized blockand split plot designs. J. Edu. Stat. 1: 15–51.Littell, R. C., Frueund, R. J. and Spector, P. C. 1991. SAS systemfor l<strong>in</strong>ear <strong>models</strong>. 3rd ed. SAS series <strong>in</strong> statistical applications.SAS Institute, Inc. Cary, NC.Littell, R. C., Milliken, G. A., Stroup, W. W. and Wolf<strong>in</strong>ger, R. D.1996. SAS system for mixed <strong>models</strong>. SAS Institute, Inc., Cary, NC.Littell, R. C., Henry, R. C. and Ammerman, C. B. 1998.Statistical <strong>analysis</strong> <strong>of</strong> repeated measures data us<strong>in</strong>g SAS procedures.J. Anim. Sci. 76: 1216–1231.Littell, R. C., Pendergast, J. and Natarajan, R. 2000. Model<strong>in</strong>gcovariance structure <strong>in</strong> <strong>the</strong> <strong>analysis</strong> <strong>of</strong> repeated measures data. Stat.Med. 19: 1793–1819.Milliken, G. A. and Johnson, D. E. 1992. Analysis <strong>of</strong> messy data.Volume 1. Designed experiments. Chapman and Hall, New York,NY.Mir, Z., Mir, P. S., Acharya, S. N., Zaman, M. S., Taylor, W.G., Mears, G. W., McAllister, T. A. and Goonewardene, L. A.1998. Comparison <strong>of</strong> alfalfa and fenugreek (Trigonella foenumgraecum) silages supplemented with barley gra<strong>in</strong> on performance<strong>of</strong> grow<strong>in</strong>g steers. Can. J. Anim. Sci. 78: 343–349.Platter, W. J., Tatum, J. D., Belk, K. E., Scanga, J. A. andSmith, G. C. 2003. Effects <strong>of</strong> repetitive <strong>use</strong> <strong>of</strong> hormonal implantson beef carcass quality, tenderness and consumer rat<strong>in</strong>gs <strong>of</strong> beefpalatability. J. Anim. Sci. 81: 984–996SAS/STAT 1990. SAS/STAT <strong>use</strong>r’s guide. Vol. 1. SAS Institute,Inc., Cary, NC.SAS Institute, Inc. 1997. SAS/STAT s<strong>of</strong>tware: Changes andenhancements through Release 6.12, Chapter 18. SAS Institute,Inc., Cary, NC.SAS Institute, Inc., 1999. SAS/STAT <strong>use</strong>r’s guide. Version 8.SAS Institute, Inc., Cary, NC.SAS Institute, Inc. 2002. SAS course notes on Mixed ModelAnalysis Us<strong>in</strong>g SAS System. SAS Institute, Inc., Cary, NC.Silvia, P. J., Meyer, S. L. and Fitzgerald, B. P. 1995. Pulsatilegonadotrop<strong>in</strong> secretion determ<strong>in</strong>ed by frequent sampl<strong>in</strong>g from <strong>the</strong><strong>in</strong>tercavernous s<strong>in</strong>us <strong>of</strong> <strong>the</strong> mare: possible modulatory role <strong>of</strong> progesteronedur<strong>in</strong>g luteolysis. Biol. Reprod. 53: 438–446.Templeman, R. J., Douglass, L. W. and Craig, B. A. 2002.NCR-170 FASS Mixed Model Workshop 2002 ADSA-ASAS-CSAS National meet<strong>in</strong>gs, Quebec City, QC. 24–25 July 2002.Wells, R. S. and Preston, R. L. 1998. Effects <strong>of</strong> repeated ureadilution measurement on feedlot performance and consistency <strong>of</strong>estimated body composition <strong>in</strong> steers <strong>of</strong> different breed types. J.Anim. Sci. 76: 2799–2804.
Can. J. Anim. Sci. Downloaded from pubs.aic.ca by CAPES M<strong>in</strong> da Educacao - Brazil on 05/31/12For personal <strong>use</strong> only.WANG AND GOONEWARDENE — <strong>MIXED</strong> MODELS FOR REPEATED DATA 11Wolf<strong>in</strong>ger, R. D. 1992. Analyz<strong>in</strong>g split-plot repeated measuresdesigns us<strong>in</strong>g mixed <strong>models</strong>. Proc. <strong>of</strong> <strong>the</strong> Kansas State Univ. Conf.Appl. Stat. <strong>in</strong> Agric. pp. 190–200.Wolf<strong>in</strong>ger, R. D. 1996. Heterogeneous variance covariance structuresfor repeated measures. J. Agric. Biol. Environ. Stat. 1: 205–230.Yandell, B. 1997. Practical data <strong>analysis</strong> for designed experiments.Chapman and Hall Publications, London, UK.ZoBell, D. R., Goonewardene, L. A., Olson, K. C., Stonecipher,C. A. and Weidmeier, R. D. 2003. Effects <strong>of</strong> feed<strong>in</strong>g wheat middl<strong>in</strong>gson production, digestibility, rum<strong>in</strong>al fermentation and carcasscharacteristics <strong>in</strong> beef cattle. Can. J. Anim. Sci. 83: 551–557.
Can. J. Anim. Sci. Downloaded from pubs.aic.ca by CAPES M<strong>in</strong> da Educacao - Brazil on 05/31/12For personal <strong>use</strong> only.