Dust Up: Review of Harmful PM10 Dust Emissions in the Mackay ...
Dust Up: Review of Harmful PM10 Dust Emissions in the Mackay ...
Dust Up: Review of Harmful PM10 Dust Emissions in the Mackay ...

You also want an ePaper? Increase the reach of your titles
YUMPU automatically turns print PDFs into web optimized ePapers that Google loves.
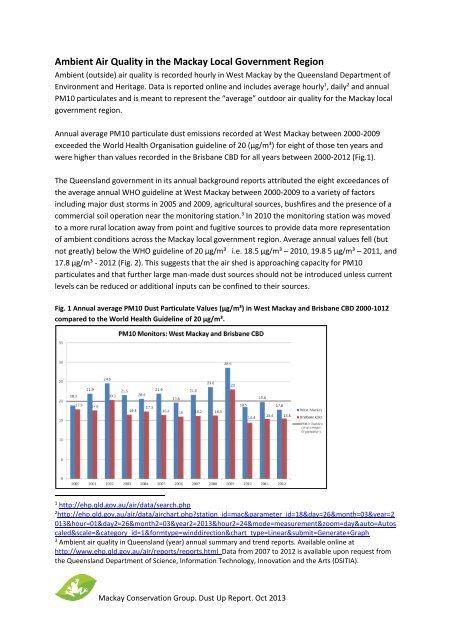
Ambient Air Quality <strong>in</strong> <strong>the</strong> <strong>Mackay</strong> Local Government RegionAmbient (outside) air quality is recorded hourly <strong>in</strong> West <strong>Mackay</strong> by <strong>the</strong> Queensland Department <strong>of</strong>Environment and Heritage. Data is reported onl<strong>in</strong>e and <strong>in</strong>cludes average hourly 1 , daily 2 and annual<strong>PM10</strong> particulates and is meant to represent <strong>the</strong> “average” outdoor air quality for <strong>the</strong> <strong>Mackay</strong> localgovernment region.Annual average <strong>PM10</strong> particulate dust emissions recorded at West <strong>Mackay</strong> between 2000-2009exceeded <strong>the</strong> World Health Organisation guidel<strong>in</strong>e <strong>of</strong> 20 (µg/m³) for eight <strong>of</strong> those ten years andwere higher than values recorded <strong>in</strong> <strong>the</strong> Brisbane CBD for all years between 2000-2012 (Fig.1).The Queensland government <strong>in</strong> its annual background reports attributed <strong>the</strong> eight exceedances <strong>of</strong><strong>the</strong> average annual WHO guidel<strong>in</strong>e at West <strong>Mackay</strong> between 2000-2009 to a variety <strong>of</strong> factors<strong>in</strong>clud<strong>in</strong>g major dust storms <strong>in</strong> 2005 and 2009, agricultural sources, bushfires and <strong>the</strong> presence <strong>of</strong> acommercial soil operation near <strong>the</strong> monitor<strong>in</strong>g station. 3 In 2010 <strong>the</strong> monitor<strong>in</strong>g station was movedto a more rural location away from po<strong>in</strong>t and fugitive sources to provide data more representation<strong>of</strong> ambient conditions across <strong>the</strong> <strong>Mackay</strong> local government region. Average annual values fell (butnot greatly) below <strong>the</strong> WHO guidel<strong>in</strong>e <strong>of</strong> 20 µg/m³ i.e. 18.5 µg/m³ – 2010, 19.8 5 µg/m³ – 2011, and17.8 µg/m³ - 2012 (Fig. 2). This suggests that <strong>the</strong> air shed is approach<strong>in</strong>g capacity for <strong>PM10</strong>particulates and that fur<strong>the</strong>r large man-made dust sources should not be <strong>in</strong>troduced unless currentlevels can be reduced or additional <strong>in</strong>puts can be conf<strong>in</strong>ed to <strong>the</strong>ir sources.Fig. 1 Annual average <strong>PM10</strong> <strong>Dust</strong> Particulate Values (µg/m³) <strong>in</strong> West <strong>Mackay</strong> and Brisbane CBD 2000-1012compared to <strong>the</strong> World Health Guidel<strong>in</strong>e <strong>of</strong> 20 µg/m³.1http://ehp.qld.gov.au/air/data/search.php2http://ehp.qld.gov.au/air/data/airchart.php?station_id=mac¶meter_id=18&day=26&month=03&year=2013&hour=01&day2=26&month2=03&year2=2013&hour2=24&mode=measurement&zoom=day&auto=Autoscaled&scale=&category_id=1&formtype=w<strong>in</strong>ddirection&chart_type=L<strong>in</strong>ear&submit=Generate+Graph3Ambient air quality <strong>in</strong> Queensland (year) annual summary and trend reports. Available onl<strong>in</strong>e athttp://www.ehp.qld.gov.au/air/reports/reports.html Data from 2007 to 2012 is available upon request from<strong>the</strong> Queensland Department <strong>of</strong> Science, Information Technology, Innovation and <strong>the</strong> Arts (DSITIA).<strong>Mackay</strong> Conservation Group. <strong>Dust</strong> <strong>Up</strong> Report. Oct 2013