Dust Up: Review of Harmful PM10 Dust Emissions in the Mackay ...
Dust Up: Review of Harmful PM10 Dust Emissions in the Mackay ...
Dust Up: Review of Harmful PM10 Dust Emissions in the Mackay ...

Create successful ePaper yourself
Turn your PDF publications into a flip-book with our unique Google optimized e-Paper software.
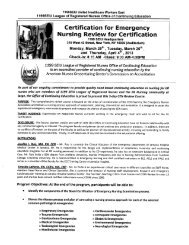
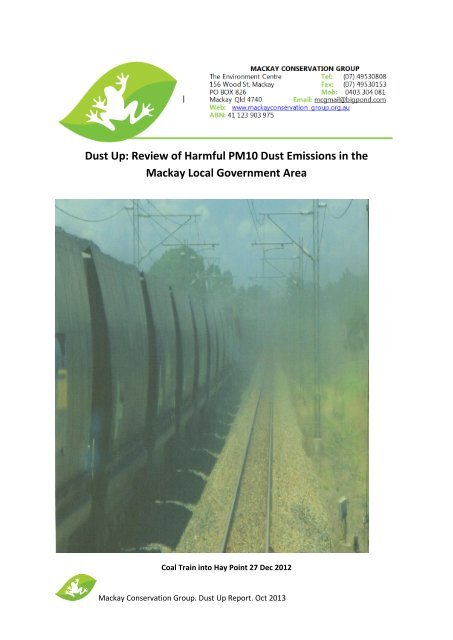
<strong>Dust</strong> <strong>Up</strong>: <strong>Review</strong> <strong>of</strong> <strong>Harmful</strong> <strong>PM10</strong> <strong>Dust</strong> <strong>Emissions</strong> <strong>in</strong> <strong>the</strong><strong>Mackay</strong> Local Government AreaCoal Tra<strong>in</strong> <strong>in</strong>to Hay Po<strong>in</strong>t 27 Dec 2012<strong>Mackay</strong> Conservation Group. <strong>Dust</strong> <strong>Up</strong> Report. Oct 2013
performance; and built a project management <strong>of</strong>fice and aligned IT to deliver district solutions utiliz<strong>in</strong>g acommon <strong>in</strong>dustry framework, methodology and philosophy.“Jerome is a very strategic th<strong>in</strong>ker who focuses on executional excellence and accountability for results.He puts his objectives and plans <strong>in</strong> writ<strong>in</strong>g and <strong>the</strong>n measures aga<strong>in</strong>st <strong>the</strong>m. At The Atlanta PublicSchools he <strong>in</strong>sisted on quality and documentation, and really <strong>the</strong> accountability <strong>of</strong> everyone,” said SusanObermeier, who worked with Mr. Oberlton as Atlanta Public Schools’ chief strategy <strong>of</strong>ficer. “And youknow how with someone very accountability oriented you <strong>of</strong>ten th<strong>in</strong>k, ‘Oh dread?’ Not with Jerome.Everybody loved to work with him.”Prior to jo<strong>in</strong><strong>in</strong>g Atlanta Public Schools, Mr. Oberlton worked <strong>in</strong> several capacities at General Electric,most recently as <strong>the</strong> company’s IT compliance <strong>of</strong>ficer. Before that, he worked at Kraft Foods. He beganhis career <strong>in</strong> IT as a programmer at Amoco Corp. <strong>in</strong> 1990“Mr. Oberlton comes to City Schools with an extensive background <strong>in</strong> IT that <strong>in</strong>cludes several years withano<strong>the</strong>r large urban public school district that, like City Schools, is <strong>in</strong> <strong>the</strong> midst <strong>of</strong> reform and, like CitySchools, looked to data to drive its reform work and to technology to maximize its reform efforts,” Dr.Alonso said. “Mr. Oberlton’s history <strong>of</strong> build<strong>in</strong>g data warehouses and creat<strong>in</strong>g operational and costefficiencies will hugely benefit City Schools. His arrival will help push <strong>the</strong> district <strong>in</strong>to a new realm <strong>of</strong>accountability and complete focus on student achievement.”Mr. Oberlton holds a Bachelors <strong>of</strong> Science degree <strong>in</strong> Computer Information Systems from Florida A&MUniversity <strong>in</strong> Tallahassee, FL, and a Masters <strong>in</strong> Bus<strong>in</strong>ess Adm<strong>in</strong>istration <strong>in</strong> F<strong>in</strong>ance and ManagementInformation Systems from DePaul University <strong>in</strong> Chicago, IL. He completed <strong>the</strong> Executive LeadershipDevelopment program at Harvard University’s JFK School <strong>of</strong> Government, and is a member <strong>of</strong> <strong>the</strong> MetroAtlanta CIO Council and a program leader for <strong>the</strong> United Way <strong>of</strong> Atlanta.“The challenges Baltimore’s leadership is wrestl<strong>in</strong>g with are very similar to <strong>the</strong> challenges we faced <strong>in</strong>Atlanta. The collection <strong>of</strong> data and <strong>the</strong> nimbleness and agility <strong>of</strong> us<strong>in</strong>g data pose a huge set <strong>of</strong> challenges.My job will be to craft solutions that address those challenges,” Mr. Oberlton said. “I look forward to <strong>the</strong>work ahead. Besides, determ<strong>in</strong><strong>in</strong>g how to marry technology to <strong>the</strong> needs <strong>of</strong> <strong>the</strong> classroom and to helpstudents perform at higher levels—and particularly <strong>in</strong> urban education—is just a big <strong>in</strong>terest <strong>of</strong> m<strong>in</strong>e.”-30-
Executive Summary:The objectives <strong>of</strong> this study were to show <strong>the</strong> contribution from <strong>the</strong> Hay Po<strong>in</strong>t port lands coalterm<strong>in</strong>als to <strong>the</strong> area’s <strong>in</strong>dustrial sources <strong>of</strong> harmful <strong>PM10</strong> particulates; how far visible <strong>PM10</strong> coaldust is travell<strong>in</strong>g (as measured by North Queensland Bulk Ports); how <strong>of</strong>ten it is settl<strong>in</strong>g <strong>in</strong> monitoredresidential areas; and to question extensive fur<strong>the</strong>r coal port expansion (as planned <strong>in</strong> <strong>the</strong> draftQueensland Ports Strategy) given annual average <strong>PM10</strong> measurements for <strong>the</strong> <strong>Mackay</strong> localgovernment area are close to exceed<strong>in</strong>g <strong>the</strong> World Health Organisation’s air quality guidel<strong>in</strong>e <strong>of</strong> 20µg/m³ and <strong>the</strong> hazardous coal dust component <strong>of</strong> <strong>PM10</strong> emissions from <strong>the</strong> ports would <strong>in</strong>creasesignificantly .Air quality monitor<strong>in</strong>g <strong>of</strong> dust <strong>in</strong> <strong>Mackay</strong> consists <strong>of</strong> ambient (outside) air quality measurementsreported as average hourly, daily and annual <strong>PM10</strong> particulates designed to provide a measure <strong>of</strong>“average” air quality conditions across <strong>the</strong> air shed <strong>of</strong> <strong>the</strong> <strong>Mackay</strong> local government area. This isseparate from po<strong>in</strong>t and fugitive sources <strong>of</strong> dust emissions such as those produced from <strong>in</strong>dustrialsources, and additional dust deposition monitor<strong>in</strong>g which may be done by an <strong>in</strong>dustry. Ano<strong>the</strong>rmajor source <strong>of</strong> particulates, transportation, was not considered <strong>in</strong> this review.Ambient annual average <strong>PM10</strong> particulate dust levels from 2000-2012 at West <strong>Mackay</strong> monitor<strong>in</strong>gstation were consistently above those monitored <strong>in</strong> <strong>the</strong> Brisbane CBD. <strong>Mackay</strong>’s dust levels wereabove <strong>the</strong> World Health Organisation guidel<strong>in</strong>e from 2000-2009 and rema<strong>in</strong>ed high, fall<strong>in</strong>g justbelow that guidel<strong>in</strong>e from 2010-2012 follow<strong>in</strong>g transfer <strong>of</strong> <strong>the</strong> monitor<strong>in</strong>g station to a site morerepresentative <strong>of</strong> ambient air quality for <strong>the</strong> <strong>Mackay</strong> local government area.<strong>PM10</strong> particulate emissions from <strong>in</strong>dustries <strong>in</strong> <strong>the</strong> <strong>Mackay</strong> local government area are reportedannually by <strong>in</strong>dustries exceed<strong>in</strong>g trigger thresholds to <strong>the</strong> Australian government’s NationalPollution Inventory. The current two coal port term<strong>in</strong>als, Dalrymple Bay and Hay Po<strong>in</strong>t <strong>in</strong> <strong>the</strong> HayPo<strong>in</strong>t port lands, contributed twenty-seven per cent <strong>of</strong> <strong>the</strong> total <strong>in</strong>dustrial sources <strong>of</strong> <strong>the</strong>se po<strong>in</strong>t andfugitive source emissions for 2011-2012.<strong>Dust</strong> deposition data for <strong>the</strong> exist<strong>in</strong>g Dalrymple Bay and Hay Po<strong>in</strong>t coal term<strong>in</strong>als is collectedmonthly by HLA-Envirosciences Pty Ltd for North Queensland Bulk Ports and analysed <strong>in</strong> <strong>the</strong> lab forpercentage <strong>of</strong> coal dust i.e. visible dark particulates greater than one per cent. Between 2000-2012coal dust deposition was recorded <strong>in</strong> 98 per cent <strong>of</strong> <strong>the</strong> measurements for a residential site at LouisaCreek with<strong>in</strong> a few hundred metres <strong>of</strong> <strong>the</strong> Hay Po<strong>in</strong>t coal stockpiles, decl<strong>in</strong><strong>in</strong>g to 40 per cent at 2kmfrom <strong>the</strong> stockpiles and a few per cent at Grasstree Beach 8.25km from <strong>the</strong> stockpiles.<strong>Mackay</strong> Conservation Group. <strong>Dust</strong> <strong>Up</strong> Report. Oct 2013
Ambient Air Quality <strong>in</strong> <strong>the</strong> <strong>Mackay</strong> Local Government RegionAmbient (outside) air quality is recorded hourly <strong>in</strong> West <strong>Mackay</strong> by <strong>the</strong> Queensland Department <strong>of</strong>Environment and Heritage. Data is reported onl<strong>in</strong>e and <strong>in</strong>cludes average hourly 1 , daily 2 and annual<strong>PM10</strong> particulates and is meant to represent <strong>the</strong> “average” outdoor air quality for <strong>the</strong> <strong>Mackay</strong> localgovernment region.Annual average <strong>PM10</strong> particulate dust emissions recorded at West <strong>Mackay</strong> between 2000-2009exceeded <strong>the</strong> World Health Organisation guidel<strong>in</strong>e <strong>of</strong> 20 (µg/m³) for eight <strong>of</strong> those ten years andwere higher than values recorded <strong>in</strong> <strong>the</strong> Brisbane CBD for all years between 2000-2012 (Fig.1).The Queensland government <strong>in</strong> its annual background reports attributed <strong>the</strong> eight exceedances <strong>of</strong><strong>the</strong> average annual WHO guidel<strong>in</strong>e at West <strong>Mackay</strong> between 2000-2009 to a variety <strong>of</strong> factors<strong>in</strong>clud<strong>in</strong>g major dust storms <strong>in</strong> 2005 and 2009, agricultural sources, bushfires and <strong>the</strong> presence <strong>of</strong> acommercial soil operation near <strong>the</strong> monitor<strong>in</strong>g station. 3 In 2010 <strong>the</strong> monitor<strong>in</strong>g station was movedto a more rural location away from po<strong>in</strong>t and fugitive sources to provide data more representation<strong>of</strong> ambient conditions across <strong>the</strong> <strong>Mackay</strong> local government region. Average annual values fell (butnot greatly) below <strong>the</strong> WHO guidel<strong>in</strong>e <strong>of</strong> 20 µg/m³ i.e. 18.5 µg/m³ – 2010, 19.8 5 µg/m³ – 2011, and17.8 µg/m³ - 2012 (Fig. 2). This suggests that <strong>the</strong> air shed is approach<strong>in</strong>g capacity for <strong>PM10</strong>particulates and that fur<strong>the</strong>r large man-made dust sources should not be <strong>in</strong>troduced unless currentlevels can be reduced or additional <strong>in</strong>puts can be conf<strong>in</strong>ed to <strong>the</strong>ir sources.Fig. 1 Annual average <strong>PM10</strong> <strong>Dust</strong> Particulate Values (µg/m³) <strong>in</strong> West <strong>Mackay</strong> and Brisbane CBD 2000-1012compared to <strong>the</strong> World Health Guidel<strong>in</strong>e <strong>of</strong> 20 µg/m³.1http://ehp.qld.gov.au/air/data/search.php2http://ehp.qld.gov.au/air/data/airchart.php?station_id=mac¶meter_id=18&day=26&month=03&year=2013&hour=01&day2=26&month2=03&year2=2013&hour2=24&mode=measurement&zoom=day&auto=Autoscaled&scale=&category_id=1&formtype=w<strong>in</strong>ddirection&chart_type=L<strong>in</strong>ear&submit=Generate+Graph3Ambient air quality <strong>in</strong> Queensland (year) annual summary and trend reports. Available onl<strong>in</strong>e athttp://www.ehp.qld.gov.au/air/reports/reports.html Data from 2007 to 2012 is available upon request from<strong>the</strong> Queensland Department <strong>of</strong> Science, Information Technology, Innovation and <strong>the</strong> Arts (DSITIA).<strong>Mackay</strong> Conservation Group. <strong>Dust</strong> <strong>Up</strong> Report. Oct 2013
Fig. 2 Average Annual Ambient Air Quality for <strong>the</strong> <strong>Mackay</strong> Local Government Area 2000-2012 (West <strong>Mackay</strong>Air Quality Monitor<strong>in</strong>g Station)Industrial Po<strong>in</strong>t and Fugitive Sources <strong>of</strong> <strong>PM10</strong> <strong>Dust</strong> Particulates <strong>in</strong> <strong>the</strong> <strong>Mackay</strong>Local Government RegionThe National Pollution Inventory produced by <strong>the</strong> Australian government reports on substanceemissions from <strong>in</strong>dustries <strong>in</strong> <strong>the</strong> area covered by <strong>the</strong> <strong>Mackay</strong> Local Government Area. 4 The data isprovided by <strong>the</strong> <strong>in</strong>dustries when emissions are above trigger levels. In 2011 to 2012 twelve<strong>in</strong>dustries reported <strong>the</strong>ir estimated <strong>PM10</strong> dust particulate emissions (Table 1).The largest source was from <strong>the</strong> sugar process<strong>in</strong>g <strong>in</strong>dustries compris<strong>in</strong>g <strong>the</strong> mills at Farleigh, Marianand Racecourse and <strong>the</strong> Sucrogen Plane Creek Distillery totall<strong>in</strong>g 1,112,100 kg. The second largestsource was from <strong>the</strong> two coal term<strong>in</strong>als at Hay Po<strong>in</strong>t. They reported 501,000 kg, which is 45 per cent<strong>of</strong> what <strong>the</strong> sugar <strong>in</strong>dustry reported. <strong>PM10</strong> particulate emissions from <strong>the</strong> Hay Po<strong>in</strong>t and DalrympleBay coal term<strong>in</strong>als <strong>in</strong> <strong>the</strong> Hay Po<strong>in</strong>t port lands were 27 per cent <strong>of</strong> <strong>the</strong> total <strong>in</strong>dustrial sources. TheHay Po<strong>in</strong>t coal term<strong>in</strong>al at 430,000 kg was <strong>the</strong> largest s<strong>in</strong>gle <strong>in</strong>dustrial po<strong>in</strong>t and fugitive <strong>PM10</strong>emissions source <strong>in</strong> <strong>the</strong> <strong>Mackay</strong> local government area.4http://www.npi.gov.au/npidata/action/load/facility-source-result/criteria/lga/289/dest<strong>in</strong>ation/ALL/sourcetype/ALL/subthreshold-data/Yes/substance-name/All/year/2012<strong>Mackay</strong> Conservation Group. <strong>Dust</strong> <strong>Up</strong> Report. Oct 2013
Table 1. Largest Industrial Sources <strong>of</strong> <strong>PM10</strong> Particulates <strong>in</strong> <strong>the</strong> <strong>Mackay</strong> Local Government Area 2011-2012Industry<strong>PM10</strong> (kg)Hay Po<strong>in</strong>t Coal Term<strong>in</strong>al 430,000Boral Resources 40,000<strong>Mackay</strong> Asphalt Plant, Farleigh 30,000Hanson Construction – Farleigh35,000QuarryFarleigh Sugar Mill 320,000Marian Sugar Mill 201,000Racecourse Sugar Mill 330,000QR National – Jilalan Rail Yard, Sar<strong>in</strong>a 21Stanwell Corp. Ltd – <strong>Mackay</strong> Gas12Turb<strong>in</strong>eSucrogen Plane Creek 250,000Thomas Borthwick & Sons (Aust) -140meatworksDalrymple Bay Coal Term<strong>in</strong>al 71,000TOTAL 1,707,173Source: National Pollution Inventory (onl<strong>in</strong>e Australian government database)Port Growth and Rise <strong>in</strong> <strong>PM10</strong> Particulate <strong>Emissions</strong>North Queensland Bulk Ports (NQBP) <strong>in</strong> its 2012 annual report stated that between 2011 and 201282.884 million tonnes <strong>of</strong> coal was exported through <strong>the</strong> Dalrymple Bay and Hay Po<strong>in</strong>t coal term<strong>in</strong>alsat <strong>the</strong> Port <strong>of</strong> Hay Po<strong>in</strong>t. If <strong>the</strong> two Dudgeon Po<strong>in</strong>t coal term<strong>in</strong>als are approved <strong>the</strong> capacity <strong>of</strong> <strong>the</strong>Port <strong>of</strong> Hay Po<strong>in</strong>t is planned to <strong>in</strong>crease by 20 million tonnes <strong>in</strong>itially to 170 million tonnes perannum <strong>of</strong> coal exports, and to 340 million tonnes with<strong>in</strong> 20 years. Add <strong>in</strong> additional <strong>PM10</strong> emissionsfrom three <strong>in</strong>dustrial hubs proposed between <strong>Mackay</strong> and Hay Po<strong>in</strong>t to support <strong>the</strong> Port and <strong>in</strong> 20years <strong>the</strong>y are likely to be <strong>the</strong> largest source <strong>of</strong> particulate emissions <strong>in</strong> <strong>the</strong> <strong>Mackay</strong> region.For example assum<strong>in</strong>g <strong>the</strong> <strong>in</strong>crease <strong>in</strong> <strong>PM10</strong> particulates from operations with <strong>the</strong> port lands is <strong>in</strong>l<strong>in</strong>e with <strong>the</strong> <strong>in</strong>crease <strong>in</strong> coal exports, <strong>the</strong>re would be 1,027,050 kg <strong>of</strong> <strong>PM10</strong> particulates emittedfrom <strong>the</strong> port lands dur<strong>in</strong>g <strong>the</strong> <strong>in</strong>itial phase <strong>of</strong> <strong>the</strong> Dudgeon Po<strong>in</strong>t coal expansion i.e.((170 Mtpa/82.884Mtpa x (430,000 + 71,000 kg <strong>PM10</strong>)).Similarly by <strong>the</strong> time <strong>the</strong> Dudgeon Po<strong>in</strong>t coal term<strong>in</strong>als were completed <strong>in</strong> 20 years’ time, <strong>PM10</strong>emissions from <strong>the</strong> port lands could be 4.1 times greater than <strong>in</strong> 2011-2012 at 2,054,100 kg. Theport lands would be by far <strong>the</strong> largest po<strong>in</strong>t source <strong>of</strong> <strong>PM10</strong> particulates <strong>in</strong> <strong>the</strong> <strong>Mackay</strong> localgovernment area.The 2013 <strong>Mackay</strong> Regional Council’s draft Plann<strong>in</strong>g Scheme states that three <strong>in</strong>dustrial hubs areproposed <strong>in</strong> <strong>the</strong> future along <strong>the</strong> coast between <strong>Mackay</strong> and Hay Po<strong>in</strong>t. One <strong>of</strong> <strong>the</strong>se will be atransport hub. They will be significant additional sources <strong>of</strong> <strong>PM10</strong> and PM2.5 particulate emissions.As <strong>the</strong> prevail<strong>in</strong>g w<strong>in</strong>ds <strong>in</strong> this region are from <strong>the</strong> south-east, this will mean far greater particulates<strong>Mackay</strong> Conservation Group. <strong>Dust</strong> <strong>Up</strong> Report. Oct 2013
pollution fall<strong>in</strong>g over Bakers Creek and <strong>Mackay</strong> from <strong>the</strong> port lands and <strong>the</strong> associated <strong>in</strong>dustrial andtransport hubs.NQBP has begun <strong>PM10</strong> and PM2.5 monitor<strong>in</strong>g at McEwens Beach but only plans on one suchmonitor<strong>in</strong>g station which will be mobile. It is not plann<strong>in</strong>g to monitor ground level ozone precursors.That is <strong>in</strong>sufficient to ga<strong>the</strong>r enough data to measure <strong>of</strong>f-site <strong>in</strong>creases and impacts. Health impactsneed to be measured and understood before any fur<strong>the</strong>r coal export expansion proceeds.Visible <strong>PM10</strong> Particulates Coal <strong>Dust</strong> Deposition on Residential Sites Surround<strong>in</strong>g Hay Po<strong>in</strong>tPort LandsCoal dust and diesel <strong>PM10</strong> and smaller particulates, which are found <strong>in</strong> <strong>the</strong> f<strong>in</strong>e dark particulates <strong>in</strong><strong>the</strong> dust deposition data collected by NQBP are more hazardous to health than o<strong>the</strong>r forms <strong>of</strong>particulates. They are associated with respiratory and heart diseases as well as cancer. The youngand elderly are <strong>the</strong> most susceptible.HLA-Envirosciences ga<strong>the</strong>rs monthly measurements <strong>of</strong> dust deposition from n<strong>in</strong>e residential sitesnear <strong>the</strong> Hay Po<strong>in</strong>t port lands for NQBP. This data is analysed <strong>in</strong> <strong>the</strong>ir lab to determ<strong>in</strong>e percentage <strong>of</strong>f<strong>in</strong>e dark particulates, which are primarily coal dust and some <strong>in</strong>completely burned carc<strong>in</strong>ogenicdiesel particulates. NQBP provides this data <strong>in</strong> monthly reports available to <strong>the</strong> public. All records <strong>of</strong>less than one per cent f<strong>in</strong>e dark particulates were considered zero f<strong>in</strong>e dark particulates andexcluded. The percentage <strong>of</strong> all records from 2000-2012 conta<strong>in</strong><strong>in</strong>g this form <strong>of</strong> dust for eachresidential area monitored was calculated and graphed aga<strong>in</strong>st distance from <strong>the</strong> coal stockpiles(Fig.3). The locations <strong>of</strong> <strong>the</strong> residential and port monitor<strong>in</strong>g sites are shown <strong>in</strong> Fig. 4.Fig.3 Percentage <strong>of</strong> <strong>Dust</strong> Deposition Records (200-2012) for Residential Sites around Hay Po<strong>in</strong>t and ControlSites at Grasstree Beach Conta<strong>in</strong><strong>in</strong>g Coal <strong>Dust</strong>.Percentages ranged from 98 per cent <strong>of</strong> all observations at <strong>the</strong> south-east end <strong>of</strong> <strong>the</strong> Louisa Creekcommunity with<strong>in</strong> 250m from <strong>the</strong> nearest coal stockpile, to 40 per cent <strong>of</strong> all observations at 2 km<strong>Mackay</strong> Conservation Group. <strong>Dust</strong> <strong>Up</strong> Report. Oct 2013
from <strong>the</strong> coal stockpiles, to just a few at Grasstree Beach, 8.25km from <strong>the</strong> coal stockpiles.Regrettably <strong>the</strong>re are no measurements available for McEwens Beach, Bakers Creek and <strong>Mackay</strong>,where <strong>the</strong> prevail<strong>in</strong>g south-easterly w<strong>in</strong>ds would blow dust far<strong>the</strong>r and over more residential areas(Fig. 5).The percentages <strong>of</strong> coal dust fall<strong>in</strong>g on residential areas ranged from 1-30 per cent. Values less thanone per cent were considered to be zero per cent and not counted. Given that coal exports couldfirst double to 170Mtpa and <strong>the</strong>n quadruple <strong>in</strong> 20 years to 340Mtpa it is reasonable to expect that<strong>the</strong>se percentages <strong>of</strong> <strong>PM10</strong> coal dust particulates would <strong>in</strong>crease significantly. This is because coalrail l<strong>in</strong>es will <strong>in</strong>crease to eight, and much more coal would be unloaded and placed on conveyor beltsfor transport to <strong>the</strong> coal shipp<strong>in</strong>g. Coal dust would also be lost dur<strong>in</strong>g load<strong>in</strong>g <strong>the</strong> coal ships. The coalstock piles at Dudgeon Po<strong>in</strong>t will be up to 20 m high as <strong>the</strong>y will sit on a 5m base above storm surgelevels. Their additional height means <strong>the</strong>y will lose more coal dust than lower stock piles elsewhere<strong>in</strong> Hay Po<strong>in</strong>t port lands.Fig. 4 Location <strong>of</strong> On-Site and Surround<strong>in</strong>g Residential <strong>Dust</strong> Deposition Monitored Sites at Hay Po<strong>in</strong>t.<strong>Mackay</strong> Conservation Group. <strong>Dust</strong> <strong>Up</strong> Report. Oct 2013
Fig. 5 Proposed urban expansion downw<strong>in</strong>d <strong>of</strong> <strong>the</strong> prevail<strong>in</strong>g south-easterlies from <strong>the</strong> Hay Po<strong>in</strong>t Port Lands.Source: http://www.dsdip.qld.gov.au/resources/plan/miw/miw-regional-plan.pdf page 111.Plann<strong>in</strong>g NeedsAs <strong>the</strong>re is no exposure level below which coal dust does not present a risk to health and <strong>the</strong> Port <strong>of</strong>Hay Po<strong>in</strong>t plans to run for at least 90 years, coal dust exposure would be higher, very long-term andmulti-generational <strong>in</strong> its health impacts 5 .As well as deal<strong>in</strong>g with <strong>the</strong> issue <strong>of</strong> an air shed approach<strong>in</strong>g capacity for dust particulate emissions,planners <strong>in</strong> state and federal government must evaluate <strong>the</strong> health risks <strong>of</strong> more major coal exportexpansion at Hay Po<strong>in</strong>t and decide if such expansion should proceed. These community health issuesare not specifically addressed <strong>in</strong> <strong>the</strong> draft Queensland Ports Strategy which aims to be <strong>the</strong> bluepr<strong>in</strong>tfor manag<strong>in</strong>g and improv<strong>in</strong>g <strong>the</strong> efficiency and environmental management <strong>of</strong> <strong>the</strong> state's portsnetwork over <strong>the</strong> next decade. 6The Ports <strong>of</strong> Hay Po<strong>in</strong>t, <strong>Mackay</strong> and Abbot Po<strong>in</strong>t are designated as Priority Port Development Areas(PPDAs). Hay Po<strong>in</strong>t and <strong>Mackay</strong> will comprise a s<strong>in</strong>gle PPDA <strong>of</strong> two zones. The QueenslandGovernment will, as part <strong>of</strong> proposed ports legislation, prohibit capital dredg<strong>in</strong>g for <strong>the</strong> development<strong>of</strong> additional deepwater port facilities outside <strong>of</strong> <strong>the</strong> five PPDAs until 2024. Under <strong>the</strong> QueenslandPorts Strategy, ports declared to be PPDAs will be required to prepare lead<strong>in</strong>g practice master plans5B. Brunekreef and B. Forsberg. <strong>Review</strong>: Epidemiological evidence <strong>of</strong> effects <strong>of</strong> coarse airborne particles onhealth. European Respiratory Journal, 2005, Vol. 26, No.2 pp309-318http://www.ncbi.nlm.nih.gov/pubmed/160558816http://www.dsdip.qld.gov.au/<strong>in</strong>frastructure-and-plann<strong>in</strong>g/queensland-ports-strategy.html<strong>Mackay</strong> Conservation Group. <strong>Dust</strong> <strong>Up</strong> Report. Oct 2013
<strong>in</strong>clud<strong>in</strong>g and Environmental Management Framework (EMF), and will be subject to CumulativeImpact Studies.Summary and Submission on draft Queensland Ports StrategyIt is essential that impacts on air, noise, water pollution and community health from <strong>the</strong> coal portsbe understood and prevented through <strong>the</strong> EMF or a Health Impacts Assessment, and that <strong>in</strong>cludes<strong>the</strong> impacts <strong>of</strong> particulates pollution, o<strong>the</strong>r toxics and and precursors to ground level hazardousozone pollution, such as oxides <strong>of</strong> nitrogen, sulphur oxides and volatile organic compounds onhuman health. Unfortunately current National Environmental Protection Measures (NEPM) forambient air quality are <strong>in</strong>sufficient to protect communities from <strong>the</strong> adverse impacts <strong>of</strong> <strong>PM10</strong> andf<strong>in</strong>er PM2.5 dust particulates (<strong>in</strong>clud<strong>in</strong>g coal dust for which <strong>the</strong>re is no air quality standard). Weurge <strong>the</strong> community to make submissions on <strong>the</strong> strategy rais<strong>in</strong>g <strong>the</strong> need to ensure communityhealth is fully protected before any expansion occurs.The draft Queensland Ports Strategy does note <strong>the</strong> draft State Plann<strong>in</strong>g Policy (SPP). It states onpage 36 that <strong>the</strong> draft SPP aligns with and supports port master plann<strong>in</strong>g by ensur<strong>in</strong>g developmentdoes not impact on <strong>the</strong> safe and efficient operation <strong>of</strong> Queensland’s ports, and that port operationsdo not result <strong>in</strong> un<strong>in</strong>tended social and environmental impacts on communities surround<strong>in</strong>g ports.Human health impacts could be <strong>in</strong>cluded <strong>in</strong> social impacts on communities, but would need toextend well beyond just <strong>the</strong> communities surround<strong>in</strong>g <strong>the</strong> ports, given <strong>the</strong> extent to which coal dustcan travel. If you are concerned about such impacts we urge you to put <strong>in</strong> a submission.Submissions on <strong>the</strong> draft Queensland Ports Strategy can be made <strong>in</strong> <strong>the</strong> follow<strong>in</strong>g ways:1. Onl<strong>in</strong>e survey ( http://www.dsdip.qld.gov.au/qpsonl<strong>in</strong>esurvey )2. Email: qldportsstrategy@dsdip.qld.gov.au(mailto:qldportsstrategy@dsdip.qld.gov.au )3. Post:Queensland Ports Strategy ManagerDepartment <strong>of</strong> State Development, Infrastructure and Plann<strong>in</strong>gPO Box 15009City East QLD 4002Clos<strong>in</strong>g date for submissions is Friday, 13 December 2013.A written submission form ( http://www.dsdip.qld.gov.au/resources/form/draft-qps-writtensubmission-form.doc) ( 602 KB) is available and can be submitted by email, fax (07 3235 4563) orpost.<strong>Mackay</strong> Conservation Group. <strong>Dust</strong> <strong>Up</strong> Report. Oct 2013