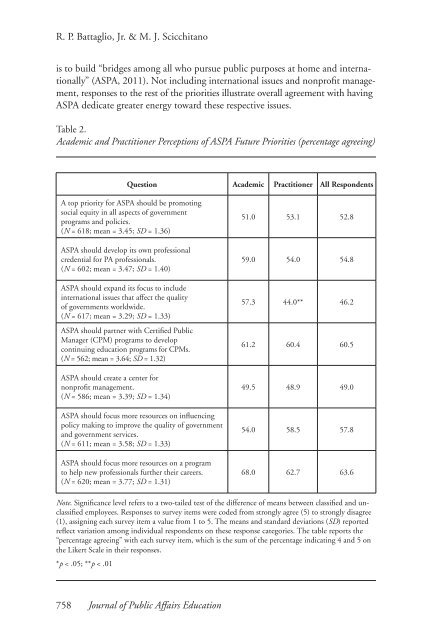
R. P. Battaglio, Jr. & M. J. Scicchitanois to build “bridges among all who pursue public purposes at home <strong>and</strong> internationally”(ASPA, 2011). Not including international issues <strong>and</strong> nonpr<strong>of</strong>it management,responses to the rest <strong>of</strong> the priorities illustrate overall agreement with havingASPA dedicate greater energy toward these respective issues.Table 2.<strong>Academic</strong> <strong>and</strong> <strong>Practitioner</strong> Perceptions <strong>of</strong> ASPA Future Priorities (percentage agreeing)Question <strong>Academic</strong> <strong>Practitioner</strong> All RespondentsA top priority for ASPA should be promotingsocial equity in all aspects <strong>of</strong> governmentprograms <strong>and</strong> policies.(N = 618; mean = 3.45; SD = 1.36)ASPA should develop its own pr<strong>of</strong>essionalcredential for PA pr<strong>of</strong>essionals.(N = 602; mean = 3.47; SD = 1.40)ASPA should exp<strong>and</strong> its focus to includeinternational issues that affect the quality<strong>of</strong> governments worldwide.(N = 617; mean = 3.29; SD = 1.33)ASPA should partner with Certified PublicManager (CPM) programs to developcontinuing education programs for CPMs.(N = 562; mean = 3.64; SD = 1.32)ASPA should create a center fornonpr<strong>of</strong>it management.(N = 586; mean = 3.39; SD = 1.34)ASPA should focus more resources on influencingpolicy making to improve the quality <strong>of</strong> government<strong>and</strong> government services.(N = 611; mean = 3.58; SD = 1.33)ASPA should focus more resources on a programto help new pr<strong>of</strong>essionals further their careers.(N = 620; mean = 3.77; SD = 1.31)51.0 53.1 52.859.0 54.0 54.857.3 44.0** 46.261.2 60.4 60.549.5 48.9 49.054.0 58.5 57.868.0 62.7 63.6Note. Significance level refers to a two-tailed test <strong>of</strong> the difference <strong>of</strong> means between classified <strong>and</strong> unclassifiedemployees. Responses to survey items were coded from strongly agree (5) to strongly disagree(1), assigning each survey item a value from 1 to 5. The means <strong>and</strong> st<strong>and</strong>ard deviations (SD) reportedreflect variation among individual respondents on these response categories. The table reports the“percentage agreeing” with each survey item, which is the sum <strong>of</strong> the percentage indicating 4 <strong>and</strong> 5 onthe Likert Scale in their responses.*p < .05; **p < .01758 Journal <strong>of</strong> Public Affairs Education
<strong>Building</strong> <strong>Bridges</strong>?The results from Tables 1 <strong>and</strong> 2 suggest a few significant differences betweenacademics <strong>and</strong> practitioners regarding ASPA services <strong>and</strong> priorities. However, furtherinvestigation is warranted to verify the importance <strong>of</strong> the academic-practitionerclassification as a significant predictor <strong>of</strong> respondent perceptions. Given the prominence<strong>of</strong> ASPA as the primary association for academic-practitioner outreach,the current survey presents an unprecedented opportunity to assess member perceptionsin light <strong>of</strong> other potential predictors. To further the discussion, multipleregression models were developed for the survey items in Tables 1 <strong>and</strong> 2, includingthe academic-practitioner orientation <strong>of</strong> members. Additionally, the models controlfor the effects <strong>of</strong> demographic variables, including tenure in ASPA, gender,age, education, <strong>and</strong> whether or not ASPA was the respondents’ primary association.The assumption is that services <strong>and</strong> priorities <strong>of</strong>fered by ASPA should be knowledgerelevant to generational (Newl<strong>and</strong>, 2000) <strong>and</strong> gender-related (Ospina & Dodge,2005b; Stivers, 2000) concerns.FindingsBecause the dependent variables used in this analysis are categorical (ordinal)variables <strong>and</strong> thus lack the continuous normal distribution assumed for ordinaryleast squares regression (OLS), logistic regression is used to account for the dichotomousnature <strong>of</strong> the dependent variables. From our review <strong>of</strong> Tables 1 <strong>and</strong> 2, itis apparent that the distributions are skewed. Those who responded to the LikertScale items regarding ASPA priorities <strong>and</strong> services were more likely to expresspositive attitudes. Indeed, for most <strong>of</strong> the items used, 50% or more responseswere positive, opting for response items 4 or 5 on the Likert Scale. Our literaturereview suggests that perceptions <strong>of</strong> academic-practitioner knowledge transfer,<strong>and</strong> more specifically ASPA services <strong>and</strong> priorities, are not regularly submitted toempirical testing or public opinion. This being the case, we must account for thefact that member attitudes are perhaps less “hard” <strong>and</strong> less likely to be preformedopinions (Alvarez & Brehm, 2002; Kumlin, 2001). Thus it would be misleadingto treat respondent perceptions toward ASPA services <strong>and</strong> priorities as nuancedas the Likert Scale suggests. Empirically speaking, it would be beneficial for ourlogistic regression to continue to treat the dependent variables as dichotomous.The logistic regression models in Tables 3 <strong>and</strong> 4 assess perceptions <strong>of</strong> ASPApriorities <strong>and</strong> services detailed earlier in Tables 1 <strong>and</strong> 2. The models included independentvariables for employment (academic), years in ASPA, gender, age, educationlevel, <strong>and</strong> whether ASPA was the respondent’s primary pr<strong>of</strong>essional association. 4The results <strong>of</strong> the logistic models examining the ASPA priorities <strong>and</strong> servicesare reported in Tables 3 <strong>and</strong> 4. The likelihood ratios (chi square, or Chi²) indicatethat the Table 3 models as a whole are statistically significant (excluding “Support<strong>and</strong> Recognition for Pr<strong>of</strong>ession”), indicating it is extremely unlikely that theseresults are due to chance. We have included the factor change in odds statistics—exp(b)—for a more substantive assessment <strong>of</strong> the effects <strong>of</strong> the logistic model.Inclusion <strong>of</strong> the exp(b) scores allows us to interpret the odds <strong>of</strong> observing a positiveJournal <strong>of</strong> Public Affairs Education 759