SpectraTrend HT User Manual - HunterLab
SpectraTrend HT User Manual - HunterLab
SpectraTrend HT User Manual - HunterLab

Create successful ePaper yourself
Turn your PDF publications into a flip-book with our unique Google optimized e-Paper software.
<strong>SpectraTrend</strong> ® <strong>HT</strong><strong>User</strong>’s <strong>Manual</strong>A60-1014-954<strong>Manual</strong> Version 3.1Hunter Associates Laboratory11491 Sunset Hills RoadReston, Virginia 20190, USAwww.hunterlab.comAn ISO 9001:2008 Certified Company
<strong>SpectraTrend</strong> <strong>User</strong>'s GuideCopyrights and TrademarksThis documentation contains proprietary information of Hunter Associates Laboratory, Inc. Itsreproduction, in whole or in part, without the express written consent of Hunter AssociatesLaboratory, Inc. is prohibited.LUCITE is a trademark of ICI Acrylics Inc.Windows is a registered trademark of Microsoft Corporation.EasyMatch and <strong>SpectraTrend</strong> are registered trademarks of Hunter Associates Laboratory, Inc.iii
<strong>SpectraTrend</strong> <strong>User</strong>'s GuideSafety NotesFor your safety when using the <strong>SpectraTrend</strong> <strong>HT</strong>, you should pay particular attention to thefollowing types of statements in this <strong>User</strong>’s <strong>Manual</strong>. Each description is shown in itsrepresentative typeface.Notice: General safety instruction that should be observed at all times while operatingthe instrument.CAUTIONSpecific safety instruction critical to the type of instrument operation being explained inthe area of the manual where the caution appears.Note: Additional clarification of instructions, not safety-related.iv
<strong>SpectraTrend</strong> <strong>User</strong>'s GuideTABLE OF CONTENTSCHAPTER 1 - INTRODUCTION TO YOUR SPECTRATREND <strong>HT</strong>........................... 1-11.1 Product Applications and Key Features ..................................................................................... 1-11.2 System Components ..................................................................................................................... 1-31.2.1 System Components............................................................................................................ 1-31.2.2 The Slide-On <strong>Manual</strong> Calibrator ........................................................................................ 1-41.2.3 The Metal Support Unit ...................................................................................................... 1-41.2.4 Power Cords (110V and 220v) ........................................................................................... 1-51.2.5 Communications ................................................................................................................. 1-51.3 Additional Components and Accessories ................................................................................... 1-61.3.1 Table Top Stand & TriColor Stack Light ........................................................................... 1-71.3.2 The Computer ..................................................................................................................... 1-71.4 The Basics of <strong>SpectraTrend</strong> Operation ...................................................................................... 1-91.4.1 The Button Pad and LCD Display ...................................................................................... 1-91.4.2 Menus and Prompts............................................................................................................. 1-91.5 About Your Instrument ............................................................................................................. 1-10CHAPTER 2 - INSTALLATION ..................................................................................... 2-12.1 Mounting the <strong>SpectraTrend</strong> Sensor ............................................................................................ 2-12.2 Presentation of the product to the sensor ................................................................................... 2-12.2.1 Access to the sensor ............................................................................................................ 2-12.2.2 Sensor environment ............................................................................................................ 2-12.2.3 Clearance for plant maintenance ......................................................................................... 2-12.3 Connecting the <strong>SpectraTrend</strong> Sensor ......................................................................................... 2-12.4 The Metal Support Unit ............................................................................................................... 2-22.4.1 Support Unit Environment: ................................................................................................. 2-22.5 The Slide-On Calibrator .............................................................................................................. 2-32.6 The EasyMatch OL ST Software ................................................................................................ 2-42.7 The Computer ............................................................................................................................... 2-42.8 <strong>SpectraTrend</strong> <strong>HT</strong> Installation Drawings .................................................................................... 2-4CHAPTER 3 - PRODUCT SETUP .................................................................................. 3-13.1 Setup Parameters for the Front Panel Display .......................................................................... 3-13.2 Product Setups .............................................................................................................................. 3-13.2.1 Product Name Setup ........................................................................................................... 3-33.2.2 Product Standards ............................................................................................................... 3-43.2.3 Average ............................................................................................................................... 3-63.2.4 Views .................................................................................................................................. 3-73.2.5 Standard Values ................................................................................................................ 3-133.2.6 Tolerances ......................................................................................................................... 3-153.2.7 AutoSearch ........................................................................................................................ 3-18v
<strong>SpectraTrend</strong> <strong>User</strong>'s Guide3.2.8 Global Options .................................................................................................................. 3-193.2.9 Run Configuration ............................................................................................................ 3-233.3 Setup Parameters for EasyMatch OL-ST Software ................................................................ 3-293.3.1 Product Setup .................................................................................................................... 3-313.3.2 Product Standard, Tolerances and Corrections ................................................................. 3-34CHAPTER 4 - OPERATION ........................................................................................... 4-14.1 Standardization Using the Front Panel Display ........................................................................ 4-14.2 Taking Readings ........................................................................................................................... 4-44.3 Reading Individual Samples ........................................................................................................ 4-44.4 Reading With Averaging.............................................................................................................. 4-74.5 Run Mode Operation ................................................................................................................. 4-10CHAPTER 5 – DIAGNOSTICS ....................................................................................... 5-15.1 White Tile Repeatability .............................................................................................................. 5-15.2 Green Tile Check .......................................................................................................................... 5-25.3 Signal Levels .................................................................................................................................. 5-45.4 Distance Sensor ............................................................................................................................. 5-55.5 Self Test ..................................................................................................................................... 5-6CHAPTER 6 - MAINTENANCE ..................................................................................... 6-16.1 Routine Maintenance Schedule ................................................................................................... 6-16.2 System Warm-Up ......................................................................................................................... 6-16.3 Cleaning the Sensor ...................................................................................................................... 6-26.4 Cleaning the Instrument Standards ............................................................................................ 6-26.5 Replacing the Fuses ...................................................................................................................... 6-2CHAPTER 7 - SPECIFICATIONS .................................................................................. 7-17.1 Physical Characteristics ............................................................................................................... 7-17.2 Environmental .............................................................................................................................. 7-17.3 Electrical Characteristics ............................................................................................................. 7-27.4 Input/Output (I/O) ........................................................................................................................ 7-27.5 Conditions of Illumination and Viewing .................................................................................... 7-27.5.1 Illumination ......................................................................................................................... 7-27.5.2 Viewing ............................................................................................................................... 7-2CHAPTER 8 - INSTRUMENT REPLACEMENT, REPAIR, PROBLEMS ANDQUESTIONS .................................................................................................................... 8-18.1 Warranty ..................................................................................................................................... 8-18.2 Shipping Claims ............................................................................................................................ 8-18.3 Breakage or Damage .................................................................................................................... 8-1vi
<strong>SpectraTrend</strong> <strong>User</strong>'s Guide8.4 Freight or Express ........................................................................................................................ 8-28.5 Parcel Post Shipment ................................................................................................................... 8-28.6 United Parcel Service ................................................................................................................... 8-28.7 Shortage ..................................................................................................................................... 8-28.8 Incorrect Shipment ....................................................................................................................... 8-38.9 Returns ..................................................................................................................................... 8-3vii
<strong>SpectraTrend</strong> <strong>User</strong>'s GuideChapter 1 - INTRODUCTION TO YOUR SPECTRATREND <strong>HT</strong>The <strong>SpectraTrend</strong> <strong>HT</strong> is the newest in <strong>HunterLab</strong>’s versatile and cost-effective on-line colormeasurement instruments. The <strong>SpectraTrend</strong> <strong>HT</strong> is a continuous, online, non-contact color, andheight measurement instrument. Designed for use in production environments, the <strong>SpectraTrend</strong><strong>HT</strong> uses LED sample illumination technology to measure and monitor color on the productionline. Like a bench spectrophotometer, the instrument can output both colorimetric and spectralvalues for the visible spectrum, along with a measurement of product height. Production runs aremonitored continuously, from beginning to end, to identify color variation and out-of-specproduct, without contact or intrusion.1.1 Product Applications and Key Features<strong>SpectraTrend</strong> <strong>HT</strong> takes real-time color measurements of products of virtually any size,and in industries as diverse as paint, food, building products and industrial minerals.Current applications include:• Building Products -- glass, siding, plastic, lumber, insulation and roofing.• Food -- processed, baked, fried, and roasted.• Paint -- coated aluminum and steel• Paper -- lightweight low opacity paper, coated board, fine paper, andcolored/white paper• Plastic -- pellets, film, and extruded sheet products.• Textile -- denim dyeing, automotive fabric, carpet, dyeing/finishing andcontinuous dyeing for apparel fabrics.• Other – crushed stone, fertilizer.This instrument functions optimally when used to measure color differences betweensamples and an ideal product standard. Table 1 lists the key features and benefits of thedevice.Introduction 1-1
<strong>SpectraTrend</strong> <strong>User</strong>'s GuideTable 1: <strong>SpectraTrend</strong> <strong>HT</strong> Features and BenefitsFeatures Description BenefitsSpectrometerSolid state 256 element diodearray, concave holographicgratingTrue dual beam spectrophotometer for on-lineapplications with optimal agreement with bench topcolor instruments.Spectral Range/dateoutput400-700nm/10nm output Spectral values output over full range.Wavelength Resolution:bandpass
<strong>SpectraTrend</strong> <strong>User</strong>'s Guide1.2 System ComponentsThe following sections provide a brief description of the <strong>SpectraTrend</strong> <strong>HT</strong> basic systemcomponents. Numbered images of each system component are located at the end ofChapter 1. Please refer to Chapter 2 for installation instructions.1.2.1 System ComponentsThe <strong>SpectraTrend</strong> <strong>HT</strong> sensor (Figure 1-6) head is housed in a National ElectricalManufacturers Association (NEMA) 4/Ingress Protection Rating (IP) 66 enclosure and isdesigned to be mounted above the product. The sensor monitors the product and sendscolor and height information to the fixed terminal, EasyMatch OL ST software, or otherexternal device. The sensor does not need to make direct contact with the product. Thesensor window should be located at least 2.5 inches (63.5 mm) and not more than 4.5inches (114.3 mm) from the product.a. How the Sensor WorksThe color-monitoring process is controlled by a microprocessor. Measurements are takenat a frequency of approximately 5 Hz using a solid-state, LED illumination and detectionsystem.The light illuminating the product is produced by 4 LEDs: 2-white, 1-cyan (499nm), and1- UV (402nm). The LEDs produce light in the visible region of the electromagneticspectrum. The light is directed toward the product, and a relay lens gathers the reflectedlight and transmits it to the spectrophotometer. Each light source is switched on withmodulation at a preset frequency. In addition to the LED light source(s), there is areceiving lens and a detector in the sensor.The receiving lens collects light diffusely reflected from the product and focuses it onto aposition-sensitive spectrophotometer. The information from the detector is then used forcalculation of colorimetric data. A separate Laser detector also provides signals fromwhich the distance from the sensor window to the top of the product being measured iscomputed via optical triangulation. This information is converted so that the height ofthe product itself is displayed. The distance is also used to calculate a mathematicalcompensation for the way in which the reflected color signal changes when the productposition varies.NOTE: The minimum reflectance that the laser detector on thisinstrument can detect is about 15%. Therefore, it is not recommendedfor height compensated measurement of black or near-black samples.Introduction 1-3
<strong>SpectraTrend</strong> <strong>User</strong>'s Guide1.2.2 The Slide-On <strong>Manual</strong> CalibratorThe slide-on calibrator (Figure 1-1) allows easy installation and removal of thestandard tiles. It slides onto the track under the sensor window to allow consistentand accurate placement of the standard tile during standardization.The calibrated values for the white tile and green tile, in XYZ using D65/10°, arerecorded on the front of the calibrator as shown below in Figure 1-2. These tilevalues are traceable to reflectance standards held at the National PhysicalLaboratory (England) and the National Institute of Standards and Technology[N.I.S.T.] (U.S.A.).Figure 1-1. Slide on CalibratorFigure 1-2. Calibrated Values for the Slide-On Calibrator1.2.3 The Metal Support UnitHoused in a NEMA 4/IP66 enclosure with a hinged cover the metal support unit providesDC power to the sensor. Various communications options are also accessible at thesupport unit if installed.1-4
<strong>SpectraTrend</strong> <strong>User</strong>'s Guide1.2.4 Power Cords (110V and 220v)Figure 1-3. Power Cords for the <strong>SpectraTrend</strong> <strong>HT</strong>1.2.5 Communicationsa. Ethernet Communications CableTwenty meters of Ethernet cable are provided for communication between the sensorand the personal computer. An optional digital output for Pass, Warning, and Failstack light is available.b. System Power I/O CableThirty meters of System Power I/O cable are provided for connection between themetal support unit and the sensor. Additional lengths of extension cable may bepurchased separately.c. EasyMatch® OL-STThe EasyMatch OL-ST Software is designed to run on a standard personal computerrunning Windows. The software allows the user to enter instructions to the sensorusing the keyboard and mouse. The computer monitor then displays all results,prompts, and diagnostics messages.The EasyMatch OL ST software allows you to perform the following <strong>SpectraTrend</strong><strong>HT</strong> functions:• Select product setups,• Modify product setup parameters, and• Save readings and event information to a file.The computer monitor shows the product name, the height of the product or the colorindex, a trend plot illustrating the differences between samples and a productstandard.Introduction 1-5
<strong>SpectraTrend</strong> <strong>User</strong>'s Guide1.3 Additional Components and AccessoriesThere are also various optional components/add-ons available for purchase for use withyour <strong>SpectraTrend</strong>. <strong>HunterLab</strong> part numbers are provided for each item listed below foryour convenience in ordering.Table 2. <strong>SpectraTrend</strong> AccessoriesAccessory Part No. FunctionTri-Color Light Stack L02-1014-761 Green, amber and red LED lights indicate “intolerance”,“out-of-tolerance” or “in-warning” range.Includes 30m unterminated cable.Table Stand D02-1014-893 Enables optical sensor to be used as a bench-topinstrument in a laboratory environment.Computer and Monitor COMPUTER Windows® Computer to run the system.Ink Jet Color Printer and A13-1005-721 To connect to the computer.Cable4 Channel Analog Output L02-1014-757 Individually isolated 4-20mA analog outputs forKitconnection to PLC devices.Glass Sensor Window Kit D02-1014-745 Replacement window for use in environmentsunsuitable for the standard polycarbonate window.Sensor Window Monitor D02-1014-603 Automatic white tile measurement indicates sensorCalibration Box,replacementCables, extra lengthD02-1014-730Call for infowindow is free of debris.<strong>Manual</strong> Slide-on with black, white and check tileposition indicators.<strong>HunterLab</strong>, 11491 Sunset Hill Road, Reston, Virginia 20190703-471-6870 www.hunterlab.comsales@hunterlab.com or info@hunterlab.com1-6
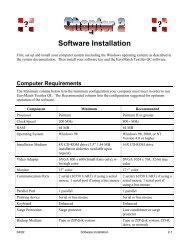
<strong>SpectraTrend</strong> <strong>User</strong>'s Guide1.3.1 Table Top Stand & TriColor Stack LightFigure 1-4. Table Top StandFigure 1-5. Tricolor Stack Light1.3.2 The ComputerA personal computer is available for those systems running the utility software. Modelsand configurations may vary; refer to the computer documentation for more information.a. Computer RequirementsThe Table 3 lists the minimum configuration your computer must meetin order to run the utility software. The Recommended column lists the configurationsuggested for optimal operation of the software. The minimum system willoperate, but performance may be hampered.Introduction 1-7
<strong>SpectraTrend</strong> <strong>User</strong>'s GuideTable 3: Computer RequirementsComponent Minimum RecommendedProcessor32-bit (x86) or 64-bit 32-bit (x86) or 64-bit (x64)(x64)Clock Speed 1 Gz 1GHz +RAM 2 GB 4 GB+Operating SystemWindows XP WindowsXP ProfessionalProfessionalor Windows 7 ProfessionalInstallation Medium CD-ROM drive 16x CD-ROM driveVideo Adapter SVGA SVGA or higherMonitor 19” color 19” color or largerCommunication Ports Ethernet EthernetPointing DeviceSerial bus, or USB Serial bus, or USB mousemouseKeyboard Enhanced EnhancedSurge Protection Surge protector Line conditioner or surgeprotectorBackup Medium 50 GB Harddrive Network backup-In addition, 1G of free space is required on the installation disk for initial installation.Additional hard drive space will be required for saving data files.1-8
<strong>SpectraTrend</strong> <strong>User</strong>'s Guide1.4 The Basics of <strong>SpectraTrend</strong> Operation1.4.1 The Button Pad and LCD DisplayThe five buttons on the button pad can be loosely defined as the left, right, up, and downbuttons, with the “Go” (lightning bolt) button located to the right of the arrows. Inactuality, however, these buttons perform slightly different functions depending on thecurrent operation. Consult the miniature map of the button pad shown at the bottom ofthe LCD display for the relevant definitions of the buttons at any particular time.Figure 1-6. <strong>SpectraTrend</strong> <strong>HT</strong> SensorFigure 1-7. Button Keypad for the <strong>SpectraTrend</strong> <strong>HT</strong>1.4.2 Menus and PromptsAll <strong>SpectraTrend</strong> <strong>HT</strong> functions may be accessed through its main menu. The main menucommands lead to prompts (such as for standardization and reading), setup screens (forproduct setup and global options), or an additional menu (such as the Diagnostics, SavedReadings, and Setup Maintenance choices), depending on the function requested.When Return is shown as an available button command on the main menu screen, youmay choose Return to go back to the last screen used before the instrument shut down.Introduction 1-9
<strong>SpectraTrend</strong> <strong>User</strong>'s GuideWhen “Off” is shown as an available button command on the main menu screen, youmay choose “Off” to immediately turn the instrument off.1.5 About Your InstrumentInformation specific to your instrument may be viewed on the About Your Instrumentscreen, which can be obtained by choosing About from the main menu. The LCD Screendisplays the model, serial number, firmware version, and total flash count for yourinstrument.More details on <strong>SpectraTrend</strong> <strong>HT</strong> operation are given in Chapters 2 through 4.1-10
<strong>SpectraTrend</strong> <strong>User</strong>'s GuideChapter 2 - INSTALLATION2.1 Mounting the <strong>SpectraTrend</strong> SensorThe sensor box is equipped with a mounting plate which can be used to mount the sensorin a variety of ways. The sensor must be installed in accordance with the applicable<strong>HunterLab</strong> installation drawing, which is included at the end of this chapter for reference.The following factors, as well as the details shown in the installation drawing, should beconsidered in making this installation.2.2 Presentation of the product to the sensorThe sensor must be located where it can view the product in a stable conditionrepresentative of the product color. If the product is carried on a flexible belt conveyer, thesensor should be located at or close to a point where the conveyer is supported from below.The sensor window must be located 2.5 to 4.5 inches (63.5-114.3 mm) from the product,with the optimum distance being 3.5 inches (88.9 mm).2.2.1 Access to the sensorIt will be necessary to have physical access to the sensor for standardization andmaintenance at regular intervals, so convenient access should be available.2.2.2 Sensor environmentWhile the sensor is rugged and sealed, accumulated contamination on the sensor windowwill eventually degrade performance. The more contaminants to which the sensor issubjected (dust, oil, crumbs, etc.), the more frequently it will need to be cleaned tomaintain performance. The ambient air temperature and relative humidity must remainwithin the intervals specified in Chapter One. The sensor window must not be facing intoany type of bright light.2.2.3 Clearance for plant maintenanceThe sensor and mount should be sited so that they are neither in the way nor vulnerableduring plant maintenance.Notice: Welding near the <strong>SpectraTrend</strong> <strong>HT</strong> system can cause damage to the sensor andwill void your warranty.2.3 Connecting the <strong>SpectraTrend</strong> SensorInsert the black round connector-end of the grey 24V I/O System Cable (as shown inFigure 2-1) into the round pronged slot located on the top side of the sensor. Align theholes on the I/O cable connector with the prongs on the sensor to connect.Installation 2-1
<strong>SpectraTrend</strong> <strong>User</strong>'s Guide2.6 The EasyMatch OL ST SoftwareInstall the utility software as follows:Insert the installation CD into your CD-ROM drive. Navigate to the EasyMatch OL STfolder and select the EasyMatch OL ST Unicode.exe to begin installation of the Software.Follow the prompts to complete the installation.Open EasyMatch OL ST software by selecting the EasyMatch OL ST icon on the desktopor by selecting it from the Program Files/<strong>HunterLab</strong> using the Windows Start Menu. Thedefault user name is ‘Admin’. The default password is ’hunterlab’.2.7 The ComputerAccess to the computer, monitor, keyboard, and mouse: Routine operation requiresobservation of displays on the monitor, use of the keyboard and mouse, and access to thedisk drives for routine file backups. Thus, the location and height of the computer,monitor, keyboard, and mouse should be convenient.Environment: The supervisory computer is a standard, non-hardened system, andrequires a normal computer environment. The ambient temperature around the computerand monitor must be between 15° C (59° F) and 30° C (86° F).Proximity of the computer to the support unit: The computer must not be any fartherfrom the support unit than the length of the cable connecting the two.2.8 <strong>SpectraTrend</strong> <strong>HT</strong> Installation DrawingsAll the installation drawings relevant to the <strong>SpectraTrend</strong> <strong>HT</strong> system, including its variousconfigurations and options, are listed and shown in the next few pages.2-4 Installation
<strong>SpectraTrend</strong> <strong>User</strong>'s GuideInstallation 2-5
2-6 Installation<strong>SpectraTrend</strong> <strong>User</strong>'s Guide
<strong>SpectraTrend</strong> <strong>User</strong>'s GuideInstallation 2-7
2-8 Installation<strong>SpectraTrend</strong> <strong>User</strong>'s Guide
<strong>SpectraTrend</strong> <strong>User</strong>'s GuideChapter 3 - PRODUCT SETUPA product setup defines the operation of the system for a specific product. Up to 250 productsetups may be saved in the sensor memory.The most obvious parameters that need to be defined are the color scale, standard color valuesfor the product, and the acceptable tolerances applied to those standard values. In addition,operating parameters must be defined. These parameters are described in the rest of this chapter.Product setup is performed using the button pad and the LCD front panel display on the<strong>SpectraTrend</strong> <strong>HT</strong> Sensor Head or the EasyMatch OL ST software. Product setups can be createdand modified only when the system is in Product Setup mode. Color measurements cannot bemade while you are working on a product setup. For this reason, product setup maintenanceshould be done during periods when measurements are not necessary.3.1 Setup Parameters for the Front Panel DisplayUPLEFTGOFigure 3-1. Button PadOperationRIG<strong>HT</strong>DOWN3.2 Product SetupsSelect Product Setup from the Main Menu by moving the green cursor highlight to thePRODUCT SETUP position using the up and down arrow buttons on the button pad.Then press the GO button on the button pad.Product Setups 3-1
<strong>SpectraTrend</strong> <strong>User</strong>'s GuideFigure 3-2. Product SetupThe Product Setup screen appears and asks “Do you want to select the setup toconfigure?” You can choose from either YES to select the product setup from a listby pressing the up arrow button or NO to configure the last setup used by pressingthe down arrow button.Figure 3-3. Product Setup ScreenIf YES is chosen, the Select setup to configure screen is shown. Move the cursorhighlight to the position of the setup you wish to configure using the up and downarrow buttons or by scrolling through the pages using the right arrow button forPAGE. Then press the GO button to select it.3-2 Product Setups
<strong>SpectraTrend</strong> <strong>User</strong>'s GuideFigure 3-4. Select Setup to ConfigureThe screen that allows you to configure the setup selected (or the last setup used ifyou chose not to select a setup) appears next. You can choose from NAME,STANDARD, AVERAGE, VIEWS, STANDARD VALUES, TOLERANCES,AUTOSEARCH, and RUN CONFIG.Configure each desired parameter by moving the cursor highlight to its position usingthe up and down arrow buttons. When the parameter is highlighted, press the rightarrow button to scroll through the available choices for the parameter. When thedesired choice is displayed, stop scrolling. You may then move on to configure moreparameters in the same manner, if desired.When all parameters are as desired, press the GO (MAIN MENU) button to acceptthe settings and return to the main menu or left arrow (BACK) to select another setupto configure.The product setup parameters that may be configured are as follows:3.2.1 Product Name SetupPress the right arrow button to obtain the Product Name screen on which you may enterany descriptive name for the product setup. Up to 15 characters may be entered using allthe letters and numbers, as well as the space character. Select “NAME” by pressing rightarrow button. You will then be directed to the Product NAME Screen.Product Setups 3-3
<strong>SpectraTrend</strong> <strong>User</strong>'s GuideFigure 3-5. Product Name SetupUse the button pad map displayed on the bottom of the screen as a guide for ProductName setup. Push the up and down arrow buttons to scroll up (+) and down (-) throughthe list of available characters. Select NEXT using the right arrow button to enter thenext character in the name. Press the GO button to add a space between characters. SelectDONE using the left arrow button when finished. This will now take you back to theProduct Setup Screen with the chosen Product Name displayed on the NAME line.Note: There is no backspace command. In order to get rid of unwanted spaces return tothe first position in the name field and re-enter the chosen name by pressing the rightarrow button. To delete a character use the right arrow button to select (highlight) thedesired character and then press the GO (SPACE) button. To scroll through the namefield/box to go back to the beginning or the desired position press the right arrow button.3.2.2 Product StandardsFour types of standards are available: Ad Hoc, Numeric, Hitch, and Physical. To selectyour standard press the right arrow key.3-4 Product Setups
<strong>SpectraTrend</strong> <strong>User</strong>'s GuideChoose AD HOC when you wish to use the first measurement value as the standard.This setting is useful if the standard values are unknown or you need the trendingmeasurement values from the beginning of the Run. Please note: measurement valuesfrom the previous Run are overwritten/lost for each subsequent Run using this standard.Figure 3-6. Product Setup & Ad Hoc Standard TypeChoose NUMERIC when an actual product specimen is not available for measurementbut you know the target color values taken from previous measurements of the productspecimen. The color values for a numeric standard are entered and stored in the productsetup for as long as desired.Figure 3-7. Product Setup & Numeric Standard TypeChoose HITCH when you wish to alter the readings made on the <strong>SpectraTrend</strong> <strong>HT</strong> tobetter correlate to another color measurement instrument. A specific standard withknown color values from the reference instrument are read with the <strong>SpectraTrend</strong> <strong>HT</strong>.The reading is stored in the product setup with the known color values from thereference instrument. In this way the instruments are “hitched” together. Themodified standard is stored in the product setup for as long as desired.Product Setups 3-5
<strong>SpectraTrend</strong> <strong>User</strong>'s GuideFigure 3-8. Product Setup & Hitch Standard TypeChoose PHYSICAL when an actual product specimen is available and represents yourtarget color. Use the target color values of the product specimen to compare to the colorvalues of your samples. A physical standard is measured and stored in the product setupfor as long as desired.Figure 3-9. Product Setup & Physical Standard Type3.2.3 AverageNOTE: The average is only available for READ Mode. When using the RUN mode,this option setting is ignored.Select OFF if you wish to make only one reading of each standard and sample whenusing the manual READ mode. If you would instead like to average several readingsinto a single measurement when using the READ mode, indicate the number ofreadings to be averaged, up to 20.Press the right arrow button to move through the list of available choices.3-6 Product Setups
<strong>SpectraTrend</strong> <strong>User</strong>'s GuideFigure 3-10. Product Setup & Average3.2.4 ViewsNOTE: During a RUN the Display is locked to Absolute or Difference Mode. SpectralData, Spectral Difference, Spectral Plot, Diff Plot, and Color Plot are ONLY availablewhen using the READ menu. When using the RUN mode, this option setting is ignored.The VIEWS setting allows you to specify the type of data to display on the<strong>SpectraTrend</strong> <strong>HT</strong>’s LCD screen after taking a measurement.Figure 3-11. Product Setup & ViewsPress the right arrow button to obtain the Data VIEWS screen.Up to eight different views may be displayed. Use the UP and DOWN arrow buttons tomove to the View parameter, then toggle between ENABLED (view on) andDISABLED (view off) using the right arrow button. NOTE: View 1 is alwaysautomatically enabled and may not be disabled.Product Setups 3-7
<strong>SpectraTrend</strong> <strong>User</strong>'s GuideFigure 3-12. Data View EnabledDisplay: Use the down arrow button to move down to the Display parameter, and thenscroll through your choices using the right arrow button.In RUN Mode the display will only show the Absolute or Difference.Display: Absolute displays the raw color scale values (such as L, a, and b) for the mostrecent standard or sample read.Display: Difference displays the most recent sample read in comparison to thestandard and the difference in color between them (such as dL, da, db).Figure 3-13. Data View Absolute & DifferenceIn READ Mode, any of the following additional views discussed below may be enabledunder different views.Display: Spectral Data displays the raw reflectance values for each wavelength readby the instrument for the most recent standard or sample.3-8 Product Setups
<strong>SpectraTrend</strong> <strong>User</strong>'s GuideFigure 3-14. Spectral Data ViewDisplay: Spectral Difference displays the difference between the standard and themost recent sample read in raw reflectance values for each wavelength read by theinstrument.Figure 3-15. Spectral Difference ViewDisplay: Spectral Plot displays the raw reflectance values for each wavelength readby the instrument to be plotted for the most recent standard or sample.Figure 3-16. Spectral Plot ViewProduct Setups 3-9
<strong>SpectraTrend</strong> <strong>User</strong>'s GuideDisplay: Diff Plot displays the difference between the standard and the most recentsample read to be plotted in raw reflectance values for each wavelength read by theinstrument.Figure 3-17. Difference Plot ViewDisplay: Color Plot displays the sample’s location in color space relative to thestandard, plotted in the center of the a-b and L plots.Figure 3-18. Color Plot ViewIll/Obs. Choose the illuminant/observer combination under which color values will becalculated. Use the down arrow button to move down to the ILL/OBS parameter, thenscroll through your choices using the right arrow button.3-10 Product Setups
<strong>SpectraTrend</strong> <strong>User</strong>'s GuideFigure 3-19. Illuminant/Observer Data ViewThe available choices are A/2, C/2, D50/2, D55/2, D65/2, D75/2, F2/2, F7/2, F11/2,A/10, C/10, D50/10, D55/10, D65/10, D75/10, F2/10, F7/10, and F11/10.Refer to the “Measurement Values” chapter for a more detailed description of eachilluminant and observer.Color Scale. Choose the color scale you wish to see. Use the down arrow button to movedown to the Color Scale parameter, then scroll through your choices using the rightarrow button.Figure 3-20. Color Scale Data ViewThe available choices are L*a*b*, L*C*h, L a b, X Y Z, Y x y, dLdCdH and [none]. Ifthe display type chosen is Difference, the color scale will be expressed on the readscreen as dXdYdZ, dYdxdy, dLdadb, dL*da*db*, or dL*dC*dh instead. Note:dLdCdH is available only with Difference display type.Refer to the “Measurement Values” chapter for a description of each color scale.Product Setups 3-11
<strong>SpectraTrend</strong> <strong>User</strong>'s GuideColor Index. Choose the color index you wish to see. Use the down arrow button to movedown to the Color Index parameter, then scroll through your choices using the rightarrow button.Figure 3-21. Color Index Data ViewChoices include: Y, YID, YIE, WIE, Tint, Z%, 457B, BCU, SMA, SW, GSC, GSS,dE*, dEc, dE, dC*, dC, SSN, and MI. If the display type chosen is Difference, the colorindex may be expressed on the read screen as a difference value, such as dY, dYIE,dWIE, etc. instead. The choice of (...) [none] is also available.Some indices may not display until both a standard and a sample are read.Refer to the “Measurement Values” chapter for a description of each color index.CMC/Shade Sort. The CMC/Shade Sort parameter applies only if the color index chosenis dEc or SSN. Use the down arrow button to move down to the CMC/Shade Sortparameter, then press the right arrow button to obtain the CMC/Shade Sort screen.Figure 3-22. CMC/Shade Sort Data View3-12 Product Setups
<strong>SpectraTrend</strong> <strong>User</strong>'s GuideAs shown on the button pad map at the bottom of the screen, use the up and downarrow buttons to scroll up (+) and down (-) through the numbers for the digit that iscurrently highlighted. Press the right arrow button (NEXT) to move to the next digit inthe value and then to move from the commercial factor to the l:c ratio and then to theShade Blocks. Press the left arrow button (DONE) when the needed values have beenentered.Figure 3-23. CMC Parameters EntryRefer to the “Measurement Values” chapter for a description of each the CMC indexvalues and the definition of shade blocks.Press the LEFT arrow button (BACK ) twice to return to the Product Setup screen.3.2.5 Standard ValuesThe Standard Values parameter is only relevant when the Standard Type is physical,numeric, or hitch. When the Standard Values parameter is highlighted, press the rightarrow button to move to the Standard Values configuration screen.Product Setups 3-13
<strong>SpectraTrend</strong> <strong>User</strong>'s GuideFigure 3-24. Standard Values SetupFor a PHYSICAL standard, place the standard under the sensor window at a validdistance and press the GO button (READ) to read the standard and place itsmeasurement values (in the selected color scale) in the product setup. When complete,press the LEFT arrow button (DONE) to return to the product setup screen.Figure 3-25. Entering Standard ValuesFor a NUMERIC standard, change the highlighted digit of the selected color scalevalue using the up and down arrow buttons. When the desired digit is shown, pressNEXT to move to the next digit. When all digits are entered, press DONE to return tothe product setup screen.3-14 Product Setups
<strong>SpectraTrend</strong> <strong>User</strong>'s GuideFigure 3-26. Reading Standard ValuesFor a HITCH standard, place the hitch standard (with known values from a referenceinstrument) at the sample port and press the GO button (READ) to read the standardand place its measurement values (in the selected color).3.2.6 TolerancesWhen Tolerances is highlighted, press the right arrow button to move to the Tolerancesconfiguration screen, on which you may set tolerances in the chosen color scale andcolor index.Figure 3-27. Tolerances SetupThere are 3 sets of Tolerances that may be selected: Color Tracking (if enabled), AlarmLimits, and Alert Limits.Color Tolerances: Color Tracking. Choose whether color tracking is enabled bysetting the tolerances. When all tolerance values are set to zero, the color trackingfeature is disabled. When Color Tracking is enabled, (a non-zero value is set) productwill only register as present if the measured color is within the preset range (in absolutemode) or within a tolerance band of the target color (in difference mode). In this case,the number of valid color readings per sample measurement interval will be displayedProduct Setups 3-15
<strong>SpectraTrend</strong> <strong>User</strong>'s Guidein the upper left hand corner of the display for the current sample measurement. If thevalue of the valid samples per measurement is zero, no product is being measured.Figure 3-28. Enter the Color Tracking TolerancesChange the highlighted digit of the selected color scale tolerance value using the UPand DOWN arrow buttons. When the desired digit is shown, press the RIG<strong>HT</strong> arrowbutton (NEXT) to move to the next digit. To scroll to the desired position, hold downthe RIG<strong>HT</strong> arrow button. When all digits are entered, press the LEFT arrow button(DONE) to return to the tolerances screen.Color Tolerances: Alarm Limits. Use the DOWN arrow button to move down tothe alarm limits parameter, then press the RIG<strong>HT</strong> arrow button to obtain the alarmlimits screen. The alarm limit is a color value or color difference value beyond whichvalues are considered out of tolerance. In tolerance values are reported in black. Thealarm state is indicated by the color values returning to those of the product standardand the product height changing to 0.00. Prior to the hold time elapsing, the colorvalues are reported in black with a red background to indicate that the alarm limit hasbeen exceeded. Change the highlighted digit of the selected color scale tolerance valueusing the UP (+) and DOWN arrow buttons. When the desired digit is shown, press theRIG<strong>HT</strong> arrow button (NEXT) to move to the next digit. To scroll to the desiredposition, hold down the RIG<strong>HT</strong> arrow button. When all digits are entered, press LEFTarrow button (DONE) to return to the tolerances screen. To disable this feature set alltolerance values to zero.3-16 Product Setups
<strong>SpectraTrend</strong> <strong>User</strong>'s GuideFigure 3-29. Entry of Alarm LimitsColor Tolerances: Alert Limits. Use the down arrow button to select alert limitsand then press the right arrow key to display the alert limits configuration screen. Thealert limit is a color value or color difference value beyond which an alert, or caution, isgiven that the samples being read are close to being out of tolerance. The alert state isindicated by the color values being reported in black with a yellow background on themeasurement screen. To disable this feature set all tolerance values to zero. Changethe highlighted digit of the selected color scale tolerance value using the up and downarrow buttons. When the desired digit is shown, press the right arrow button (NEXT)to move to the next digit. To scroll to the desired position, hold down the right arrowbutton. When all digits are entered, press LEFT arrow button (DONE) to return to theTolerances screen. To return to the Product Setup screen press the LEFT arrow buttontwice.Product Setups 3-17
<strong>SpectraTrend</strong> <strong>User</strong>'s GuideFigure 3-30. Entry of Alert Limits3.2.7 AutoSearchNOTE: This feature only applies to READ mode. In RUN mode, this feature isdisabled.Press the right arrow button to toggle between YES and NO.Select YES if you wish to include this product setup when using the automatic standardsearching feature, which transfers you to the most appropriate product setup (based onthe standard’s color values) each time a sample is read. Select NO if you do not whichto include this product setup in automatic standard searching.3-18 Product Setups
<strong>SpectraTrend</strong> <strong>User</strong>'s GuideFigure 3-31. Automatic Standard SearchPress the LEFT arrow button (Back) to accept the parameters just set and select anotherProduct Setup to configure or the GO button (Main Menu) to accept the parameters justset and return to the Main Menu.3.2.8 Global OptionsWhen Global Options selection is highlighted, press the GO button to move to theconfiguration screen. From here the Language, Display Setting, Analog Outputs,Locked Setups, Standardization Interval, AutoSearch, Measurement Settings andDate/Time can be configured. Use the up/down arrows to select the Global Option tochange.Figure 3-32. Global Options from the Main MenuGlobal Options:Language Select the language by using the RIG<strong>HT</strong> or LEFT arrow.Languages include English, French, German, Italian, Japanese, Spanish and Chinese.Product Setups 3-19
<strong>SpectraTrend</strong> <strong>User</strong>'s GuideFigure 3-33. Display SettingsGlobal Options:Display Settings Choose the display settings by pressing the RIG<strong>HT</strong>arrow.• Screen Angle – from 0 or 180-degrees for readings pointing up or down to aproduction line.• Backlight from 0 to 100 in increments of 5. Zero would be dark and 100 wouldbe the lightest. A value of 50 is normal.• Contrast is available in increments of 5 from zero to 100.When done, press the GO button.Figure 3-34. Display Settings MenuGlobal Options:Analog Output Choose the analog output by pressing the RIG<strong>HT</strong>arrow. Upper and lower limits can be entered using the right and left arrow to selectand the up/down arrows to change the limits. Item 1 through 3 will output the threevalues of the color scale as defined by your product setups (for example #1 = L, #2 = a,#3 = b) while 4 will output an Index or Color Difference.3-20 Product Setups
<strong>SpectraTrend</strong> <strong>User</strong>'s GuideFigure 3-35. Analog OutputWhen the analog outputs have been entered, press the LEFT arrow to return to theGlobal Options menu.Global Options:Setups Locked This parameter will toggle between YES to Lock andNO to Unlock the Setups. When YES is selected, the user will be unable to change theproduct setup. This parameter is helpful in maintaining a consistency of readings byprotecting the system from product setup change.Figure 3-36. Setups LockedGlobal Options:STDZ Interval To automate the notification interval betweenstandardizations in days, select this option (ON) and the interval desired. The defaultvalue for this option is 1 day.Product Setups 3-21
<strong>SpectraTrend</strong> <strong>User</strong>'s GuideFigure 3-37. Standardization IntervalGlobal Options:Autosearch Autosearch finds a suitable standard based on Colordifference or Average. To initiate this option, press the RIG<strong>HT</strong> arrow and then choosethe method for the Autosearch. The standard will only function in READ mode.Figure 3-38. AutosearchGlobal Options:Measure Settings To set the HEIG<strong>HT</strong> TRIGGER pressing theRIG<strong>HT</strong> arrow. When the Distance is set to AUTO (default) the distance sensor willcalculate the height to use for color compensation. When the distance is set to anumber, a single fixed measurement is used for color compensation. The height unitsfor the fixed measurements are mm or inches and the distance is from 50 - 150mm or 2– 6 inches.3-22 Product Setups
<strong>SpectraTrend</strong> <strong>User</strong>'s GuideFigure 3-39. Measure SettingsPress the GO button to return to the Global Options Menu.Global Options:Date/Time To set the DATE/TIME press the RIG<strong>HT</strong> arrow. Thenumbers can be changed using the right and left arrow to select and the up/down arrowsto change between date and time. When finished press the GO button to SET the timeand then again to return to the MAIN MENU.Figure 3-40. Date/Time3.2.9 Run ConfigurationWhen Run Config Setting is highlighted press the RIG<strong>HT</strong> arrow button to move to theconfiguration screen. You may set the following parameters by using the UP andDOWN buttons:Product Setups 3-23
<strong>SpectraTrend</strong> <strong>User</strong>'s GuideFigure 3-41. Run Configuration & Read Over TimeRun Configuration: Read Mode: You may choose whether to read and present dataaveraged over a selectable time period (TIME) or averaged for each piece read (PIECE)by pressing the right arrow button.If PIECE is selected, the system waits until the product is sensed, collects data until theproduct is no longer sensed, and then transmits average data, in units selected, for all thereadings taken on the piece. The maximum speed at which the sensor can measure inpiece mode is 1 per second. This mode is appropriate for individually-measuredproducts such as cookies or crackers.If TIME is selected, the <strong>SpectraTrend</strong> <strong>HT</strong> continuously measures and reports data overspecific periods of time, transmitting average data, in units selected, for the selectedtime interval. Gaps in product when in time mode are ignored by the sensor. Thismode is appropriate for products measured in piles or batches, such as potato chips orpowders.In TIME mode, all sets of results for a product are used in the average result for thetime period defined as the Read Time. The default read time is 15 seconds.For both PIECE and TIME modes, height is given relative to the “background”. Thedefault setting for background is five inches from the sensor window. In PIECE mode,a continuous piece of product is assumed to be present if the measured height is withinthe cutoff distance (for which the default setting is also five inches).3-24 Product Setups
<strong>SpectraTrend</strong> <strong>User</strong>'s GuideFigure 3-42. Run Configuration and Piece ModeRun Configuration: Interval. If TIME is selected, set the measurement integration(averaging) time. The intervals are increased or decreased in 5 second steps by using theRIG<strong>HT</strong> (increase) and LEFT arrow key (decrease). The minimum interval is zero(maximum measurement output approximately 1 reading per second) and the maximuminterval is 60 seconds.Figure 3-43. Read Mode IntervalsRun Configuration: Belt Distance. Belt distance is defined as the distance from thefront surface of the sensor window to the selected background (conveyor) position inthe height units selected. However, since the <strong>SpectraTrend</strong> <strong>HT</strong> measures height bydetecting the angle of the light reflected to the sensor, height is not measured“absolutely,” and all heights are relative. Therefore, the background distance cannot bedetermined with a ruler. Instead, perform the background height determinationprocedure using the Distance Sensor in the Diagnostic Menu and enter the valueobtained as this parameter in the setup. The default background distance is four inches(100 mm).Product Setups 3-25
<strong>SpectraTrend</strong> <strong>User</strong>'s GuideFigure 3-44. Belt DistanceRun Configuration: Min Height. The Min Height distance is defined as a distancemeasured from the Belt Distance in the height units selected such that any product orbackground located beyond the Min Height distance will not be included inmeasurements. However, since the <strong>SpectraTrend</strong> <strong>HT</strong> measures height by detecting theangle of the light reflected to the sensor, height is not measured “absolutely,” and allheights are relative. Instead, perform the Min Height determination procedure using theDistance Sensor in the Diagnostic Menu and enter the value obtained as this parameterin the setup. The default value is 0 inches (0 mm). As a general rule, the Min Heightdistance can be set to half of the height of the product. Adjust the value by using theRIG<strong>HT</strong> arrow. The values are changed in 5 unit steps up to 100. Once the desired valueis reached press the DOWN arrow to move to the next parameter.Figure 3-45. Minimum Height from BeltRun Configuration: Max Height: The Max Height distance is defined as a distancemeasured from the Belt Distance in the height units selected such that any product orbackground located beyond the Max Height distance will not be included inmeasurements. However, since the <strong>SpectraTrend</strong> <strong>HT</strong> measures height by detecting theangle of the light reflected to the sensor, height is not measured “absolutely,” and all3-26 Product Setups
<strong>SpectraTrend</strong> <strong>User</strong>'s Guideheights are relative. Instead, perform the Max Height determination procedure usingthe Distance Sensor in the Diagnostic Menu and enter the value obtained as thisparameter in the setup. The values are changed in 5 unit steps up to 300. Adjust thevalue by using either the LEFT or RIG<strong>HT</strong> arrow. Once the desired value is reachedpress the down arrow to move to the next parameter.Figure 3-46. Maximum Height from BeltRun Configuration: Ext Trigger: When the Ext. Trigger is set to NO, the default isin place. When the Ext Trigger is set to YES, then the external wiring must be in placeto support this feature.Figure 3-47. External TriggerRun Configuration: Height Trigger: When the Height Trigger is set to YES, thesensor will only flash when the sample is within in the selected range for Min and MaxHeight. If the sensor is outside this range, the sensor will not flash, and no readings aretaken. When the Height Trigger is set to NO, the sensor will flash regardless of theMin/Max Height settings. Height triggering is most useful in PIECE mode, as thesensor will begin measurements when the leading edge is detected. Press the RIG<strong>HT</strong>arrow button to toggle between YES or NO.Product Setups 3-27
<strong>SpectraTrend</strong> <strong>User</strong>'s GuideFigure 3-48. Height TriggerRun Configuration: Filter: The filter function allows you to smooth the output datawithout extending the update period. The output data may be smoothed by using theTIME read mode and a large number (such as 60 seconds) for the read time. However,this method would constrain the system to providing a reading only every 60 seconds,which is unacceptable for some on-line processes. The filter function can provide thesame filtering effect as a long read time while maintaining a worst-case read time ofabout one second. Press the RIG<strong>HT</strong> (increase) or LEFT (decrease) arrow button toobtain the desired value.The filter works by allowing you to select the ratio of “old” data to “new” data in eachupdate. The filter function performs the following transfer function on the calculatedcolor data prior to reporting:Value_Out = [New-Value x (1 - Filter)] + Old-Value x (Filter)]The value of the entered filter constant must be between zero and 100. No filteringoccurs with a value of zero and maximum smoothing/filtering (and the slowest readtime) occurs with a filter constant of 10. The graph below illustrates the number ofreadings required to reach a new value when the product changes. For example, a filtervalue of 10 takes two to three readings to settle out completely, whereas a filter value of90 takes as many as forty readings. Multiply the number of readings required to settlethe output by the read time to calculate the amount of time required for settling.3-28 Product Setups
<strong>SpectraTrend</strong> <strong>User</strong>'s GuideFigure 3-49. Setting the Filter ValueFilter Settling vs. FilterFigure 3-50. Filter Setting (x100) vs. Filter Value (x100)3.3 Setup Parameters for EasyMatch OL-ST SoftwareBefore Beginning a Product Setup for the first time, make sure you have selected thePREFERENCES from the System Menu. After selecting Metric (mm) or US (inches)select the OK button and then follow the prompts to Download the System Setup withthe new Units of Measure. The Units of measure will remain as selected until manuallychanged and the System Setup is downloaded.Product Setups 3-29
<strong>SpectraTrend</strong> <strong>User</strong>'s GuideFigure 3-51. Software Setup PreferencesNext, from the RUN Menu select PRODUCT SETUP from the dropdown list.3-30 Product Setups
<strong>SpectraTrend</strong> <strong>User</strong>'s Guide3.3.1 Product SetupThe Saved Product Setups appear on the left window pane. Right Select on Default >“add new” or Right select on an existing name to change the parameters. Anyalphanumeric set-up (product) name of up to twenty characters may be entered into thisfield and will appear on the measurement screen when this setup is chosen. Select theProduct Setup that you would like to modify by using the right mouse button.Product Setup, (Tab) Page 1: Color ScaleColor scales available include XYZ, Hunter Lab, CIE L*a*b*, Yxy, and L*C*H*Figure 3-52. Product Setup & Color ScaleProduct Setup, (Tab) Page1: Optional IndexAn optional Index may be selected from the list to display on the front panel along withthe color measurement values.Product Setups 3-31
<strong>SpectraTrend</strong> <strong>User</strong>'s GuideFigure 3-53. Product Setup & IndexProduct Setup, (Tab) Page 1: Data CollectionYou may choose whether to read and present data averaged over a selectable timeperiod (TIME units) or averaged for each piece read (PIECE).When PIECE units are selected, the system collects data when the product is sensedand continues until the product is no longer sensed. Average data in units selected istransmitted for all the readings taken. The maximum speed at which the sensor canmeasure in PIECE mode is 1 piece per second. This mode is appropriate forindividually-measured products such as cookies or crackers.If TIME units are selected, the <strong>SpectraTrend</strong> <strong>HT</strong> continuously measures in the unitsselected and transmits average data for the selected time interval. Note that gaps areignored by the sensor. TIME units are appropriate for products measured in piles orbatches, such as potato chips or powders.In TIME unit mode, all sets of results for a productare used in the average result for thetime period defined as the Sample Time. The default sample time is 15 seconds.3-32 Product Setups
<strong>SpectraTrend</strong> <strong>User</strong>'s GuideFigure 3-54. Time Units for Data CollectionProduct Setup, (Tab) Page 1: Read Interval (Time)If the read mode chosen was TIME, you may set the measurement integration(averaging) time in seconds.Product Setup, Tab: Page 1: Set-Up IDA SETUP ID may be any number between one and 250. The last Product Setup that isdownloaded is used during a RUN.Product Setup, (Tab) Page 1: Display ModeThe available data display modes are ABSOLUTE and DIFFERENCE. ABSOLUTEprovides values as measured by the sensor. These values are relative to the standardwhite tile supplied with the system, which in turn is traceable to measurements made byN.I.S.T. of similar material. DIFFERENCE provides values calculated based on thedifference between a product standard’s values and the product sample’s values.Product Setup, (Tab) Page 1: Illuminant/ObserverChoose the ILLUMINANT and OBSERVER that you would like to use whendisplaying color measurement values on the front panel of the sensor.Product Setups 3-33
<strong>SpectraTrend</strong> <strong>User</strong>'s GuideFigure 3-55. Selection of Illuminant3.3.2 Product Standard, Tolerances and CorrectionsProduct Setup, (Tab) Page 2: Product Standard ValuesSelect the Page 2 tab to enter product target values for the color scale selected.Choose AD HOC when you wish to use the first measurement value as the standard.Choose Numeric when an actual product specimen does not exist for measurement, butthe target color values are known from previous measurements.Choose Physical when an actual product specimen is available that represents the targetcolor to which samples will be compared on a regular basis. A physical standard ismeasured and stored in the product setup for as long as desired.Choose Hitch when you wish to alter the readings made on the <strong>SpectraTrend</strong> <strong>HT</strong> tobetter correlate to another color measurement instrument. A specific standard withknown color values from the other (reference) instrument will then be read with the<strong>SpectraTrend</strong> <strong>HT</strong> and that reading manually adjusted within the product setup to matchthe reference instrument. The modified standard is stored in the product setup for aslong as desired.3-34 Product Setups
<strong>SpectraTrend</strong> <strong>User</strong>'s GuideFigure 3-56. Select the Product Standard Type (Page 2)Product Setup, (Tab) Page 2: Offset CorrectionOffset correction values may be entered for the color scale selected. The values enteredare added to the values read by the sensor.Product Setup, Tab: Page 2: Tolerances & Warning LimitsEnter the desired alarm limit and warning limit for each parameter into the correctboxes.3.3.4 CMC ParametersSelect PAGE 3 to enter the CMC/Shade Sort parameters. Note that this applies only ifthe color index chosen is dE CMC. Shade Sorting Blocks and Tolerance Band is notused with this equipment and may be ignored.Product Setups 3-35
<strong>SpectraTrend</strong> <strong>User</strong>'s GuideFigure 3-57. Entering CMC Parameters (Page 3)3.3.5 Belt Distance, Height, Color TrackingSelect PAGE 4 to enter the information on the height and belt distance. Belt distance isdefined as the distance from the front surface of the sensor window to the selectedbackground. Since the <strong>SpectraTrend</strong> <strong>HT</strong> measures height by detecting the angle of thelight reflected to the sensor, height is not measured “absolutely,” and all heights arerelative. Therefore, the background distance cannot be determined with a ruler.Instead, perform the background height determination procedure using the DistanceSensor in the Diagnostic Menu and enter the value in the setup.Product Setup, (Tab) Page 4: Min HeightThe Minimum Height distance is defined as a distance measured from the Belt Distancein the height units selected. Any product or background located beyond the Min Heightdistance will not be included in measurement. However, since the <strong>SpectraTrend</strong> <strong>HT</strong>measures height by detecting the angle of the light reflected to the sensor, height is notmeasured “absolutely,” and all heights are relative. Therefore, the Min Height distancecannot be determined with a ruler. Instead, perform the Min Height determinationprocedure using the Distance Sensor in the Diagnostic Menu and enter the valueobtained as this parameter in the setup. As a general rule, the min height should be onehalfthe actual product height.3-36 Product Setups
<strong>SpectraTrend</strong> <strong>User</strong>'s GuideProduct Setup, (Tab) Page 4: Max HeightThe Max Height distance is defined as a distance measured from the Belt Distance inthe height units selected. Any product or background located beyond the Max Heightdistance will not be included in measurements. However, since the <strong>SpectraTrend</strong> <strong>HT</strong>measures height by detecting the angle of the light reflected to the sensor, height is notmeasured “absolutely,” and all heights are relative. Therefore, the Max Height distancecannot be determined with a ruler. Instead, perform the Max Height determinationprocedure using the Distance Sensor in the Diagnostic Menu and enter the valueobtained as this parameter in the setup.Figure 3-58. Distance and Height Parameters (Page 4)Product Setup, (Tab) Page 4: Filter CoefThe filter function, when enabled, allows you to smooth the output data withoutextending the update period. The output data may be smoothed by using the TimeAverage read mode and a large number (such as 60 seconds). However, this methodcould constrain the system to providing a reading only every 60 seconds, which isunacceptable for some on-line processes. The filter function can provide the sameProduct Setups 3-37
<strong>SpectraTrend</strong> <strong>User</strong>'s Guidefiltering effect as a long sample time while maintaining a worst-case sample time ofabout one second.The filter works by allowing you to select the ratio of “old” data to “new” data in eachupdate. The filter function performs the following transfer function on the calculatedcolor data prior to reporting:Value_Out = [New-Value x (1 - Filter)] + Old-Value x (Filter)]Enter an integer between 0 (off) and 90 (max effect).Figure 3-59. Smoothing the Data with the Filter FunctionProduct Setup, (Tab) Page 4: Height TriggerWhen the Height Triggering is selected, the sensor will only flash when the sample iswithin in the selected range for Min and Max Height. If the sensor is outside this range,the sensor will not flash, and no readings are taken. When the Height Trigger is set to“None”, the sensor will flash regardless of the Min Max Height settings. Heighttriggering is most useful in PIECE mode, as the sensor will begin measurements whenthe edge is detected. Regardless of the setting, only color measurements that fall withinthe boundaries set by the min/max height and color tracking are used in determining the3-38 Product Setups
<strong>SpectraTrend</strong> <strong>User</strong>'s Guidecolor measurement. When External Triggering is selected, the external trigger must beinstalled.Figure 3-60. External TriggeringProduct Setup, (Tab) Page 4: Color TrackingChoose whether color tracking is enabled by setting the tolerances. When all tolerancevalues are set to zero, the color tracking feature is disabled. When Color Tracking isenabled, the product will be registered as present if the measured color is within thepreset tolerance of the target color. In this case, the number of valid color readings persample measurement interval will be displayed in the upper left hand corner of thedisplay for the current sample measurement. If the value of the valid samples permeasurement is zero, then no product is being measured.Product Setups 3-39
<strong>SpectraTrend</strong> <strong>User</strong>'s GuideFigure 3-61. Setting the Color Tracking ValuesProduct Setup, (Tab) Page 4: Height Color CompensationAllow the sensor to determine the distance to the product and compensate for changingproduct heights. In situations where it is difficult for the height sensor to operatecorrectly (low Laser reflectance), you may choose to disable the auto heightcompensation by selecting Fixed and entering a value between 2.5 and 4.5 inches (63.5-114.3 mm).3-40 Product Setups
<strong>SpectraTrend</strong> <strong>User</strong>'s GuideFigure 3-62. Compensating for Variations in HeightProduct Setups 3-41
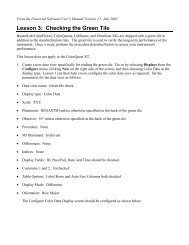
<strong>SpectraTrend</strong> <strong>User</strong>'s GuideChapter 4 - OPERATION4.1 Standardization Using the Front Panel DisplayStandardization sets the top and bottom of scale for the neutral axis. Duringstandardization, the bottom of the scale (zero) is set first. For this, you simulate thecase where all of the source light is absorbed by the sample. This is done by sliding theblack glass that is contained in the calibration “box” in to place. The top of the scale isthen set by scaling the light which is reflected back from the calibrated white tile also inthe calibration box. Messages on the LCD screen prompt you through thestandardization process as described below. The time elapsed (in hours/days) since thelast standardization is shown in the upper right corner of the screen.It is extremely important that the standard used for standardization be treated carefully.It must be clean and in good condition if standardization is to be successful. If there isany doubt about the standard being clean, clean it as described in the “Maintenance andTroubleshooting” chapter.Standardization, when the system is referenced to a reading of the white tile in the slideoncalibrator is performed as follows:• Check that the tiles are clean and free of dust and scratches. If they are dirty(including marked with fingerprints), clean them as described in “Maintaining andTesting <strong>SpectraTrend</strong> <strong>HT</strong>.”• Select Standardize from the <strong>SpectraTrend</strong> <strong>HT</strong>’s main menu by moving the cursorhighlight to its position using the up and down arrow buttons and then pressing the(Go) button.• Confirm the white tile values and green tile values by comparing to the values onthe calibration box.Figure 4-1. Confirming the Values of the White and Green TilesOperation 4-1
<strong>SpectraTrend</strong> <strong>User</strong>'s Guide• The Standardization screen appears, prompting you to place the black glass.Figure 4-2. Reading the Black Glass• Slide the calibration box to the black indication on the side of the box. The box willrest in the first detent position. Press the button (GO). The <strong>SpectraTrend</strong> <strong>HT</strong>reads the black glass and sets the instrument zero. When it is finished, the screenprompts you to place the white tile.Figure 4-3. Reading the White Tile• Replace the black glass by sliding the white tile into position, which is the secondindentation on the standards box.• Press the button (GO). The <strong>SpectraTrend</strong> <strong>HT</strong> reads the white tile and sets the top ofscale.• Replace the white tile by sliding the green tile into position, which is the thirdindentation on the standards box.4-2 Operation
<strong>SpectraTrend</strong> <strong>User</strong>'s GuideFigure 4-4. Reading the Green TileWhen it is finished, the screen indicates that the instrument has been successfullystandardized.Figure 4-5. Results of a Successful Standardization• Press MAIN MENU (right arrow) to return to the main menu.If any of the following error screens occur, clean the tile and repeat thestandardization process.Operation 4-3
<strong>SpectraTrend</strong> <strong>User</strong>'s GuideFigure 4-6. Examples of Standardization ErrorsThe frequency with which standardization must be performed depends on theoperating conditions, including the temperature at the sensor and the build-up of dirtand contaminants on the sensor window. Standardization must be performed atintervals which are short compared to the time required for significant colormeasurement changes to occur. These changes may be evaluated by simply readingthe instrument standard in the calibrator and observing the changes over time.Note: Distance calibration is performed at the factory and does not need regularchecking.4.2 Taking ReadingsNote: When the color or height of the product being read changes drastically,<strong>HunterLab</strong> recommends allowing time for the readings to stabilize before recordingthem. The length of time required for the readings to stabilize is a function of thecurrent setting of the Read Time and Filter parameters.4.3 Reading Individual SamplesComplete the following steps to take individual (non-averaged) readings using the<strong>SpectraTrend</strong> <strong>HT</strong>:Note: These instructions apply when Average in the product setup is set to OFF.• Select Read from the <strong>SpectraTrend</strong> main menu. Move the cursor highlight to itsposition using the up and down arrow buttons and then press the (GO) button.4-4 Operation
<strong>SpectraTrend</strong> <strong>User</strong>'s GuideFigure 4-7. Ready to Read a Sample• The first Reading screen appears, asking if you want to select the setup to use. If youwant to read using the last product setup that was used, press NO (down arrow. Ifyou want to select the setup for use from the list of setups, press YES (up arrow), andthe Select setup to use screen appears.Figure 4-8. Selecting a Setup• Scroll through the list of setups using the up and down arrow buttons until the setupyou wish to use is highlighted, then press the button (GO) to move to that setup.Operation 4-5
<strong>SpectraTrend</strong> <strong>User</strong>'s GuideFigure 4-9. Scrolling through Setups to Use• The first reading screen appears which prompts you to read the standard (if theproduct setup uses a working standard) or sample.Figure 4-10. Initiate Standard Reading• Place the standard or sample under the viewing window of the sensor. Make sure theitem is within the working range that is set in the product setup.Figure 4-11. Initiate Sample Reading4-6 Operation
<strong>SpectraTrend</strong> <strong>User</strong>'s Guide• Press the (GO) button to read. The standard or sample is read and its values (asconfigured in the product setup) displayed on the screen.Figure 4-12. Display of ReadingsNote that the meanings of the keypad buttons have now changed slightly, asshown on the keypad map at the bottom of the screen.• Press Read (GO button) to take another reading in this product setup. Press NEXT(up arrow) if it is an option to move to the next data view for this product setup. PressMAIN MENU (right arrow) to return to the main menu.4.4 Reading With AveragingComplete the following steps to take and average multiple readings using the <strong>SpectraTrend</strong><strong>HT</strong>:Note: These instructions apply when Average in the product setup is set to a value otherthan OFF.• Select Read from the <strong>SpectraTrend</strong> <strong>HT</strong>’s main menu. Move the cursor highlight to itsposition using the up and down arrow buttons and then press the (GO) button.• The first Reading screen appears, asking if you want to select the setup to use. If youwant to read using the last product setup that was used, press NO (down arrow) andskip to Step 4. If you want to select the setup for use from the list of setups, pressYES (up arrow), and the Select setup to use screen appears.• Scroll through the list of setups using the up and down arrow buttons until the setupyou wish to use is highlighted, then press the center button (GO) to move to thatsetup.Operation 4-7
<strong>SpectraTrend</strong> <strong>User</strong>'s GuideFigure 4-13. Selecting a New Setup for Averaging• The first reading screen appears, which prompts you to place the standard for reading1 of n (if the product setup uses a working standard) or sample for reading 1 of n.Figure 4-14. Reading a Sample or Standard for Averaging• Place the standard or sample under the viewing window of the sensor. Make sure theitem is within the working range that is set in the product setup.• Press the (GO) button to read. The standard or sample is read and its values (asconfigured in the product setup) displayed on the screen.4-8 Operation
<strong>SpectraTrend</strong> <strong>User</strong>'s GuideFigure 4-15. Displaying Values for Reading #1• Repeat the process until the number of selected averages samples has beencompleted.Figure 4-16. Displaying Reading #3• Press the (GO) button to view the average for the sample or standard.Figure 4-17. Displaying the Average• Press the RIG<strong>HT</strong> arrow to view the standard deviation.Operation 4-9
<strong>SpectraTrend</strong> <strong>User</strong>'s GuideFigure 4-18. Displaying the Standard Deviation of the ReadingsNote that the meanings of the keypad buttons have now changed slightly, as shown onthe keypad map at the bottom of the screen.• Once the standard deviation is displayed, you may press MAIN MENU (right arrow)to return to the main menu.4.5 Run Mode OperationComplete the following steps to take and average multiple readings using the<strong>SpectraTrend</strong> <strong>HT</strong>:Note: The Average in the product setup is not used during Run Mode.Note: The RUN will use the last selected Product Setup in the product setup.• Before starting a RUN, select the Product Setup to use if it is different from the lasttime that Run was selected. To change the Product Setup, navigate to the PRODUCTSETUP and then select GO.Figure 4-19. Select Product Setup4-10 Operation
<strong>SpectraTrend</strong> <strong>User</strong>'s Guide• Select YES (up arrow key) to select the product setup from the list. Use theUP/DOWN arrow keys to navigate through the Product Setup list until the desiredsetup is highlighted.Figure 4-20. Select New Product Setup• Select the PRODUCT SETUP to use, and then press the GO button to return to theMain Menu.Figure 4-21. Select the Parameters• Select RUN from the <strong>SpectraTrend</strong> <strong>HT</strong>’s main menu. Move the cursor highlight toits position using the UP and DOWN arrow buttons and then press the (GO) button.Operation 4-11
<strong>SpectraTrend</strong> <strong>User</strong>'s GuideFigure 4-22. Select RUN to Measure Continuously• The <strong>SpectraTrend</strong> will then begin to measure as described by the Product Setup thatwas selected. At the end of each measurement interval, the front panel will display thecolorimetric data, height, and any index that was selected in the Product Setup. In thetop left hand corner of the display is the current sample number reading, and thenumber of valid measurements for that reading. The top right corner displays thenumber of days and hours since the last standardization.• Pressing the GO button will pause the run, if desired. Pressing the GO button againwill resume the run. Pressing the LEFT arrow key will stop the Run and return to theMain Menu.4-12 Operation
<strong>SpectraTrend</strong> <strong>User</strong>'s GuideChapter 5 – DIAGNOSTICSTo initiate, select Diagnostics from the Main Menu and select the GO button to obtain the menu ofavailable tests. Choose the desired function using the UP and DOWN arrow keys and then press theRIG<strong>HT</strong> arrow button. The various functions perform as described below:Figure 5-1. Diagnostics5.1 White Tile RepeatabilitySelect the White Repeatability by using the RIG<strong>HT</strong> arrow key.Figure 5-2. White Tile Repeatability TestThe instrument then prompts the user to standardize the instrument, first with the black glass andthen with the white tile.Diagnostics 5-1
<strong>SpectraTrend</strong> <strong>User</strong>'s GuideFigure 5-3. Standardization for White Tile RepeatabilityWhen standardization is complete, the white tile is left at the port for a series of 20 readings.Figure 5-4. Initiation of Repeatability TestReadings are taken in X, Y, Z and the dE* is reported at the end and compared to a dE* toleranceof ≤ 0.05.Figure 5-5. Passing Results of Repeatability TestTo return to the Diagnostics Menu select the LEFT arrow. To return to the Main Menu select theRIG<strong>HT</strong> arrow.5.2 Green Tile CheckThe Green Tile Check provides a way to determine if the instrument can read color.5-2 Diagnostics
<strong>SpectraTrend</strong> <strong>User</strong>'s GuideFigure 5-6. Green Tile CheckTo begin, the software prompts the user to confirm the values for the green tile stored inmemory. The values stored should match the values printed on the slide-on calibrator. If thevalues match, press the GO button to continue. If the values in the instrument’s memory requirerevision, change the selected color scale value using the up and down arrow buttons. When thedesired digit is shown, press NEXT to move to the next digit. When all digits are as desired,press GO to continue. You may also press BACK to cancel the test.The instrument then prompts the user to standardize; first with the black glass and then with thewhite tile. Once standardization is complete, the instrument prompts for the green tile.Figure 5-7. Standardization & Green Tile CheckDiagnostics 5-3
<strong>SpectraTrend</strong> <strong>User</strong>'s GuideFigure 5-8. Results of Green Tile CheckReadings are taken in X, Y, Z and the dX, dY, dZ values are reported at the end and compared toan individual tolerance of ≤ 0.30. To return to the Diagnostics Menu select the LEFT arrow. Toreturn to the Main Menu select the RIG<strong>HT</strong> arrow and to SEND the results, select the DOWNarrow.5.3 Signal LevelsTo examine the spectral signal levels for a sample, select the Signal Levels by pressing theRIG<strong>HT</strong> arrow. Place the sample of interest at the port and press GO when ready. Normally thiswill be the white tile, but <strong>HunterLab</strong>’s Technical Support staff may instruct differently. Placethe sample and press GO.The sample and monitor channels are plotted on a graph for examination by <strong>HunterLab</strong>’sTechnical Support staff.Figure 5-9. Signal Level Diagnostic5-4 Diagnostics
<strong>SpectraTrend</strong> <strong>User</strong>'s GuideFigure 5-10. Spectral Plot of Signal LevelsTo return to the Diagnostics Menu select the LEFT arrow. To return to the Main Menu select theRIG<strong>HT</strong> arrow and continue reading, press the GO button.5.4 Distance SensorTo set the distance sensor, press the RIG<strong>HT</strong> arrow to initiate. A sample should be available formeasurement.Figure 5-11. Distance Sensor DiagnosticThe raw data for measuring the distance between the sample and the bottom of the sensor isdisplayed along with the calculated distance in millimeters.Figure 5-12. Sensor CountDiagnostics 5-5
<strong>SpectraTrend</strong> <strong>User</strong>'s GuideTo continue measuring, press the GO button. To return to the Diagnostics Menu, press the LEFTarrow and to return to the Main Menu, press the RIG<strong>HT</strong> arrow.5.5 Self TestThe DIAGNOSTICS MENU contains a fourth function named SELF TEST. When this functionis selected, communication tests between the <strong>SpectraTrend</strong>’s subsystems are run. If successful,the versions of the firmware are displayed. Also shown is the value of the checksum of theinstrument’s calibration data in hexadecimal. Press the RIG<strong>HT</strong> arrow to begin.Figure 5-13. Self Test DiagnosticThe value of the checksum of the calibration data should remain constant unless the white tile’sassigned reflectance is updated or the instrument is serviced. You should keep a record of thechecksum’s value. If it changes for unexplained reasons then the instrument may not functioncorrectly.Figure 5-14. Firmware Versions & Check Sum ValuesTo return to the Diagnostics Menu, press the LEFT key, to return to the Main Menu, press theRIG<strong>HT</strong> key.5-6 Diagnostics
<strong>SpectraTrend</strong> <strong>User</strong>'s GuideChapter 6 - MAINTENANCEThis chapter describes routine maintenance functions to be performed regularly on the <strong>SpectraTrend</strong><strong>HT</strong> system. Consistent system performance is enhanced by a consistent maintenance program. The<strong>SpectraTrend</strong> <strong>HT</strong> requires very little maintenance other than regular standardization and surfacecleaning.If it becomes necessary to disconnect the sensor or support unit cables for maintenance, always turnpower to the support unit off before disconnecting cables and turn it back on only after reconnectingall cables.Notice: Do not disassemble the instrument and attempt to clean the optical components. Do notopen the instrument or remove any covers except using the instructions given in this <strong>User</strong>’s <strong>Manual</strong>or under the direction of <strong>HunterLab</strong> Technical Support.6.1 Routine Maintenance ScheduleThe following schedule outlines recommended maintenance procedures for the <strong>SpectraTrend</strong><strong>HT</strong>. The actual frequency of maintenance required will be determined by the measurementapplication and plant operating conditions.Daily (or once per shift) Check and wipe the sensor viewing window clean with mild cleaningsolution and then a dry soft cloth.WeeklyClean the exterior of the sensor and mounting. Standardize the sensor.Monthly Clean the standards (slide-on calibrator and sensor window monitor) using alaboratory-grade detergent and a nylon brush. Wipe dry with a lint-free paper towelcontaining no FWAs.If a Hitch Standard has been used, then compare hitch standard values for the<strong>SpectraTrend</strong> <strong>HT</strong> to those of the off-line colorimeter. Rehitch the <strong>SpectraTrend</strong> <strong>HT</strong> ifnecessary or desired.As NeededReplace the sensor window.Replace the fuses.Perform the diagnostics.6.2 System Warm-UpIf power to any of the system components has been turned off, it must be restored to allcomponents before operation can resume. If power to the support unit has been turned off, a30-minute warm-up period is required for sensor temperature stabilization. If power to thesupport unit has been turned off for more than an hour, a two-hour warm-up period isrequired.Diagnostics 6-1
<strong>SpectraTrend</strong> <strong>User</strong>'s GuideWhen restoring power to system components,• Restore power to the support unit and computer (if included).• Allow at least thirty minutes of warm-up time.• Standardize.• Select the desired product setup and begin operation.6.3 Cleaning the SensorTo ensure proper operation of the sensor it is recommended that the abrasion-resistantLUCITE ® viewing window of the sensor be wiped clean with household glass cleaner on asoft lens tissue or lintless cloth at the start of each shift. The exterior of the sensor and mountshould be cleaned weekly. The system cleaning should always be followed bystandardization using the calibrator.6.4 Cleaning the Instrument StandardsIt is extremely important that the standard tile (the slide-on calibrator) be treated with greatcare. It should be protected from physical damage and dirt at all times.Be sure the standards are clean before using it for standardization. Once a month, use a softnylon brush and a Sparkleen (Fisher Scientific Catalog Number 4-320-4) in water solution (1tablespoon per gallon), followed by a running hot water rinse. Wipe dry with a clean, lintfreepaper towel manufactured without fluorescent whitening agents (FWAs) to removewater marks.6.5 Replacing the FusesFuse failure can indicate that one or both fuses in the support unit have failed.CAUTION: Replace only with a specified fuse, <strong>HunterLab</strong> part #A13-1010-143, orequivalent. More information concerning this fuse can be found on page 7-2.To replace a fuse:• Turn off the power to the support unit and disconnect it from the power source.• Open the support unit cover and locate fuse holder 1 and 2 as shown in Figure 5-1. If thefuse is blown the red light will be on. The fuse is <strong>HunterLab</strong> part number A13-1014-833.The rating is 0.5A, SB, 5 X 20 MM, 250V• Flip up the plastic fuse holder and open the cover panel.6-2 Diagnostics
<strong>SpectraTrend</strong> <strong>User</strong>'s GuideCover open in fuseholderFigure 6-1. Replacing the Fuse• Using a fuse removal tool, lift the faulty fuse out of its fuse holder and discard it.• Snap a replacement fuse into the operational fuse holder.• Notice: Use only the fuse specified above for your instrument or one which is identical intype, voltage rating, and current rating. Otherwise, there may be a risk of fire.• Replace the plastic cover panel and flip the fuse holder back into the original position.• Close the support unit cover.• Restore power to the support unit.• Allow the sensor and support unit to warm up for five minutes.• Standardize the instrument and proceed with measurements.• Order additional spare fuses for potential future use.Diagnostics 6-3
<strong>SpectraTrend</strong> <strong>User</strong>'s GuideChapter 7 - SPECIFICATIONS7.1 Physical CharacteristicsOperating ambient temperature: 10 to 50 degrees Celsius (50-122°F)Storage temperature:Operating ambient relativehumidity:Sensor size:Support unit size:Dimensions of standard tiles:-5 to 70 degrees Celsius (50-122°F)5% to 95% (non-condensing)9.3in (23.5 cm) x 7.8in (20 cm) x 4.3in (11 cm),10 lbs (4.5 kg)11in (4cm) x 8in (20.32cm) x 6in (15.24cm)2-1/4in (5.72cm) roundNote for high temperature applications: The <strong>SpectraTrend</strong> <strong>HT</strong> design has an ambienttemperature limit of 122° F (50° C). Ideally, the <strong>SpectraTrend</strong> <strong>HT</strong> sensor should be mountedat a position near the oven exit where the temperature never exceeds 122°. Mounting over ahot conveyor is not recommended. Prolonged operation over the temperature limit willnegate system performance specifications and may also cause material damage to the sensorcomponents. If your application requires operation beyond the temperature limit, contact<strong>HunterLab</strong> for more information.7.2 EnvironmentalSensor and support unit are sealed to NEMA 4/IP65 standards.Shock and vibration per MIL-STD 810:Shipping/Transport:Shock: 4 foot drop testing per MIL-STD 810Vibration: 10-50 Hz at 1 Hz/sec at 2 gOperation:Vibration: Minimum integrity testSpecifications 7-1
<strong>SpectraTrend</strong> <strong>User</strong>'s Guide7.3 Electrical CharacteristicsInput power*:Fuses:Power conditioning:Installation category:100-240 VAC, 47-63 Hz,
<strong>SpectraTrend</strong> <strong>User</strong>'s GuideChapter 8 - INSTRUMENT REPLACEMENT, REPAIR, PROBLEMS ANDQUESTIONSThe following <strong>HunterLab</strong> policies are described in this chapter:• Warranty• Claims• Returns/Service• Technical Assistance8.1 Warranty<strong>HunterLab</strong> warrants that all instruments it manufactures will be free from defects in materialand workmanship under normal use and service. <strong>HunterLab</strong>’s obligation under this warrantyis limited to repairing or replacing any defective parts which our examination determines tobe factory defective when returned to us by prepaid transportation. The time limit on thiswarranty is one year from date of shipment of new instruments and two months from the dateof shipment of repaired instruments. The printer and computer are covered under the originalmanufacturer’s warranty.<strong>HunterLab</strong> warranty does not cover expendable items such as lamps, fuses, batteries,diskettes, etc. The warranty is void if the user has made unauthorized repairs, performedimproper installation, or has incorrectly used the instrument.An instrument registration card is shipped with major pieces of <strong>HunterLab</strong> equipment. It isimportant that you return this card promptly upon receipt of equipment. The registration cardis kept on file with the <strong>HunterLab</strong> Service Department with complete information on the exactequipment purchased. Questions concerning operation, maintenance, or repair of yourequipment directed to the Service Department can then be knowledgeably handled.8.2 Shipping ClaimsAll materials are sold F.O.B. from Reston, Virginia (unless otherwise specified) and<strong>HunterLab</strong> responsibility ends upon delivery to the first carrier. All claims for loss or damagemust be rendered by the consignee against the carrier within fifteen days of receipt of goods.A copy of this notice must also be forwarded to <strong>HunterLab</strong> within five days of its receipt.8.3 Breakage or DamageAccording to the contract terms and conditions of the carrier, the responsibility of the shipperends at the time and place of shipment. The carrier then assumes full responsibility. Performthe following procedures if your instrument arrives broken or damaged.Instrument Replacement, Repair, Problems and Questions 8-1
<strong>SpectraTrend</strong> <strong>User</strong>'s Guide8.4 Freight or ExpressNotify your local carrier. Hold the damaged goods with their container and packaging forinspection by the examining agent. Do not return any goods to <strong>HunterLab</strong> prior to inspectionand authorization of the carrier.File a claim against the carrier. Substantiate this claim with the examining agent's report. Acertified copy of our invoice is available upon request. The original B/L is attached to ouroriginal invoice. If the shipment is prepaid, write for a receipted transportation bill.Advise <strong>HunterLab</strong> regarding replacement.8.5 Parcel Post ShipmentNotify <strong>HunterLab</strong> at once in writing, giving details of the loss or damage. This information isrequired for filing a claim.Hold the damaged goods with their container and packaging for possible inspection by postalauthorities.Advise <strong>HunterLab</strong> regarding replacement.8.6 United Parcel ServiceContact your local UPS office regarding damage and insurance claim. Each UPS office has adifferent method of handling these occurrences and yours will advise you of its procedures.Retain the container and packaging.Notify <strong>HunterLab</strong> at once for replacement.8.7 ShortagePerform the following procedure if your order appears to be missing items.Check the packing list notations. The apparent shortage may be a back ordered item and maybe marked as an intentional short-ship.Re-inspect the container and packing material, particularly to locate smaller items.Ascertain that the item was not removed by unauthorized personnel prior to completeunpacking and checking.Notify <strong>HunterLab</strong> immediately of the shortage in writing.8-2 Instrument Replacement, Repair, Problems and Questions
<strong>SpectraTrend</strong> <strong>User</strong>'s Guide8.8 Incorrect ShipmentPerform the following procedure if material received does not correspond with your order.Notify <strong>HunterLab</strong> immediately, referencing order number and item.Hold incorrect items until return shipping instructions are received.8.9 ReturnsA Service Return Order (SRO) number is required before any items can be returned to<strong>HunterLab</strong>. Contact <strong>HunterLab</strong>'s Order Processing Department to obtain an SRO fordamaged or incorrect parts, or Technical Support to obtain an RMA to return an instrumentfor service.Do not return any damaged or incorrect items to <strong>HunterLab</strong> until all shipping instructions arereceived.Note: <strong>HunterLab</strong> must be notified within fifteen days or we cannot accept responsibility fordamaged or incorrect items.<strong>HunterLab</strong> offers complete repair service for all instruments it manufactures. Call <strong>HunterLab</strong>for the service facility nearest your location. If your equipment is not functioning properly,contact <strong>HunterLab</strong> Technical Support for maintenance or repair instructions. Many times,this on-the-spot diagnosis is all that is required.If repair is required, <strong>HunterLab</strong> offers two means of servicing. Instrument may be returned toa <strong>HunterLab</strong> service facility for repair or a <strong>HunterLab</strong> Service Department technician cancome to your location to perform on-site repair. For scheduling and terms by trained servicetechnicians, call <strong>HunterLab</strong> Technical Support. Please read “When You Need Assistance”prior to contacting <strong>HunterLab</strong>.The customer is responsible for incoming and outgoing freight charges for instruments beingreturned to <strong>HunterLab</strong> for all repairs, including warranty repairs.Instrument Replacement, Repair, Problems and Questions 8-3
<strong>SpectraTrend</strong> <strong>User</strong>'s GuideINDEX457B , 457-nm Brightness ...................................................................................................................... A-6A ............................................................................................................................................................. A-2Absolute Indices ..................................................................................................................................... A-6Access to the sensor ................................................................................................................................. 2-1Alarm Limits .......................................................................................................................................... 3-13Alert Limits ............................................................................................................................................ 3-14Average .................................................................................................................................................... 3-5Averaging ................................................................................................................................................. 4-6Backup medium ....................................................................................................................................... 1-8Belt Distance ................................................................................................................................. 3-17, 3-27Brightness ....................................................................................................................................... A-6, A-7Broken instruments .................................................................................................................................. 7-1C ............................................................................................................................................................. A-2Calibrator ................................................................................................................................................. 1-4Installation ............................................................................................................................................ 2-3Chroma Difference ................................................................................................................................. A-9Chromaticity Difference ......................................................................................................................... A-9CIE 1976 L*a*b* .................................................................................................................................... 1, 3CIE Chromaticity Coordinates ................................................................................................................ A-1CIE L*C*h .............................................................................................................................................. A-3CIE tristimulus XYZ ............................................................................................................................... A-1Claims ...................................................................................................................................................... 7-1CleaningInstrument Standard .............................................................................................................................. 5-2Cleaning Sensor ....................................................................................................................................... 5-2Clearance for plant maintenance .............................................................................................................. 2-1Clip-on calibratorInstallation ............................................................................................................................................ 2-3Clock speed .............................................................................................................................................. 1-8CMC ............................................................................................................................................. 3-10, 3-13CMC Autotolerancing ........................................................................................................................... A-10Color Index ............................................................................................................................................ 3-10Color scale ...................................................................................................................................... 3-9, 3-22Color scales ............................................................................................................................. A-1, A-4, A-9Colorant Strength .................................................................................................................................... A-9Communication ports ............................................................................................................................... 1-8Computer ................................................................................................................................................. 1-7Installation ............................................................................................................................................ 2-4Computer requirements ............................................................................................................................ 1-7ConfigurationRead Mode .......................................................................................................................................... 3-16d457B ...................................................................................................................................................... A-8D50 .......................................................................................................................................................... A-2D55 .......................................................................................................................................................... A-2D65 .......................................................................................................................................................... A-2D75 .......................................................................................................................................................... A-2Index I-1
<strong>SpectraTrend</strong> <strong>User</strong>'s GuideDamaged instruments .............................................................................................................................. 7-1dC Chromaticity Difference .................................................................................................................... A-9dC* Chroma Difference .......................................................................................................................... A-9dE Total Color Difference ............................................................................................................ A-9, A-16dE* Total Color Difference .................................................................................................................... A-9dEc ........................................................................................................................................................ A-10Difference Color Scales .......................................................................................................................... A-4Difference Indices ................................................................................................................................... A-8Display ..................................................................................................................................................... 3-7Absolute ................................................................................................................................................ 3-7Color Plot .............................................................................................................................................. 3-8Diff Plot ................................................................................................................................................ 3-8Difference ............................................................................................................................................. 3-7Spectral Data ......................................................................................................................................... 3-7Spectral Difference ............................................................................................................................... 3-8Spectral Plot .......................................................................................................................................... 3-8Display Mode ......................................................................................................................................... 3-24dL*da*db ................................................................................................................................................ A-4dL*dC*dH* ............................................................................................................................................ A-5dLdadb .................................................................................................................................................... A-4dTint ........................................................................................................................................................ A-8dWIE ....................................................................................................................................................... A-8dXdYdZ .................................................................................................................................................. A-4dY Brightness ......................................................................................................................................... A-8dYdxdy .................................................................................................................................................... A-4dYID ....................................................................................................................................................... A-8dYIE ........................................................................................................................................................ A-8dZ% ......................................................................................................................................................... A-8Electrical characteristics .......................................................................................................................... 6-2Environmental .......................................................................................................................................... 6-1F11 .......................................................................................................................................................... A-2F2 ............................................................................................................................................................ A-2F7 ............................................................................................................................................................ A-2Filter ....................................................................................................................................................... 3-19Filter Coef. ............................................................................................................................................. 3-28Gray change .......................................................................................................................................... A-12Gray stain .............................................................................................................................................. A-14GSC ....................................................................................................................................................... A-12GSS ....................................................................................................................................................... A-14HeightMax ..................................................................................................................................................... 3-18Max ..................................................................................................................................................... 3-28Min...................................................................................................................................................... 3-18Trigger ................................................................................................................................................ 3-19Height Sensor ......................................................................................................................................... 3-30Height Trigger ........................................................................................................................................ 3-29Height, Min ............................................................................................................................................ 3-27I-2 Index
<strong>SpectraTrend</strong> <strong>User</strong>'s GuideHitch standard ........................................................................................................................................ 3-25How the sensor works .............................................................................................................................. 1-3Hunter L, a, b .......................................................................................................................................... A-2Hunter Lab .............................................................................................................................................. A-1Ill/Obs ...................................................................................................................................................... 3-9Illuminant/Observer ............................................................................................................................... 3-24Illumination .............................................................................................................................................. 6-2Incorrect shipment ................................................................................................................................... 7-2Index ...................................................................................................................................................... 3-10Indices ................................................................................................................................................. 1, 6, 9Input/output .............................................................................................................................................. 6-2Installation ........................................................................................................................................ 1-3, 2-1Installation medium ................................................................................................................................. 1-8Interval ................................................................................................................................................... 3-17Introduction .............................................................................................................................................. 1-1Key Features ............................................................................................................................................ 1-1Keyboard .................................................................................................................................................. 1-8L*a*b* .................................................................................................................................................... A-3L*C*h ..................................................................................................................................................... A-3Measurement values ............................................................................................................................... A-1Metamerism Index ................................................................................................................................ A-14MI .......................................................................................................................................................... A-15Monitor .................................................................................................................................................... 1-8Numeric standard ................................................................................................................................... 3-25Operating system ..................................................................................................................................... 1-8Opponent-color scales ............................................................................................................................. A-1Other Indices ........................................................................................................................................... A-9Paper brightness ...................................................................................................................................... A-8Parallel port .............................................................................................................................................. 1-8Physical characteristics ............................................................................................................................ 6-1Physical Standard ................................................................................................................................... 3-25Piecewise ............................................................................................................................................... 3-23Pointing device ........................................................................................................................................ 1-8Presentation of the product to the sensor. ................................................................................................ 2-1Processor .................................................................................................................................................. 1-8Product target values .............................................................................................................................. 3-25RAM ........................................................................................................................................................ 1-8Read Interval .......................................................................................................................................... 3-24Reading .................................................................................................................................................... 4-4Replacing Fuses ....................................................................................................................................... 5-2Returns ..................................................................................................................................................... 7-3Routine maintenance ................................................................................................................................ 5-1Safety notes ................................................................................................................................................ ivSensorInstallation ............................................................................................................................................ 2-1Sensor environment ................................................................................................................................. 2-1Set-Up ID ............................................................................................................................................... 3-24Shade Number ....................................................................................................................................... A-15Index I-3
<strong>SpectraTrend</strong> <strong>User</strong>'s GuideShade Sort .................................................................................................................................... 3-10, 3-13Shipping claims ........................................................................................................................................ 7-1Shortage ................................................................................................................................................... 7-2SMA ........................................................................................................................................................ A-9SPECIFICATIONS .................................................................................................................................. 6-1<strong>SpectraTrend</strong> <strong>HT</strong> Installation Drawings .................................................................................................. 2-5SSN ....................................................................................................................................................... A-15StandardAd Hoc .................................................................................................................................................. 3-4Hitch ..................................................................................................................................................... 3-5Numeric ................................................................................................................................................ 3-4Physical ................................................................................................................................................. 3-5Support unitInstallation ............................................................................................................................................ 2-2Surge protection ....................................................................................................................................... 1-8SW ........................................................................................................................................................ A-10System Components ................................................................................................................................ 1-3System Warm-up ..................................................................................................................................... 5-1Time Average ........................................................................................................................................ 3-23Tint .......................................................................................................................................................... A-6Tint ASTM E313 .................................................................................................................................... A-6TolerancesColor Tracking .................................................................................................................................... 3-30Total Color Difference .................................................................................................................. A-9, A-16Utility softwareInstallation ............................................................................................................................................ 2-3Video adapter ........................................................................................................................................... 1-8Viewing .................................................................................................................................................... 6-2Warm-up .................................................................................................................................................. 5-1Warranty .................................................................................................................................................. 7-1Whiteness Index E313 ............................................................................................................................ A-6WIE ......................................................................................................................................................... A-6XYZ ........................................................................................................................................................ A-1Y ............................................................................................................................................................. A-7Y Brightness ........................................................................................................................................... A-7Yellowness Index ASTM D1925 ............................................................................................................ A-7Yellowness Index ASTM E313 .............................................................................................................. A-7YI D1925 ................................................................................................................................................ A-7YI E313-98 ............................................................................................................................................. A-7YID ......................................................................................................................................................... A-7YIE .......................................................................................................................................................... A-7Yxy .......................................................................................................................................................... A-1Z% ........................................................................................................................................................... A-8I-4 Index
<strong>SpectraTrend</strong> <strong>User</strong>'s GuideAPPENDIX AMeasurement ValuesColor values measured using the <strong>SpectraTrend</strong> <strong>HT</strong> are relative to the absolute value or a perfect reflectingdiffuser as measured under the same geometric conditions (see ASTM E308), according to the January 1,1969 recommendation of the International Commission on Illumination, CIE.This chapter explains the various color scales, color difference scales, and indices available for use.Note: Not all of the indices or components of a color scale will be available on a single-channel<strong>SpectraTrend</strong> <strong>HT</strong>.Color Scales and Related Color Difference Scales and IndicesCIE Tristimulus XYZ ScaleThe <strong>SpectraTrend</strong> <strong>HT</strong> performs integration of reflectance values over the visible spectrum to arrive attristimulus X, Y, and Z values. These values simulate the color matching response functions of thehuman observer as defined by the 1931 2° Standard Observer or the 1964 CIE 10° Standard Observer.Tristimulus integrations based on any of the illuminants listed on the next page may be performed. For acomplete description of how to calculate tristimulus values, refer to the publication CIE 15.2 and toASTM E308.CIE Chromaticity Coordinates, YxyThe relationship between CIE XYZ and the x, y, chromaticity coordinates is as follows:Y = CIE Tristimulus YXx =X + Y + ZYy = .X + Y + ZOpponent-Color Scales (Hunter Lab, CIE 1976 L*a*b*, and CIE L*C*h)The opponent-color scales yield measurements of color in units of approximate visual uniformitythroughout color space.Measurement Values A-1
<strong>SpectraTrend</strong> <strong>User</strong>'s GuideIn the Hunter L, a, b scale, L measures lightness and varies from 100 for perfect white to zero for black,approximately as the eye would evaluate it. The chromaticity dimensions (a and b) yield understandabledesignations of color as follows:a describes redness when positive, gray when zero, and greenness when negative.b describes yellowness when positive, gray when zero, and blueness when negative.The relationship between the Hunter L, a, b scale and the CIE XYZ scale for the CIE 1931 2° StandardObserver and the CIE 1964 10° Standard Observer is as follows:L = 100YY na = KaX - YXnYnYYnb = KbX - ZXnZnYYnwhere:X, Y, and Z are CIE tristimulus valuesX n , Y n , and Z n are tristimulus values of the standard illuminant as listed in ASTM E308 with Y nalways equal to 100.00 (normalized)K a and K b are chromaticity coefficients for the illuminant used (see ASTM E308).Illuminant A represents incandescent (tungsten) lamp light with an approximate colortemperature of 2854K.Illuminant C represents average, or north sky, daylight with a correlated color temperature ofapproximately 6770K.Illuminant D50 represents daylight with a correlated color temperature of approximately 5000K.Illuminant D55 represents daylight with a correlated color temperature of approximately 5500K.Illuminant D65 represents daylight with a correlated color temperature of approximately 6500K.D75 represents daylight with a correlated color temperature of approximately 7500K.Illuminants F2, F7, and F11 represent light from a cool white fluorescent source.A-2 Measurement Values
<strong>SpectraTrend</strong> <strong>User</strong>'s GuideThe CIE 1976 L*a*b* scale is recommended by the Commission Internationale de l’Eclairage (CIE). Itis a simplified cube root version of the Adams-Nickerson space produced by plotting the quantities ofL*a*b* in rectangular coordinates.The relationship between the CIE L*a*b* scale and the CIE XYZ scale for any illuminant referenced inASTM E308 is as follows:L * =116⎛f⎜⎝YYn⎞⎟ -16⎠⎡ ⎛ X ⎞a * = 500 ⎢ f⎜⎟⎣ ⎝ Xn ⎠⎡ ⎛ Y ⎞b * = 200 ⎢f⎜⎟⎣ ⎝ Yn⎠⎛ Y ⎞⎤- f⎜⎟⎥⎝ Yn⎠⎦⎛ Z ⎞⎤- f ⎜ ⎟⎥⎝ Zn⎠⎦where:f⎛ X ⎞⎜ = 3 XX ⎟if X/X n > (24/116) 3⎝ n ⎠ X n⎛f⎜⎝XXn⎞⎟ =⎠( 841 )⎛108⎜⎝XXn⎞⎟ +⎠16116if X/X n ≤ (24/116) 3f⎛ Y ⎞⎜ = 3 YY ⎟if Y/Y n > (24/116) 3⎝ n ⎠ Y n⎛f⎜⎝YYn⎞⎟ =⎠( 841 )⎛108⎜⎝YYn⎞⎟ +⎠16116if Y/Y n ≤ (24/116) 3f⎛ Z ⎞⎜ = 3 ZZ ⎟if Z/Z n > (24/116) 3⎝ n ⎠ Z n⎛f⎜⎝ZZn⎞⎟ =⎠( 841 )⎛108⎜⎝ZZn⎞⎟ +⎠16116if Z/Z n ≤ (24/116) 3and X n , Y n , and Z n are tristimulus values for any illuminant.CIE L*C*h is a modification to the CIEL*a*b* scale, and plots in polar coordinates rather thanrectangular ones.L * = 116 3YYn-162 2C* ab = a * + b *Measurement Values A-3
<strong>SpectraTrend</strong> <strong>User</strong>'s Guideh° = arctan (b*/a*)Reference: Commission Internationale de l’Elclairage (CIE): “Recommendations on Uniform ColorSpaces, Color Difference Equations, Psychometric Color Terms,“ Supplement no. 2 to CIE PublicationNo. 15, Colorimetry, Bureau Central de la CIE, Paris, 1978. For more information, see AATCC TestMethod 173: Calculation of Small Color Differences.Difference Color Scales (available when Display Type is Difference; Reading of BothStandard and Sample Required)dXdYdZThis scale yields the color difference between the sample and the standard via the CIE XYZ scale.dX = X sample - X standarddY = Y sample - Y standarddZ = Z sample - Z standard .dYdxdyThis scale yields the color difference between the sample and the standard via the CIE Yxy scale.dY = Y sample - Y standarddx = x sample - x standarddy = y sample - y standard.dLdadbThis scale yields the color difference between the sample and the standard via the Hunter L, a, b scale.dL = L sample - L standardda = a sample - a standarddb = b sample = b standarddL*da*db(If dL is positive, the sample is lighter than the standard. If dL isnegative, the sample is darker than the standard.)(If da is positive, the sample is redder than the standard. If da isnegative, the sample is greener than the standard.)(If db is positive, the sample is yellower than the standard. If dbis negative, the sample is bluer than the standard.)This scale yields the color difference between the sample and the standard via the CIE L*a*b* scale.A-4 Measurement Values
<strong>SpectraTrend</strong> <strong>User</strong>'s GuidedL* = L* sample - L* standardda* = a* sample - a* standarddb* - b* sample - b* standardFor more information, see AATCC Test Method 173: Calculation of Small Color Differences.dL*dC*dH*This scale yields the color difference between the sample and the standard via the CIE L*C*h scale.dL* = L* sample - L* standarddC* = C* sample - C* standarddH* = h° sample - h° standardwhereIf h° sample > h° standard , then dH* is regarded as positive.If h° standard > h° sample, then dH* is regarded as negative.Measurement Values A-5
<strong>SpectraTrend</strong> <strong>User</strong>'s GuideAbsolute Indices (available when Display Type is Absolute)457-nm Brightness457-nm brightness (displayed as 457B) can be used to indicate the relative brightness of paper. 457-nmbrightness is calculated over the range of 400 nm to 510 nm in accordance with TAPPI document T452.Tint ASTM E313ASTM E313 Tint (displayed as Tint) is calculated as follows:andTint E313 =1000( x − x) - 650 ( y − y)when the 2° observer is in usennwhen the 10° observer is in useWhere x n and y n are the chromaticity coordinates for the CIE illuminant and standard observer used.These values are provided in the table given in ASTM E313. This index is only displayed when the dataview is configured for either the C or the D65 illuminant, as these are the only relevant illuminants.A few caveats regarding measurement of tint:• The application of this equation is restricted to samples that are called “white” commercially, that aresimilar in color and fluorescence, and that are measured on the same instrument at the same time.Under these conditions, their use should give relative, but not absolute, evaluations of tint that areadequate for commercial use.• The more positive the value of tint, the greater is the indicated greenish tint of the sample. The morenegative the value of tint, the greater is its reddish tint. Lines of equal tint are approximately parallelto the line of dominant wavelength 466 nm. For the perfect reflecting diffuser, tint = 0.• Equal differences in tint do not always represent equal perceptual differences in tint.• This equation should only be used for samples having tint values between -3 and +3.Whiteness IndexWhiteness is associated with a region or volume in color space in which objects are recognized as white.Degree of whiteness is measured by the degree of departure of the object from a perfect white.Whiteness Index E313 (displayed as WIE) is the whiteness index published in ASTM Method E313.WI CIE = Y + 800 (x n - x) + 1700 (y n - y) = WI-E313where Y, x, and y are the luminance factor and chromaticity coordinates of the specimen, and x n and y nare the chromaticity coordinates for the CIE illuminant and standard observer used. These values areprovided in the table given in ASTM E313. This index is only displayed when the data view isconfigured for either the C or the D65 illuminant, as these are the only relevant illuminants.A-6 Measurement Values
<strong>SpectraTrend</strong> <strong>User</strong>'s GuideRefer to ASTM Method E313, “Standard Practice for Calculating Yellowness and Whiteness Indicesfrom Instrumentally Measured Color Coordinates,” for more information.Y BrightnessY Brightness (Y) is also known as luminosity or light intensity. This index is calculated in the same wayas (and is equivalent to) the Y of the XYZ tristimulus scale.Yellowness IndicesVisually, yellowness is associated with scorching, soiling, and general product degradation by light,chemical exposure, and processing. Yellowness indices are used chiefly to measure these types ofdegradation.Yellowness Index per ASTM Method E313 (displayed as YIE) is calculated as follows:100YI E313 - 96 =( C X - C Z)xYZWhere X, Y, and Z are the CIE tristimulus values and the coefficients depend on the illuminant andobserver as indicated in the table given in ASTM E313. This index is only displayed when the data viewis configured for either the C or the D65 illuminant, as these are the only relevant illuminants.Refer to ASTM Method E313, “Standard Practice for Calculating Yellowness and Whiteness Indicesfrom Instrumentally Measured Color Coordinates,” for more information.Yellowness Index per ASTM Method D1925 (displayed as YID) is defined in the ColorFlex EZ asfollows:100YI D1925 =( 1.274641506X -1.057434092 Z)Yunder C/2° conditions.The yellowness index formula is shown in ASTM D1925 as:( )100 1.28 XCIE- 1.06 ZYI D1925 =YCIEunder C/2° conditions.CIEThe tristimulus values of clear air (for CIE illuminant C and the 1931 CIE 2° standard observer) are X =98.041, Y = 100.000, Z = 118.103. Using these values, the ASTM formula yields YI = 0.303 for clear airbecause the factors are truncated to three significant figures. In order to set the yellowness index for airequal to 0.0, the constant multipliers for X CIE and Z CIE have been expanded slightly in the ColorFlex EZ.The ASTM D1925 method was withdrawn in 1995, but this formula still provides useful information.This index is only displayed when the data view is configured for C/2°, as this is the only relevantilluminant/observer combination.Measurement Values A-7
<strong>SpectraTrend</strong> <strong>User</strong>'s GuidePaper Brightness (Z%)Paper brightness, Z%, is used in the evaluation of the degradation of white materials. It can also be ameasure of the effectiveness of bleaching.Z% = 100ZZnCIE.Difference Indices (available when Display Type is Difference;Reading of Both Standard and Sample Required)D457BThis index yields the difference between the sample and the standard via the 457-nm Brightness index.dTintD457B = 457B sample - 457B standard .This index yields the difference between the sample and the standard via the Tint indices.dWIEdTint = Tint sample - Tint standardThis index yields the difference between the sample and the standard via the Whiteness Index.dWIE = WIE sample - WIE standarddY BrightnessThis index yields the difference between the sample and the standard via the Y brightness index.dY = Y sample - Y standard .dYIE and dYIDThese indices yield the differences between the sample and the standard via the Yellowness Index E313and Yellowness Index D1925.dYIE = YIE sample - YIE standarddZ%dYID = YID sample - YID standardA-8 Measurement Values
<strong>SpectraTrend</strong> <strong>User</strong>'s GuideThis index yields the difference between the sample and the standard via the Z% index.dZ% = Z% sample - Z% standard .Other Indices (available with Absolute and Difference Display Types;Reading of Both Standard and Sample Required)dE Total Color DifferenceThe Hunter L, a, b total color difference for any illuminant and observer is calculated as follows:dE = dL +2 2 2+ da db .dE approximates the NBS Unit of Color Difference (Judd-Hunter), which represents the averagemaximum difference acceptable in a series of dye house commercial matches in 1939.dC Chromaticity DifferenceThe Hunter L, a, b chromaticity difference for any illuminant and observer is calculated as follows:2 2dC = da + db .dE* Total Color DifferenceCIE dE* total color difference is defined as follows:2 2 2dE * = dL* + da * + db* .dC* Chroma DifferenceCIE dC* chroma difference is defined as follows:dC* = C* sample - C* standard whereC * +2 2= a * b * and is termed metric chroma.Colorant StrengthWhen SMA is selected as the index, color values are adjusted based on the wavelength of maximumabsorbance (minimum reflectance) of the standard. The strength value is displayed as a percentage.whereSMA = (K/S) λMeasurement Values A-9
<strong>SpectraTrend</strong> <strong>User</strong>'s Guide(K/S)λ =(1.0 - K[ 2.0 * (1.0 - S ) * (K - S )]λ)2λλλK λ = the absorption coefficient of the specimen (the %R value normally measured by aspectrophotometer and normalized to 1.0)S λ = the scattering coefficient of the specimen (assumed to be 0.0 for most applications).SW is K/S weighted by the visual function (such as the XYZ observer functions and the D65 illuminantenergy function) and summed over a wavelength interval within the visible spectrum.whereSW= ∑λEλ* (K/S)λ*S dλλλ = wavelength over the available range of the spectrophotometerE = energy distribution of the illuminant being usedS = observer functions.dEc and CMC AutotolerancingThe equation for dEc describes an ellipsoidal volume with axes in the direction of lightness, chroma, andhue centered about a standard. When the semi-axis lengths for the ∆Ec formula equal the calculated lSL,cSc, and SH values for the standard, the resulting ellipsoid describes a 1.0 dEc unit volume/tolerance.This volume and the size of its component parts become the basis for the establishment of anappropriately-sized volume of acceptability for a given commercial situation by the application of acommercial factor (cf). The cf equals the dEc tolerance.When l = 2.0 and c = 1.0, the equation fixes the ratio of the three components (SL:SC:SH) to correlatewith visible assessment of typical textile samples. Other values of l may be required in cases where thesurface characteristics change dramatically. The value of c is always left at 1.0.dEc =22⎛ dL* ⎞ ⎛ dC* ⎞ ⎛ dH * ⎞⎜ ⎟ + ⎜ ⎟ + ⎜ ⎟ Absolute⎝ lSL ⎠ ⎝ cSC ⎠ ⎝ SH ⎠2dL *dL * c =lSLdC *dC * c =cSCA-10 Measurement Values
<strong>SpectraTrend</strong> <strong>User</strong>'s GuidewheredH *dH * c =SHL*, C*, and H* are those of the standard unless otherwise specified.0.040975L *SL =for L* > 161+ 0.01765LSL = 0.511 for L* < 16SC =10.0638C *+ 0.0131C * + 0.638SH = (FT + 1 - F) SC2C * = a * +b *⎛ b * ⎞h ° = arctan ⎜ ⎟⎝ a * ⎠2dL* = L* SMP - L* STDdC* = C* SMP - C* STDdH * =dE *2− dL *2− dC *2F =44C *C * + 1900T = 0.36 + |0.4 cos (35 + h)| for h < 164° or h > 345°T = 0.56 + |0.2 cos (168 + h)| for 164° < h < 345°Tolerances are:dL* = (cf) lSL dLc = cfdC* = (cf) cSC dCc = cfdH* = (cf) SH dHc = cfdEc = cfFor a more detailed description of CMC, refer to “Calculation of Small Color Differences forAcceptability,” AATCC Test Method 173-1992, published in the AATCC Technical <strong>Manual</strong>.Measurement Values A-11
<strong>SpectraTrend</strong> <strong>User</strong>'s GuideGray ChangeGray Change indicates the amount of fading or color alteration that occurs with environmental exposureor washing of textiles. The loss of color using the Gray Change Scale is evaluated by comparison to fivepairs of gray standards similar to those shown below. One half of each standard is always of identicalchroma to the starting specimen. The second half ranges from the starting chroma (no loss of color) towhite (loss of all color). The amount of contrast between the treated and untreated fabric is related to oneof the standard pairs to yield the gray scale rating. On this scale, 5 indicates that next to no color was lost,and 1 indicates that most color was lost.The bottom halfof each pairshows thestarting color.The top halfshows the colorof the treatedfabric.(Illustration fromAATCCEvaluationProcedure 1.)Gray Change, as implemented, is based on ISO 105-A05:1996, Textiles - Tests for Colour Fastness - PartA05: Instrumental Assessment of Change in Colour for Determination of Grey Scale Rating. Thismethod is equivalent to AATCC Evaluation Procedure 7, “Instrumental Assessment of Change in Colorof a Test Specimen.” It is intended as an alternative to visual assessment as described in ISO 105-A02:1993, Textiles - Tests for Colour Fastness - Part A02: Grey Scale for Assessing Change in Colour, orAATCC Evaluation Procedure 1, “Gray Scale for Color Change,” and is generally used in color fastnesstesting. It may be used in assessing any samples except those which have been treated with fluorescentwhitening agents (FWAs).dE +222F= dL* dCF* + dHF*wheredHF∆ CF=1+=1+dH( 10C /1000 ) 2M∆CK( 20C /1000) 2MdH K = dH* ab - DdC K = dC* ab - DKA-12 Measurement Values
<strong>SpectraTrend</strong> <strong>User</strong>'s Guidex =dC*abCD =100M2⎡h M− 280⎤⎣⎢ 30 ⎦⎥e−xif |h M - 280| ≤ 180x =⎡⎢⎣360 - h - 280M302⎤⎥ if |h M - 280| > 180⎦C = C C *abT+M2abOh = h habT+M2abOif |h abT - h abO | ≤ 180h = h h abT+abOM+ 180 if |h abT - h abO | > 180 and |h abT + h abO | < 3602h = h h abT+abOM- 180if |h abT - h abO | > 180 and |h abT + h abO | ≥ 3602L* T , C* abT , h abT = lightness, chroma, and hue of Test specimenL* O , C* abO , h abO = lightness, chroma, and hue of OriginaldL* = L* T - L* OdC* ab = C* abT - C* abOsign of ∆H* ab = sign of (h abT - h abO )dH*2 22ab= dE *ab− dL*− dC*abd E * +22 2ab= dL * da * + db*dE F is used to calculate Gray Change using the equations below:dEFGS C = 5 -if dE F ≤ 3.41.7Measurement Values A-13
<strong>SpectraTrend</strong> <strong>User</strong>'s Guidelog⎛dE⎜⎝GS C = 5 -logF⎞0.85⎟ ⎠( 2)if dE F > 3.4.Gray StainThe transference of color from the test specimen to an adjacent specimen is evaluated in a manner verysimilar to that of Gray Change. Again, five standard pairs are used. One half of each standard is white,and the second half range ranges from white (no staining) to a gray with the chroma value of the testspecimen (great deal of staining). A value of 5 corresponds to virtually no staining, whereas 1 indicatespoor color fastness.The bottom half ofeach pair shows thestarting color of theadjacent fabric. Thetop half shows thecolor of the treatedadjacent fabric.(Illustration fromAATCC EvaluationProcedure 2).Gray Stain, as implemented, is based on ISO 105-A04:1989, Textiles- Tests for Colour Fastness - PartA04: Method for the Instrumental Assessment of the Degree of Staining of Adjacent Fabrics. It isintended as an alternative to visual assessment as described in ISO 105-A03: 1993, Textiles - Tests forColour Fastness - Part A03: Grey Scale for Assessing Staining, or AATCC Evaluation Procedure 2,“Gray Scale for Staining,” and is used to assess the degree of staining of adjacent fabrics in a colorfastness test.dE =2 2GSdE * - 0.4 dE * - dL *Use dE GS to calculate the GSS as follows:GSS = 6.1 - 1.45 ln (dE GS ) for Ratings 1 to 4.If the GSS calculated by the above equation is greater than 4, recalculate using the following equation:GSS = 5 - 0.23dE GS for Ratings 4 to 5.Metamerism IndexA-14 Measurement Values
<strong>SpectraTrend</strong> <strong>User</strong>'s GuideIn order to display metamerism index, two data views must be configured in your product setup thatcontain different illuminant/observer combinations.The Metamerism Index is designed to indicate the degree to which two items which match under oneilluminant no longer match under a second illuminant. The formula for deriving the index is:MI =22( d L - dL) + ( da- da) + ( db- db) 2n1n2n1n2n1n2where n1 is the original illuminant and n2 is the illuminant selected in the product setup using theDuplicate standard type.Shade NumberThe shade number, SSN, that can be obtained using your ColorFlex EZ provides a convenient way ofsorting samples into groups (or “blocks”) of similar color. This is helpful in situations where severalseparate pieces will be combined into a whole and the colors of the pieces must be closely matched.In order to use shade sorting, you must first read an ideal product standard into your setup preferably as aPHYSICAL standard, and your first data view must be displaying the L*a*b*, L, a, b, or dLdCdH colorscale. Then enter your desired tolerances into the setup as well. These tolerances will provide the borderson which your shade number blocks will be based. CMC autotolerancing may be used to calculate thesetolerances if desired, but manually-entered rectangular tolerances work just as well. Then, on theCMC/Shade Sort screen, enter the number of shade blocks you wish to have fit inside your toleranceborders. Choices available are 1, 3, 5, 7, and 9. There are nine shade blocks within the acceptable limits(able to be displayed) for each dimension (L*a*b*), so there are 729 possible shade number assignments.Any sample that falls outside the displayable limits is indicated not with numbers, but with a + or -,depending on whether the actual shade number should be higher than 9 or lower than 1.Measurement Values A-15
<strong>SpectraTrend</strong> <strong>User</strong>'s GuideThe illustration shown above uses the L*a*b* color scale. The middle shade block, 555, is where thestandard is located. The first 5 denotes L*, the second 5 denotes a*, and the third 5 denotes b*. Thetolerance values are indicated as ∆L*, ∆a*, and ∆b*. There are five shade blocks on either side of thestandard (including the standard’s block) on the L* axis, five on either side of the standard on the a* axis,and five on either side of the standard in the b* direction. Suppose we wish to use five shade blocks. Notall of the shade blocks shown on the drawing (from 111 to 999) fall within the established tolerance. Fiveblocks for each parameter (L*, a*, and b*) do fall within the tolerance range. For the L* parameter, thesewill be blocks labeled 3-7 for the L* number. For the a* parameter, these will be blocks labeled 3-7 forthe a* number. For the b* parameter, these will be blocks labeled 3-7 for the b* number. Thus, the 345shade block would be within the tolerance range, but the 245 shade block would be too dark.Continuing with our example given above, suppose the entered tolerance for each parameter is ±1 unit.That is, ∆L* = 1, ∆a* = 1, and ∆b* = 1. Thus, with five shade blocks, the center (standard) block extends0.2 units (1 unit divided by 5) in each direction. The size of this block (and, in fact, each block) is 0.4units high, 0.4 units wide, and 0.4 units deep (±0.2 units times 2 directions for each parameter).Once the ∆L*, ∆a*, ∆b* difference between the sample and the product standard has been established, ashade number can be assigned to the sample. A sample that is very close to the standard in a* and b*, buthas values that put it one shade block away for L* would be assigned a shade number of 655 (if lighterthan the standard) or 455 (if darker than the standard). Although this sample’s color is slightly “off” fromthe standard, it will be a good match with any other samples in the same shade block and may still be usedwith these samples.The number of shade blocks used can be varied using ColorFlex XE Plus. If fewer shade blocks are usedwith the same tolerance (e.g., 3 blocks rather than 5), fewer blocks will be required to fit into thetolerance and each block will be bigger. You may wish to lower the number of shade blocks if you findthat your shade block tolerances are too tight. If more shade blocks are used with the same tolerance(e.g., 7 or 9 blocks rather than 5), more blocks will be required to fit into the tolerance and each block willbe smaller. You may wish to increase the number of shade blocks if you find that your shade blocktolerances are too loose.Baking Contrast UnitsBaking Contrast Units (BCU) is a custom color index used in the food industry. BCU are derived fromthe Y value in the XYZ color scale.Negative values, which occur when Y< 2.5, are truncated to zero.A-16 Measurement Values
<strong>SpectraTrend</strong> <strong>User</strong>'s Guide<strong>SpectraTrend</strong> <strong>User</strong>’s <strong>Manual</strong> Version 3.1<strong>SpectraTrend</strong> <strong>User</strong>’s <strong>Manual</strong> Version 3.1<strong>SpectraTrend</strong> <strong>User</strong>’s <strong>Manual</strong> Version 3.1<strong>SpectraTrend</strong> <strong>User</strong>’s <strong>Manual</strong> Version 3.1<strong>SpectraTrend</strong> <strong>User</strong>’s <strong>Manual</strong> Version 3.1<strong>SpectraTrend</strong> <strong>User</strong>’s <strong>Manual</strong> Version 3.1