Community Ecology analysis using R: basic intro
Community Ecology analysis using R: basic intro
Community Ecology analysis using R: basic intro
SHOW LESS

Create successful ePaper yourself
Turn your PDF publications into a flip-book with our unique Google optimized e-Paper software.
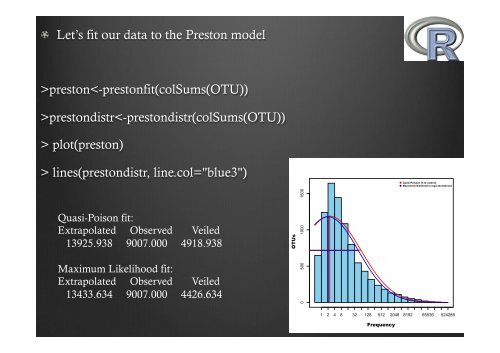
! Let’s fit our data to the Preston model>prestonprestondistr plot(preston)> lines(prestondistr, line.col="blue3")Quasi-Poisson fit to octavesMaximized likelihood to log2 abundancesQuasi-Poison fit:Extrapolated Observed Veiled13925.938 9007.000 4918.938Maximum Likelihood fit:Extrapolated Observed Veiled13433.634 9007.000 4426.634OTUs0 500 1000 15001 2 4 8 32 128 512 2048 8192 65536 524288Frequency