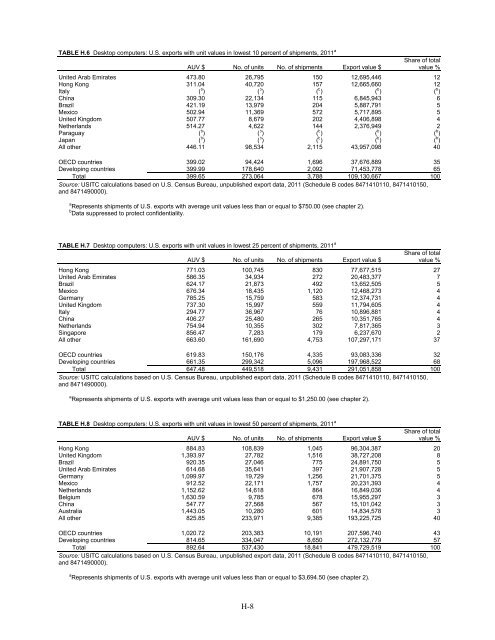
TABLE H.6 Desktop computers: U.S. exports with unit values in lowest 10 percent <strong>of</strong> shipments, 2011 aAUV $ No. <strong>of</strong> units No. <strong>of</strong> shipments Export value $Share <strong>of</strong> totalvalue %United Arab Emirates 473.80 26,795 150 12,695,446 12Hong Kong 311.04 40,720 157 12,665,660 12Italy ( b ) ( b ) ( b ) ( b ) ( b )China 309.30 22,134 115 6,845,943 6Brazil 421.19 13,979 204 5,887,791 5Mexico 502.94 11,369 572 5,717,895 5United Kingdom 507.77 8,679 202 4,406,898 4Netherlands 514.27 4,622 144 2,376,949 2Paraguay ( b ) ( b ) ( b ) ( b ) ( b )Japan ( b ) ( b ) ( b ) ( b ) ( b )All other 446.11 98,534 2,115 43,957,098 40OECD countries 399.02 94,424 1,696 37,676,889 35Developing countries 399.99 178,640 2,092 71,453,778 65Total 399.65 273,064 3,788 109,130,667 100Source: <strong>US</strong>ITC calculations based on U.S. Census Bureau, unpublished export data, 2011 (Schedule B codes 8471410110, 8471410150,and 8471490000).a Represents shipments <strong>of</strong> U.S. exports with average unit values less than or equal to $750.00 (see chapter 2).b Data suppressed to protect confidentiality.TABLE H.7 Desktop computers: U.S. exports with unit values in lowest 25 percent <strong>of</strong> shipments, 2011 aAUV $ No. <strong>of</strong> units No. <strong>of</strong> shipments Export value $Share <strong>of</strong> totalvalue %Hong Kong 771.03 100,745 830 77,677,515 27United Arab Emirates 586.35 34,934 272 20,483,377 7Brazil 624.17 21,873 492 13,652,505 5Mexico 676.34 18,435 1,120 12,468,273 4Germany 785.25 15,759 583 12,374,731 4United Kingdom 737.30 15,997 559 11,794,605 4Italy 294.77 36,967 76 10,896,881 4China 406.27 25,480 265 10,351,765 4Netherlands 754.94 10,355 302 7,817,365 3Singapore 856.47 7,283 179 6,237,670 2All other 663.60 161,690 4,753 107,297,171 37OECD countries 619.83 150,176 4,335 93,083,336 32Developing countries 661.35 299,342 5,096 197,968,522 68Total 647.48 449,518 9,431 291,051,858 100Source: <strong>US</strong>ITC calculations based on U.S. Census Bureau, unpublished export data, 2011 (Schedule B codes 8471410110, 8471410150,and 8471490000).a Represents shipments <strong>of</strong> U.S. exports with average unit values less than or equal to $1,250.00 (see chapter 2).TABLE H.8 Desktop computers: U.S. exports with unit values in lowest 50 percent <strong>of</strong> shipments, 2011 aAUV $ No. <strong>of</strong> units No. <strong>of</strong> shipments Export value $Share <strong>of</strong> totalvalue %Hong Kong 884.83 108,839 1,045 96,304,387 20United Kingdom 1,393.97 27,782 1,516 38,727,208 8Brazil 920.35 27,046 775 24,891,750 5United Arab Emirates 614.68 35,641 397 21,907,728 5Germany 1,099.97 19,729 1,256 21,701,375 5Mexico 912.52 22,171 1,757 20,231,393 4Netherlands 1,152.62 14,618 864 16,849,036 4Belgium 1,630.59 9,785 678 15,955,297 3China 547.77 27,568 567 15,101,042 3Australia 1,443.05 10,280 601 14,834,578 3All other 825.85 233,971 9,385 193,225,725 40OECD countries 1,020.72 203,383 10,191 207,596,740 43Developing countries 814.65 334,047 8,650 272,132,779 57Total 892.64 537,430 18,841 479,729,519 100Source: <strong>US</strong>ITC calculations based on U.S. Census Bureau, unpublished export data, 2011 (Schedule B codes 8471410110, 8471410150,and 8471490000).a Represents shipments <strong>of</strong> U.S. exports with average unit values less than or equal to $3,694.50 (see chapter 2).H-8
CRTs and <strong>Products</strong> Containing CRTsCRTs and products containing CRTs were separated into four subgroups: televisions,computer monitors, other equipment containing CRTs, and bare tubes (tables H.9 toH.24; figures H.3–H.6). Each subgroup had a unique AUV and shipment pr<strong>of</strong>ile due tothe diversity <strong>of</strong> the products contained within the group. For CRT product groupings, theshare <strong>of</strong> shipments going to OECD countries was considerably higher than for cellphones and computers. This is primarily due to the fact that Mexico was the leadingdestination for shipments in each category. In most subgroups, Mexico was also theleading destination for the highest number <strong>of</strong> units.Of CRT-containing products, televisions were the largest exported subgroup, in terms <strong>of</strong>both quantity and value. For the bottom 10th percentile <strong>of</strong> AUVs, Mexico was theprimary market for U.S. exports by a considerable margin. The next-largest destinationswere also in Latin America, particularly Panama, Venezuela, and Argentina. A noticeabledistinction between Mexico and other markets is that shipments to Mexico contained farfewer units per shipment. This could indicate that the proximity <strong>of</strong> Mexico and its landborder allow shipments by trucks, rather than by ship, making it a more economicalmarket for heavy, bulky CRT televisions.The Census data show a relatively small number <strong>of</strong> U.S. low-value exports <strong>of</strong> CRTshoused with data processing units and exports <strong>of</strong> bare CRTs (tables H.17-H.24; figures H.5-H.6). In fact, in many cases, the data cannot be reported because <strong>of</strong> the low number <strong>of</strong>shipments or firms involved in exports to specific countries.H-9
- Page 1 and 2:
United States International Trade C
- Page 3 and 4:
U.S. International Trade Commission
- Page 5:
AbstractAs the world’s leading ma
- Page 8 and 9:
CONTENTS—ContinuedChapter 3 Chara
- Page 10 and 11:
CONTENTS—ContinuedFigures—Conti
- Page 12 and 13:
CONTENTS—ContinuedTables—Contin
- Page 14 and 15:
ACRONYMSAUVBANCEACECCRTEACREMSEPAHT
- Page 16 and 17:
FIGURE ES.1 Used electronic product
- Page 18 and 19:
The top five destinations for U.S.
- Page 20 and 21:
FIGURE ES.4 Most 2011 U.S. exports
- Page 22 and 23:
TABLE ES.5 Estimated U.S exports of
- Page 27 and 28:
CHAPTER 1IntroductionOverviewAs the
- Page 29 and 30:
Disposal (Basel Convention). 11 Box
- Page 31 and 32:
FIGURE 1.1 Used electronic products
- Page 33 and 34:
Approachforeign markets, or knowled
- Page 35 and 36:
Census DataIn addition to survey re
- Page 37 and 38:
industry more broadly, also surveyi
- Page 39 and 40:
CHAPTER 2Overview of U.S. Used Elec
- Page 41 and 42:
ecovery, and goods intended for dis
- Page 43 and 44:
FIGURE 2.2 Commercial collections w
- Page 45 and 46:
For other industry segments, the up
- Page 47 and 48:
Summary of UEP exports (million $)E
- Page 49 and 50:
TABLE 2.3 Exports of UEPs by U.S. c
- Page 51 and 52:
TABLE 2.4 Destination of U.S. expor
- Page 53 and 54:
The largest non-OECD destination ma
- Page 55 and 56:
FIGURE 2.10 Cell phones, Schedule B
- Page 57 and 58:
CHAPTER 3Characteristics of U.S. Us
- Page 59 and 60:
this category accounted for one-qua
- Page 61 and 62:
According to one U.S. computer refu
- Page 63 and 64:
BOX 3.1 A shift from domestic refur
- Page 65 and 66:
U.S. Exports of UEPs for Disposal 3
- Page 67 and 68:
Shipment Characteristics and Produc
- Page 69 and 70:
BOX 3.3 Disagreements regarding rep
- Page 71 and 72:
TABLE 3.4 U.S. exports of UEPs, by
- Page 73 and 74:
CHAPTER 4Domestic Exporting Entitie
- Page 75 and 76:
ecycling. 10 Entities primarily eng
- Page 77 and 78:
TABLE 4.3 Nonexporting UEP handlers
- Page 79 and 80:
TABLE 4.4 Types of exporters of UEP
- Page 81 and 82:
BOX 4.1 IT asset managers—collect
- Page 83 and 84:
Some refurbishers operate as nonpro
- Page 85 and 86:
States. They did export an estimate
- Page 87 and 88:
BrokersIn the UEP industry, brokers
- Page 89 and 90:
Other large retailers, including te
- Page 91 and 92:
CHAPTER 5End Uses and Foreign Buyer
- Page 93 and 94:
those were described as exports des
- Page 95 and 96:
facilities. Among the reasons cited
- Page 97 and 98:
manually separated. The burning of
- Page 99 and 100:
TABLE 5.3 Major smelting and refini
- Page 101 and 102:
U.S. firms exporting to foreign aff
- Page 103 and 104:
types of materials, including rare
- Page 105:
Li, B., H.Z. Du, H.J. Ding, and M.Y
- Page 108 and 109:
FIGURE 6.1 Certain factors encourag
- Page 110 and 111:
of electronic products that were re
- Page 112 and 113:
Some states have specific benchmark
- Page 114 and 115:
BOX 6.1 Responsible Electronics Rec
- Page 116 and 117:
BOX 6.2 Principal differences betwe
- Page 118 and 119:
In addition to requiring that their
- Page 120 and 121:
FIGURE 6.6 Average hourly labor com
- Page 122 and 123:
Restrictions on Trade in Used Elect
- Page 124 and 125:
TABLE 6.2 Regulations limiting impo
- Page 126 and 127:
Lepawsky, Josh, and Chris McNabb.
- Page 129:
APPENDIX ARequest Letter
- Page 132 and 133:
• the forms, activities and chara
- Page 135 and 136:
Federal Register / Vol. 77, No. 22
- Page 137 and 138:
Federal Register / Vol. 77, No. 22
- Page 139 and 140:
under the Paperwork Reduction Act.P
- Page 141 and 142:
SUPPLEMENTARY INFORMATION:I. Abstra
- Page 143:
APPENDIX CHearing Witnesses
- Page 146 and 147:
PANEL 2: REF URBISHERS/EXPORTERS:OR
- Page 149:
APPENDIX DSummary of Views of Inter
- Page 152 and 153:
valuable working equipment to overs
- Page 154 and 155:
iFixit 14Kyle Wiens, CEO of iFixit,
- Page 156 and 157:
InterConnection 22trade of commodit
- Page 158 and 159:
Mr. Bullock estimated that the aver
- Page 160 and 161:
Commission investigation has certai
- Page 162 and 163:
procedure for all of its locations,
- Page 164 and 165:
that these shipments pose the same
- Page 166 and 167:
Umicore USA (Umicore) 39In her test
- Page 169:
APPENDIX ESurvey Methods
- Page 172 and 173:
processing, and wholesale sales of
- Page 174 and 175:
Stratifying by the three dimensions
- Page 176 and 177:
the Commission received a total of
- Page 178 and 179:
TABLE E.6 Determinants of survey pa
- Page 180 and 181:
E-12TABLE E.7 Detailed weighting fo
- Page 183:
APPENDIX FWritten Questionnaire
- Page 186 and 187: USITC Electronics Sector Questionna
- Page 188 and 189: USITC Electronics Sector Questionna
- Page 190 and 191: USITC Electronics Sector Questionna
- Page 192 and 193: USITC Electronics Sector Questionna
- Page 194 and 195: USITC Electronics Sector Questionna
- Page 196 and 197: USITC Electronics Sector Questionna
- Page 198 and 199: USITC Electronics Sector Questionna
- Page 200 and 201: USITC Electronics Sector Questionna
- Page 202 and 203: USITC Electronics Sector Questionna
- Page 204 and 205: USITC Electronics Sector Questionna
- Page 206 and 207: USITC Electronics Sector Questionna
- Page 208 and 209: USITC Electronics Sector Questionna
- Page 210 and 211: USITC Electronics Sector Questionna
- Page 212 and 213: USITC Electronics Sector Questionna
- Page 214 and 215: USITC Electronics Sector Questionna
- Page 217 and 218: This appendix presents data compile
- Page 219 and 220: UEP Exports by Primary Activity of
- Page 221 and 222: FIGURE G.4 Unit volume share of ref
- Page 223 and 224: TABLE G.9 Number of reported UEP bu
- Page 225 and 226: UEP Exports by Organization SizeTot
- Page 227: BibliographyU.S. Census Bureau (Cen
- Page 231 and 232: Analysis of Selected Schedule B Exp
- Page 233 and 234: TABLE H.2 Laptop computers: U.S. ex
- Page 235: TABLE H.5 Summary of U.S. Census ex
- Page 239 and 240: TABLE H.10 CRT TV’s: U.S. exports
- Page 241 and 242: TABLE H.14 CRT monitors: U.S. expor
- Page 243 and 244: TABLE H.18 CRTs w/ automatic data p
- Page 245 and 246: TABLE H.22 CRTs Bare: U.S. exports
- Page 247 and 248: TABLE H.25 Summary of U.S. Census e
- Page 249 and 250: TABLE H.29 Summary of U.S. Census e