An Empirical Study of Memory and Information Retrieval with ... - BCS
An Empirical Study of Memory and Information Retrieval with ... - BCS
An Empirical Study of Memory and Information Retrieval with ... - BCS
Create successful ePaper yourself
Turn your PDF publications into a flip-book with our unique Google optimized e-Paper software.
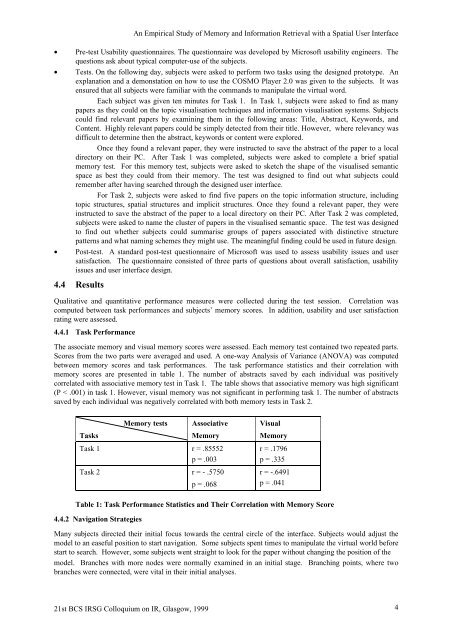
<strong>An</strong> <strong>Empirical</strong> <strong>Study</strong> <strong>of</strong> <strong>Memory</strong> <strong>and</strong> <strong>Information</strong> <strong>Retrieval</strong> <strong>with</strong> a Spatial User Interface• Pre-test Usability questionnaires. The questionnaire was developed by Micros<strong>of</strong>t usability engineers. Thequestions ask about typical computer-use <strong>of</strong> the subjects.• Tests. On the following day, subjects were asked to perform two tasks using the designed prototype. <strong>An</strong>explanation <strong>and</strong> a demonstation on how to use the COSMO Player 2.0 was given to the subjects. It wasensured that all subjects were familiar <strong>with</strong> the comm<strong>and</strong>s to manipulate the virtual word.Each subject was given ten minutes for Task 1. In Task 1, subjects were asked to find as manypapers as they could on the topic visualisation techniques <strong>and</strong> information visualisation systems. Subjectscould find relevant papers by examining them in the following areas: Title, Abstract, Keywords, <strong>and</strong>Content. Highly relevant papers could be simply detected from their title. However, where relevancy wasdifficult to determine then the abstract, keywords or content were explored.Once they found a relevant paper, they were instructed to save the abstract <strong>of</strong> the paper to a localdirectory on their PC. After Task 1 was completed, subjects were asked to complete a brief spatialmemory test. For this memory test, subjects were asked to sketch the shape <strong>of</strong> the visualised semanticspace as best they could from their memory. The test was designed to find out what subjects couldremember after having searched through the designed user interface.For Task 2, subjects were asked to find five papers on the topic information structure, includingtopic structures, spatial structures <strong>and</strong> implicit structures. Once they found a relevant paper, they wereinstructed to save the abstract <strong>of</strong> the paper to a local directory on their PC. After Task 2 was completed,subjects were asked to name the cluster <strong>of</strong> papers in the visualised semantic space. The test was designedto find out whether subjects could summarise groups <strong>of</strong> papers associated <strong>with</strong> distinctive structurepatterns <strong>and</strong> what naming schemes they might use. The meaningful finding could be used in future design.• Post-test. A st<strong>and</strong>ard post-test questionnaire <strong>of</strong> Micros<strong>of</strong>t was used to assess usability issues <strong>and</strong> usersatisfaction. The questionnaire consisted <strong>of</strong> three parts <strong>of</strong> questions about overall satisfaction, usabilityissues <strong>and</strong> user interface design.4.4 ResultsQualitative <strong>and</strong> quantitative performance measures were collected during the test session. Correlation wascomputed between task performances <strong>and</strong> subjects’ memory scores. In addition, usability <strong>and</strong> user satisfactionrating were assessed.4.4.1 Task PerformanceThe associate memory <strong>and</strong> visual memory scores were assessed. Each memory test contained two repeated parts.Scores from the two parts were averaged <strong>and</strong> used. A one-way <strong>An</strong>alysis <strong>of</strong> Variance (ANOVA) was computedbetween memory scores <strong>and</strong> task performances. The task performance statistics <strong>and</strong> their correlation <strong>with</strong>memory scores are presented in table 1. The number <strong>of</strong> abstracts saved by each individual was positivelycorrelated <strong>with</strong> associative memory test in Task 1. The table shows that associative memory was high significant(P < .001) in task 1. However, visual memory was not significant in performing task 1. The number <strong>of</strong> abstractssaved by each individual was negatively correlated <strong>with</strong> both memory tests in Task 2.<strong>Memory</strong> tests Associative VisualTasks <strong>Memory</strong> <strong>Memory</strong>Task 1 r = .85552p = .003Task 2 r = - .5750p = .068r = .1796p = .335r = -.6491p = .041Table 1: Task Performance Statistics <strong>and</strong> Their Correlation <strong>with</strong> <strong>Memory</strong> Score4.4.2 Navigation StrategiesMany subjects directed their initial focus towards the central circle <strong>of</strong> the interface. Subjects would adjust themodel to an easeful position to start navigation. Some subjects spent times to manipulate the virtual world beforestart to search. However, some subjects went straight to look for the paper <strong>with</strong>out changing the position <strong>of</strong> themodel. Branches <strong>with</strong> more nodes were normally examined in an initial stage. Branching points, where twobranches were connected, were vital in their initial analyses.21st <strong>BCS</strong> IRSG Colloquium on IR, Glasgow, 1999 4


