- Page 5: Dear readers,Following the traditio
- Page 8 and 9: Table of contentsPageMuseums and co
- Page 10 and 11: Table of contentsPageManagement of
- Page 12 and 13: Abbreviations and symbolsICT = Info
- Page 15 and 16: I. GEOGRAPHICAL FEATURESAND CLIMATE
- Page 19: Geographical features and climate4.
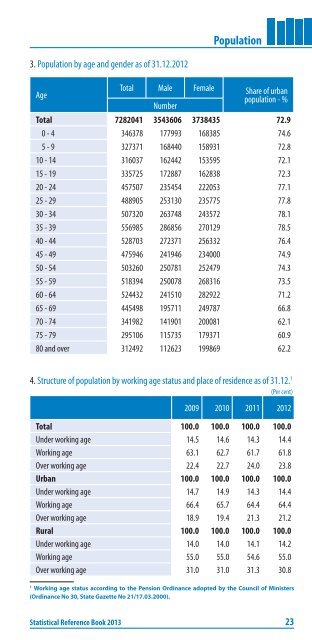
- Page 22: PopulationPopulation and demographi
- Page 27 and 28: 5. Live births by mother’s age an
- Page 29 and 30: Population6. Deaths by age and plac
- Page 31 and 32: Population7. Marriages and divorces
- Page 33 and 34: Population8. Population by gender,
- Page 35 and 36: Population9. Live births, deaths an
- Page 37: Population10. Migration of the popu
- Page 40 and 41: Labour forceLabour marketThe labour
- Page 42 and 43: Labour marketLabour force by distri
- Page 44 and 45: EmploymentLabour marketEmployed are
- Page 46 and 47: Labour marketEmployment by district
- Page 48 and 49: EmployeesLabour marketEmployees are
- Page 50 and 51: Labour marketUnemploymentUnemployed
- Page 52 and 53: Labour marketUnemploymentThe unempl
- Page 54 and 55: Labour marketUnemployment by distri
- Page 56 and 57: Labour marketAverage annual wages a
- Page 59 and 60: IV. EDUCATIONStatistical Reference
- Page 61 and 62: Education1. Educational institution
- Page 63 and 64: Education2. Pupils and students by
- Page 65 and 66: Education3. Teaching staff by level
- Page 68 and 69: EducationGeneral schoolsGeneral sch
- Page 70 and 71: EducationVocational training - I le
- Page 72 and 73: EducationVocational training - II l
- Page 74 and 75:
EducationVocational training - III
- Page 76 and 77:
EducationVocational training - IV l
- Page 78 and 79:
EducationTertiary educationStudents
- Page 80 and 81:
EducationSchools, teaching staff an
- Page 83:
Education21. Net enrolment rate of
- Page 87 and 88:
Culture and art1. Publishing2008 20
- Page 89 and 90:
Culture and art3. Theatres2009 2010
- Page 91 and 92:
6. MuseumsCulture and art2009 2010
- Page 93 and 94:
Culture and art10. Libraries with c
- Page 95 and 96:
Culture and art13. Radio and televi
- Page 97 and 98:
VI. HEALTHStatistical Reference Boo
- Page 99 and 100:
1. Health establishments as of 31.1
- Page 101 and 102:
Health3. Medical care of the popula
- Page 103:
Health4. Registered cases of diseas
- Page 106 and 107:
Household income, expenditure and c
- Page 108 and 109:
Household income, expenditure and c
- Page 110 and 111:
Household income, expenditure and c
- Page 112 and 113:
Household income, expenditure and c
- Page 114 and 115:
Household income, expenditure and c
- Page 116 and 117:
Household income, expenditure and c
- Page 118 and 119:
Crimes with penalty inflictedStatis
- Page 120 and 121:
Criminality and justicePersons conv
- Page 123 and 124:
IX. NATIONAL ACCOUNTSStatistical Re
- Page 125 and 126:
National accounts1. Gross domestic
- Page 127 and 128:
National accounts3. Volume indices
- Page 129 and 130:
National accounts4. Gross domestic
- Page 131 and 132:
National accounts5. Gross domestic
- Page 133:
National accounts7. Gross domestic
- Page 136 and 137:
FinanceMonetary aggregatesMoney sup
- Page 138 and 139:
FinanceClaims of the monetary finan
- Page 140 and 141:
FinanceInterest ratesInterest rates
- Page 142 and 143:
FinanceDeposits and loans of Househ
- Page 145 and 146:
XI. PRICESStatistical Reference Boo
- Page 147 and 148:
Prices1. Annual consumer prices ind
- Page 149 and 150:
Prices2. Annual average consumer pr
- Page 151 and 152:
Prices4. Annual average harmonized
- Page 153 and 154:
Prices6. Producer price indices on
- Page 155 and 156:
Prices7. Producer price indices for
- Page 157:
Prices8. Price indices of goods and
- Page 160 and 161:
Exports and imports of goodsForeign
- Page 162 and 163:
Exports and imports of goodsExports
- Page 164 and 165:
NetherlandsНидерландияHu
- Page 166 and 167:
Exports and imports of goodsExports
- Page 169 and 170:
XIII. BALANCE OF PAYMENTSStatistica
- Page 171 and 172:
Balance of payments(Million EUR)1.
- Page 173:
Balance of payments2. FDI flows in
- Page 176 and 177:
Tangible fixed assetsExpenditure on
- Page 178 and 179:
Tangible fixed assetsAcquired tangi
- Page 181 and 182:
XV. DOMESTIC TRADE;ACCOMMODATION AN
- Page 183 and 184:
Domestic trade; Accommodation and f
- Page 185 and 186:
Domestic trade; Accommodation and f
- Page 187:
Domestic trade; Accommodation and f
- Page 190 and 191:
IndustryProduction value of industr
- Page 192 and 193:
IndustryStructure of the production
- Page 194 and 195:
IndustryProduction value indices of
- Page 196 and 197:
IndustryIndustrial products in kind
- Page 198 and 199:
6. Output of basic industrial produ
- Page 201 and 202:
XVII. CONSTRUCTION ANDHOUSING FUNDS
- Page 203 and 204:
Construction and housing fund1. Pro
- Page 205 and 206:
Construction and housing fund2. Hou
- Page 207:
Construction and housing fund4. Bui
- Page 210 and 211:
Overall energy balance sheetThe Ove
- Page 212 and 213:
EnergyFinal energy consumptionFinal
- Page 214 and 215:
EnergyElectricity and heatElectrici
- Page 217 and 218:
XIX. TRANSPORT ANDCOMMUNICATIONSSta
- Page 219 and 220:
Transport and communications1. Basi
- Page 221 and 222:
Transport and communications3. Good
- Page 223:
Transport and communications5. Post
- Page 226 and 227:
TourismAccommodation establishments
- Page 228 and 229:
TourismNights spentThe total number
- Page 230 and 231:
TourismTrips of Bulgarian residents
- Page 233 and 234:
XXI. FORESTRYStatistical Reference
- Page 235 and 236:
Forestry1. Forest area 1 2009 2010
- Page 237 and 238:
Forestry3. Management of the forest
- Page 239 and 240:
Forestry5. Wood 1 2009 2010 2011 20
- Page 241:
Forestry6. Game 1 2009 2010 2011 20
- Page 244 and 245:
AgricultureUtilized agricultural ar
- Page 246 and 247:
AgricultureAgricultural crops produ
- Page 248 and 249:
LivestockAgricultureInformation on
- Page 250 and 251:
AgricultureEconomic accounts for ag
- Page 253 and 254:
XXIII. ENVIRONMENTStatistical Refer
- Page 255 and 256:
MethaneEnvironment1. Emissions of p
- Page 257 and 258:
Environment2. Water abstraction, wa
- Page 259 and 260:
Environment3. Surveyed points of no
- Page 261 and 262:
Environment4. Expenditure on protec
- Page 263 and 264:
Environment6. Municipal wasteMeasur
- Page 265 and 266:
Environment7. Protected natural sce
- Page 267 and 268:
XXIV. RESEARCH AND DEVELOPMENT ACTI
- Page 269 and 270:
Research and development activity a
- Page 271:
Research and development activity a
- Page 274:
ISSN 1313-9436NATIONAL STATISTICAL