united-utilities-annual-report-2015
united-utilities-annual-report-2015
united-utilities-annual-report-2015

You also want an ePaper? Increase the reach of your titles
YUMPU automatically turns print PDFs into web optimized ePapers that Google loves.
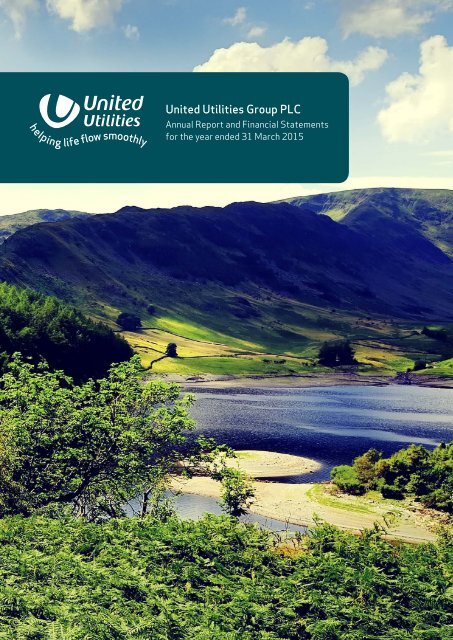
helping life flow smoothlyUnited Utilities Group PLCAnnual Report and Financial Statementsfor the year ended 31 March <strong>2015</strong>
United Utilitiesat a glanceUnited Utilities is the UK’s largestlisted water company.Through its subsidiary, United Utilities Water Limited, itmanages the regulated water and wastewater network inthe North West of England, providing services to aroundseven million people and businesses. The vast majority ofthe group’s assets and profit are derived from its regulatedUK water business.WHERE WE OPERATEKEY FACTSCarlisleWorkingtonWhitehavenKendalBarrow-in-FurnessLancasterBlackpoolBurnleyPrestonBlackburnBoltonLiverpool ManchesterStockportWarringtonChesterCrewe• We look after more than 55,000 hectares ofcatchment land, helping to protect the quality ofour water resources• We manage around 120,000 km of water pipesand sewers to help our customers’ lives flowsmoothly• Our 567 wastewater treatment works help toensure that the water returned to the environmentmeets all UK and European legislation• Our 93 water treatment works deliver around1,700 million litres of water to 3.2 millioncustomers every day• We own 178 reservoirs, ensuring our customerscan enjoy a resilient water supply• We’ve invested around £3.8 billion in 2010–15which has delivered significant customer andenvironmental benefits and grows the regulatorycapital valueCarlisle
UNITED UTILITIES GROUP PLC ANNUAL REPORT AND FINANCIAL STATEMENTS <strong>2015</strong>Stock Code: UU.<strong>united</strong><strong>utilities</strong>.comREASONS TO INVEST• We have a clear vision to be a leading North West service provider and oneof the best UK water and wastewater companies• Our management team has extensive commercial, operational andregulatory experience• Our wholesale revenue and asset base is linked to RPI inflation• Clarity on allowed returns through to 2020• We’ve made significant improvements in customer service and operationalperformance, with more to come• Externally recognised responsible business credentials• We’re delivering customer and environmental benefits through substantialcapital investment, which drives long-term growth in the regulatory capital value• Track record of regulatory outperformance; exceeded our 2010–15 targets• We have a robust capital structure: stable A3 credit rating• Our sustainable dividend policy targets a growth rate of at least RPIinflation per annum to at least 2020• Total dividend per share of 37.70 pence for 2014/15Integrated <strong>report</strong>This <strong>annual</strong> <strong>report</strong> has been prepared in accordance with the principlesset out in the International Framework published by the InternationalIntegrated Reporting Council in December 2013.ONLINE ANNUAL REPORThelping life flow smoothlyImportant informationOur <strong>annual</strong> <strong>report</strong> is available online at:corporate.<strong>united</strong><strong>utilities</strong>.comCautionary statement:The Annual Report and Financial Statements (the Annual Report) contains certain forward-looking statements withrespect to the operations, performance and financial condition of the group. By their nature, these statements involveuncertainty since future events and circumstances can cause results and developments to differ materially from thoseanticipated. The forward-looking statements reflect knowledge and information available at the date of preparation ofthis Annual Report and the company undertakes no obligation to update these forward-looking statements. Nothing inthis Annual Report should be construed as a profit forecast. Certain regulatory performance data contained in this AnnualReport is subject to regulatory audit.Terms used in this <strong>report</strong>:Unless expressly stated otherwise, the ‘group’, ‘United Utilities’ , ‘UU’ or ‘the company’ means United Utilities Group PLCand its subsidiary undertakings; the ‘regulated business’, ‘regulated activities’ or ‘UUW’ means the licensed water andwastewater activities undertaken by United Utilities Water Limited (formerly United Utilities Water PLC) in the NorthWest of England.Strategic <strong>report</strong>United Utilities at a glanceOppositeReasons to invest 01Our highlights 2014/15 02Chairman’s and Chief ExecutiveOfficer’s statement 06Our vision and strategy 10How we create value 14Our responsible approach to doingbusiness 20Our operating environment 22Key achievements 2010–15 30Our key performance indicators2010–15 32Our performance 2014/15 34Our plans for <strong>2015</strong>–20 46Our key performance indicators<strong>2015</strong>–20 50Principal risks and uncertainties 52GovernanceCorporate governance <strong>report</strong> 56Board of directors 58Letter from the Chairman 60Nomination committee <strong>report</strong> 68Audit committee <strong>report</strong> 76Corporate responsibility <strong>report</strong> 82Remuneration committee <strong>report</strong> 84Directors’ <strong>report</strong> 104Statement of directors’responsibilities 111Financial statementsIndependent auditor’s <strong>report</strong> 114Consolidated income statement 118Consolidated statement ofcomprehensive income 119Consolidated and companystatements of financial position 120Consolidated statement ofchanges in equity 121Company statement of changesin equity 122Consolidated and companystatements of cash flows 123Accounting policies 124Notes to the financial statements 127Shareholder informationShareholder information 164Look out for these iconsRead more online atcorporate.<strong>united</strong><strong>utilities</strong>.comRead more information inStrategic ReportRead more information inGovernanceRead more information inFinancial StatementsRead more information inShareholder InformationSHAREHOLDER INFORMATION FINANCIAL STATEMENTS GOVERNANCE STRATEGIC REPORT01
UNITED UTILITIES GROUP PLC ANNUAL REPORT AND FINANCIAL STATEMENTS <strong>2015</strong>Stock Code: UU.<strong>united</strong><strong>utilities</strong>.comOperational highlights 2014/15Delivered a strong overallperformance for the benefitof all our stakeholders2010–15 outperformanceExceeded regulatoryoutperformance targets,enabling us to reinvest£280mto benefit customersCapital investmentMuch improved delivery ofcapital investment programme:£869mup 4%further enhancing our assets forthe benefit of customersCustomer serviceSignificant customer serviceimprovements over 2010-15recognised in Ofwat’s finaldeterminationAsset serviceabilityMet water and wastewaterasset serviceability standardsOfwat and Environment Agency KPIsUpper quartile operationalperformance on Ofwat andEnvironment Agency KPIassessmentsResponsible businessRetained ‘World Class’ rating inDow Jones Sustainability Indexfor the 7th consecutive yearSee how we performed againstour operational KPIs on page 33Read more about our operationalperformance on pages 34 to 3902
UNITED UTILITIES GROUP PLC ANNUAL REPORT AND FINANCIAL STATEMENTS <strong>2015</strong>Stock Code: UU.<strong>united</strong><strong>utilities</strong>.comFinancial highlights 2014/15Revenue£1,720m(2013/14: £1,689m)1,513m10/11Underlying operating profit*£664.3m(2013/14: £634.6m)Total dividend per share37.70p(2013/14: 36.04p)596.4m10/1130.00p1,565m11/12594.1m11/1232.01p1,636m12/13604.2m12/1334.32p1,689m13/14634.6m13/1436.04p1,720m14/15664.3m14/1537.70pRevenue was up by £31 million, or 1.9 per cent, to £1,720million. This increase is lower than the allowed regulatedprice rise for 2014/15 of 3.8 per cent nominal (1.2 per centreal price increase, plus 2.6 per cent RPI inflation), mainlyreflecting the previously announced special customerdiscount which has been applied to this year’s bills.Underlying operating profit increased by £30 million to£664 million, as we continue to tightly manage our costbase, despite the expected increase in depreciation andother cost pressures, including bad debt. There was alsoa planned, phased reduction in infrastructure renewalsexpenditure in the year, as we completed the five-yearregulatory period.Total dividend per ordinary share for 2014/15 of 37.70pence. This is an increase of 4.6 per cent on last year, as wedelivered our 2010-15 dividend policy.SHAREHOLDER INFORMATION FINANCIAL STATEMENTS GOVERNANCE STRATEGIC REPORT10/1111/1212/1313/1414/15See how we performed againstour financial KPIs on page 32* A reconciliation between underlying operating profit and <strong>report</strong>edoperating profit is shown on page 45Read more about our financialperformance on pages 40 to 4503
AnytimeWhenever our customers need us, we’ll be there,giving them the kind of service that’s as goodas our wonderful water.
STRATEGICREPORTDetailing the past year’s performance and how it has beenachieved alongside our future vision and strategy, thestrategic <strong>report</strong> gives a comprehensive picture of wherethe business is and where it is going.Chairman’s and Chief ExecutiveOfficer’s statement 06Our vision and strategy 10How we create value 14Our responsible approach to doing business 20Our operating environment 22Key achievements 2010–15 30Our key performance indicators 2010–15 32Our performance 2014/15 34Our plans for <strong>2015</strong>–20 46Our key performance indicators <strong>2015</strong>–20 50Principal risks and uncertainties 52
UNITED UTILITIES GROUP PLC ANNUAL REPORT AND FINANCIAL STATEMENTS <strong>2015</strong>Stock Code: UU.<strong>united</strong><strong>utilities</strong>.comChairman’s and Chief ExecutiveOfficer’s statementThe last 12 monthperiod was the fifthand final year of the2010–15 regulatoryperiod. Our objectiveover this period was todeliver improved andsustainable underlyingperformance for thebenefit of customers,the environment andshareholders. We arepleased to <strong>report</strong> thatwe achieved this.We were the mostimproved watercompany for customersatisfaction over2010–15We invested£3.8bnin the renewal and upgradeof our assets across thelast five yearsSteve Mogford Chief Executive Officer and Dr John McAdam ChairmanCustomersCustomer satisfaction remainsa priority and we were the mostimproved water company over the2010–15 regulatory period. Ourimprovements have helped reducefurther the number of customerswho need to contact us about theservice they receive by around 75per cent over the five-year period.We continually review the causes ofcustomer dissatisfaction and reviseour training, policies, processesand systems to drive improvement.We were pleased that our improvedcustomer satisfaction performanceover the period took us out of Ofwat’sservice incentive mechanism (SIM)penalty zone, thereby also benefitingshareholders.Ofwat will change the process it usesto assess customer satisfactionduring the next five-year regulatoryperiod. This new SIM measure has beenpiloted over the last 12 months and hashelped us identify that, while customersatisfaction with our services iscontinually improving, we could dobetter in keeping customers informedwhilst we are resolving their issue.This will be a key area of focus forus in continuing to deliver improvingsatisfaction.Modern customer relationshipmanagement (CRM) systems can offera much improved customer experienceas well as efficiencies in customerfacingoperations. We were pleased toreceive Ofwat’s support for our planto invest in a new CRM system in the<strong>2015</strong>–20 period and we are alreadyin the detailed design phase beforeimplementation.Our assetsThe reliable and efficient operation ofour assets is critical to both customerservice and our environmentalperformance.Targeted investment in our assets,processes and the people who operatethem has supported an improvementin our environmental performance asmeasured by the Environment Agency(EA), positioning us again as one of thebest performers in our sector.06
UNITED UTILITIES GROUP PLC ANNUAL REPORT AND FINANCIAL STATEMENTS <strong>2015</strong>Stock Code: UU.<strong>united</strong><strong>utilities</strong>.comPerformance against indices used bythe Drinking Water Inspectorate (DWI)to measure water quality has alsoimproved and we achieved our bestever performance over the last year.Asset serviceability was assessed asstable or improving over the last 12months, representing a significant andsustained improvement since the startof the 2010–15 regulatory period.We were delighted to outperform ourleakage target for the year – the ninthsuccessive year in which we have metor beaten our target.The improvements made early inthe 2010–15 regulatory period toour project and risk managementprocesses have supported thesuccessful delivery of our capitalprogramme. We invested a substantial£3.8 billion in the renewal and upgradeof our assets across the last five years,with over £850 million invested overthe last 12 months. We measure theeffectiveness of our investment usingour Time, Cost and Quality index forwhich we scored 97 per cent this year– ahead of our targets and consistentwith the good performance of theprevious year.We have already invested around £40million to accelerate project deliveryrelating to schemes due to be deliveredearly in the <strong>2015</strong>–20 period and tosecure associated benefits.A difficult economic environmentAlthough unemployment in theNorth West has reduced over thelast 12 months, our region has thehighest proportion of disadvantagedhouseholds in England and thereforecustomer indebtedness continues tobe a significant challenge for us.Our collections team continues to workhard to contain bad debt levels. Duringthe year we implemented data sharingwith the credit reference agency‘Experian’ and this is helping to identifythose customers who could pay theirbill but choose not to. For thosestruggling to pay, we continue to offera wide range of ways to help them backinto regular payment. This includesan independently administered trustfund for which we increased our <strong>annual</strong>contribution using a cash tax refundfrom HMRC. We also gained customersupport to launch a social tariff forthose customers who receive PensionCredit.Business retailHaving secured a retail licence in 2012,we have been a leading competitor inthe Scottish business retail marketsecuring over 200 customers, coveringover 2,800 sites, and representingfuture <strong>annual</strong> revenue of £15 million.During this period we have seen thenumber of active market participantsincrease to around 18 and as aconsequence, pricing is becomingincreasingly competitive. We continueto bid selectively for profitablebusiness where our value-addedsolutions offer benefits to customers.The Water Act 2014 confirmed plansto open the English business retailmarket for water and wastewaterservices in 2017. Our experience ofthe Scottish business retail market isinvaluable ahead of the English marketopening and work is in hand to prepareour business retail and wholesaleteams to address this development. Weare actively engaged in the creation ofa market operating company that willgovern and facilitate the switching oftheir retailer by business customers.StrategyOur Strategic Direction Statement,‘Playing our part to support the NorthWest’ reflects extensive consultationwith customers and other stakeholdersto create our best view of what thenext 25 years holds for our region.This includes economic, social andenvironmental developments such asthe predicted impact of climate change.Our recently updated Water ResourcesManagement Plan, which describes theprojected pattern of water resourceactivity in our region until 2040, wasapproved by the Secretary of Statein February <strong>2015</strong>. This plan projectsthat the majority of the North Westwill be in surplus, benefiting from anintegrated network that supportsmovement of water around the regionto accommodate its changing supplyand demand balance. Our plan includesa new Thirlmere pipeline to extend ourintegrated network to encompass WestCumbria. This will reduce abstractionfrom Ennerdale, thus protectingsensitive ecology, and improve securityof supply for customers.As a lone agent, United Utilities couldnot deliver the scale of requiredenvironmental improvement at anacceptable level of cost. Instead we arecommitted to partnering with otherswho can support the achievementof our required outcomes – such asour ‘Turning tides’ partnership withthe EA, local authorities, the MarineConservation Society and otherinterested parties to improve bathingwaters in the North West.SHAREHOLDER INFORMATION FINANCIAL STATEMENTS GOVERNANCE STRATEGIC REPORT07
UNITED UTILITIES GROUP PLC ANNUAL REPORT AND FINANCIAL STATEMENTS <strong>2015</strong>Stock Code: UU.<strong>united</strong><strong>utilities</strong>.comChairman’s and Chief ExecutiveOfficer’s statementPictured: Our new £1.5 million purpose-builttechnical training centre in Bolton is part ofour training and apprenticeship programmeto source the next generation of waterengineers. Facilities include mechanical andelectrical workshops, a laboratory and amock sewer system, with around 70 traineesattending each day.Sharing successWe have sought to share the benefitsof our improvements over the lastfive years between customers, theenvironment and shareholders.Around £200 million of capitalsavings has been reinvested inprojects that deliver benefits tocustomers or the environment.We have also used a portion of ourfinancing outperformance to supportour private sewer network.We received a cash tax refundfrom HMRC in 2013/14 and wehave committed to share this withcustomers. We provided a specialcustomer discount in 2014/15of around £20 million and havecommitted further support to helpcustomers struggling to pay theirbills.Our customers are set to benefitfrom both continued significantlevels of investment and belowinflation growth in averagehousehold bills for the decade to2020.Price ReviewThe <strong>2015</strong>–20 Price Reviewrepresented a significant departurefrom previous reviews and proved to bea demanding period for both companiesand regulators. Building on some of thechanges introduced in the Water Act2014, the Price Review introduced:• significantly enhanced customerconsultation on the content andpricing of companies’ businessplans;• a new pricing structure involvingfour price caps: business retail,domestic retail, wholesale water andwholesale wastewater;• new outcome delivery incentives(ODIs) providing penalties orrewards for company performancein aspects of its performanceidentified by customers as apriority;• a new SIM measure providingcontinuing focus on customersatisfaction; and• preparation for full opening ofthe retail market for businesscustomers.In formulating our <strong>2015</strong>–20 businessplan, we sought the views of over27,000 customers, as well as theviews of our regulators and otherstakeholders, to shape a plan thatstrikes the right balance for all ourstakeholders. We worked closelywith our regulators over the lastyear and our final plan resubmissionin October 2014 took account ofOfwat’s upper-quartile efficiencytargets across many aspects of ouroperations. Ofwat’s final determinationin December represented a furtherefficiency challenge of £188 million,in the context of a wholesale totalexpenditure (totex) allowance of £5.3billion. Whilst challenging to deliver, thefinal determination has not requiredus to revisit the key components of ourbusiness plan.In the final analysis, the boardconsidered Ofwat’s proposal tough but,on balance, acceptable and confirmedits acceptance in January <strong>2015</strong>.Attractive to shareholdersWe set out to deliver improvedperformance for customers andshareholders over the last five-yearperiod. We delivered for both sets ofstakeholders with improved customersatisfaction, better underlyingoperational performance and effectivecapital programme management.Revenue increased by 1.9 per cent to£1.72 billion and underlying operatingprofit was up 4.7 per cent to £664million. Underlying earnings per shareincreased by 16 per cent to 51.9 pence.We exceeded our outperformancetargets for the five years, supportingour dividend growth target throughoutthe period and building dividendcover as we approached the changesintroduced in the <strong>2015</strong>–20 Price Review.The board is proposing a final dividend of25.14 pence per ordinary share, makinga total of 37.70 pence per ordinaryshare for the 2014/15 financial year.08
UNITED UTILITIES GROUP PLC ANNUAL REPORT AND FINANCIAL STATEMENTS <strong>2015</strong>Stock Code: UU.<strong>united</strong><strong>utilities</strong>.comThis represents an increase of 4.6per cent compared with last year. Thefinal dividend is expected to be paid toshareholders on 3 August <strong>2015</strong>.In accepting our final determination,the board approved a policy ofmaintaining the existing level ofdividend and targeting a growth rate ofat least RPI inflation each year throughto 2020.To support the retention of a robustcapital structure, we aim to maintainefficient access to debt capitalmarkets throughout the economiccycle. The board believes that it isappropriate to keep gearing, measuredas net debt to regulatory capital value,within our existing target range of 55to 65 per cent. We also aim to maintain,as a minimum, our existing creditratings of A3 with Moody’s and BBB+with Standard & Poor’s for UnitedUtilities Water Limited.<strong>2015</strong>–20 performanceWe are focused on continuousimprovement and our new operatingmodel for our wholesale business isemploying technology and new workprocesses to deliver enhanced customersatisfaction and operational efficiency.Measurement of our progress acrossthe next five years will use a mix ofexisting and new measures, whichreflect the revised structure andfeatures of this price control. Thisforthcoming period will see a greateremphasis on operational excellence as ameans of earning financial rewards.We expect that our environmentaland water quality regulators, theEA and the DWI respectively, willcontinue to use a basket of establishedmeasures to assess our performance.New for the next period is a revisedSIM measure and a series of ODIs,to which are attached penalties andrewards. We will also focus more ontotal expenditure, rather than on theindividual measures of opex and capex ,in line with Ofwat’s move to this way ofassessing costs.We have refined our key performanceindicators (KPIs) for the <strong>2015</strong>–20period, which will recognise thetougher operational and financialtargets inherent in the finaldetermination settlement. We donot intend to set targets for the<strong>2015</strong>–20 period until we have moreexperience of operating under thenew arrangements. However, moredetail of these KPIs is provided withinthis <strong>report</strong> on pages 50 and 51 andwe intend to publish our performance<strong>annual</strong>ly.Responsible businessOur aim is to operate in anenvironmentally sustainable,economically beneficial and sociallyresponsible manner. In recognitionof this focus, we retained our ‘WorldClass’ rating as measured by the DowJones Sustainability Index, achievingindustry leading status in the multiutility/watersector in the most recentassessment.We are delighted to have led aNorth West pilot for the Energy andEfficiency Industrial Partnership,backed by UK Skills, in which weleveraged our investment in a newapprentice skills training facilityin Bolton to help young people findemployment. The programme involvesskills training, interview technique andwork experience and early trials haveshown an over 60 per cent success ratein finding full-time employment forparticipants. Following the success ofthe pilot, the programme is now beingrolled out across the UK.Our employeesNone of our progress over the last12 months would have been achievedwithout the enthusiasm and commitmentof the people who work for UnitedUtilities – both our employees and thoseworking for our sub-contracting partnersthat represent us in the field. We wouldlike to thank them for their dedicationand hard work in supporting customersand the environment every day of theyear.We work hard to sustain high levels ofengagement by our employees. Thecompany has seen significant changeover the last four years and our planswill engage our teams for furtherimprovements. Employee engagementis 79 per cent, well above the UKtransitional norm and just below thenorm for high performing UK companies.Health and safety remains a key focusarea. This year we placed greateremphasis on the ‘health’ component withinvestment in a new gym at our mainoffice, along with measures to assist ouremployees in assessing their health andin securing faster access to treatmentshould it be necessary.Our boardWe strive to operate in a manner thatreflects the highest standards ofcorporate governance. Our companystructure and governance standardsare designed to ensure that ourboard continues to provide sound andprudent governance in compliance withthe principles of the UK CorporateGovernance Code.We are pleased to welcome LordStephen Carter to the board followinghis appointment in September 2014 asan independent non-executive director.Stephen is Chief Executive at Informaplc and his operational expertise andprevious public services roles will be anasset to the board.OutlookWe are encouraged by our operationaland customer service performanceimprovements and believe we canimprove further. Substantial investmentin our assets will continue, deliveringadditional benefits for our customersand the environment. We have madesignificant and sustained performanceimprovements over the last five yearsand, combined with our ‘systemsthinking’ approach to operating thebusiness, this provides a solid foundationfor the future.Dr John McAdamChairmanSteve MogfordChief ExecutiveOfficerSHAREHOLDER INFORMATION FINANCIAL STATEMENTS GOVERNANCE STRATEGIC REPORTThe strategic <strong>report</strong> on pages 4 to 55 was approved at a meeting of the board on 20 May <strong>2015</strong> and signed off on itsbehalf by Steve Mogford, Chief Executive Officer.09
UNITED UTILITIES GROUP PLC ANNUAL REPORT AND FINANCIAL STATEMENTS <strong>2015</strong>Stock Code: UU.<strong>united</strong><strong>utilities</strong>.comOur vision and strategyThe water industrymakes a wide-rangingcontribution to society,from the health of peopleand the environmentto the strength of theeconomy.Our vision is to become aleading North West serviceprovider and one of the bestUK water and wastewatercompaniesPlanning for futurewater demandOur 25-year Water ResourceManagement Plan sets out theinvestment needed to ensurethat we have sufficient water tocontinue supplying our customers,taking into account the potentialimpact of climate change.Read more online at<strong>united</strong><strong>utilities</strong>.com/waterresourcesplanAchieving our visionOur vision is to become a leading North West service provider and one of the bestUK water and wastewater companies. We will deliver this by providing the bestservice to customers at the lowest sustainable cost and in a responsible manner.Our 25-year strategyIn order to maintain a reliable,high quality water service for ourcustomers in the future, we have tolook a long way ahead and anticipatethose changes and core issues thatare likely to impact on our activities.Our long-term strategy helps us todefine what we need to deliver overthe shorter term.The water industry makes a widerangingcontribution to society,from the health of people and theenvironment to the strengthof the economy.In the next 25 years, we will face manychallenges and opportunities including:• climate change and its implicationsfor water resources and flooding;• the emergence of a more open,competitive UK water market;• more rigorous environmentalregulations; and• the ever-present need to combineaffordable bills with a modern,responsive water and wastewaterservice.By anticipating these changes andbalancing them with our customers’priorities, we can meet the future withconfidence.What we will aim to do:2017We will be ready whenfull retail competitionfor business customersis introduced2020Over 90% ofmeters will beautomaticallyread2025We will extendour integratedwater supplynetwork intoWest Cumbria2030We will work withothers to achieve‘Blue Flag’ beachesalong our coastline2040We will serve600,000 morehouseholds in theNorth West<strong>2015</strong> 2020 2025 2030 2035 204020162020We will adopt all We will reduceprivate pumping by more thanstations40% thenumber ofpropertiesflooded internallyby sewage2020+We will continueto improvebathing watersto at least‘sufficient’ or‘good’ status2027We willimprove allinland riversto be at least‘good’ status2035We will halveour CO2emissions from2005/06 levels2040We will install3 million extrawater meterscovering 76%of households10
UNITED UTILITIES GROUP PLC ANNUAL REPORT AND FINANCIAL STATEMENTS <strong>2015</strong>Stock Code: UU.<strong>united</strong><strong>utilities</strong>.comHow we will achieve our 25-year strategyOur Strategic Direction Statement, ‘Playing our part to support the North West’(which can be downloaded at corporate.<strong>united</strong><strong>utilities</strong>.com/future), sets out ourlong-term strategy for the next quarter century.It examines the challenges aheadand explains how we will focus ourresources and talents in order to meetthem. We consulted with thousands ofcustomers and stakeholders to ensuretheir expectations are reflected in ourplans.Our customer promisesPROVIDE GREAT WATERDISPOSE OF WASTEWATERGIVE VALUE FOR MONEYTheir feedback helped create our fivecustomer promises which, togetherwith the 11 outcomes (shown on page13), will guide the way we deliver ourservices, now and long into the future.DELIVER A SERVICE CUSTOMERS CAN RELY ONPROTECT AND ENHANCE THE ENVIRONMENTThese customer promises are reflected in our business plan for the next fiveyears, which focuses on providing the best service to customers, at the lowestsustainable cost and in a responsible manner (see next page).Our approach to doing businessOur long-term strategy is underpinned by our responsible approach to doingbusiness, which is explained on pages 20 and 21.SHAREHOLDER INFORMATION FINANCIAL STATEMENTS GOVERNANCE STRATEGIC REPORT11
UNITED UTILITIES GROUP PLC ANNUAL REPORT AND FINANCIAL STATEMENTS <strong>2015</strong>Stock Code: UU.<strong>united</strong><strong>utilities</strong>.comOur vision and strategyOur focus remains ondelivering high levels ofservice to customers atthe lowest sustainablecost, all whilst actingresponsibly.Each five-year investmentperiod is designed to help usachieve our longer term visionStrategic deliveryOur five-year plan for 2010–15 wasfocused on improving customersatisfaction, meeting our statutoryobligations and delivering shareholdervalue. This plan was designed to builda platform to enable us to effectivelydeliver our long-term strategy.A summary of our key achievementsacross 2010–15 is shown on pages 30and 31.As we begin the next five-year periodto 2020 we are looking to build onour recent achievements, retainingour focus on delivering high levels ofservice to customers at the lowestsustainable cost, all whilst actingresponsibly. This is designed to helpus achieve our vision of becoming aleading North West service providerand one of the best UK water andwastewater companies.Our focus on delivering for ourcustomers includes striving to bea leading company in the areas ourregulator benchmarks for the industry,such as on customer satisfaction(SIM). We also assess our performanceagainst other leading organisationsin the North West through anindependent brand tracker survey.As detailed in the economic regulationsection on page 29, the regulatoryenvironment has evolved for the <strong>2015</strong>–20 period, and our key performanceindicators are also evolving toreflect this. With the move to a moreoutcomes based approach, the newoutcome delivery incentives (ODIs) arekey metrics to assess performanceacross a wide range of operationalmeasures. In the now separatedbusiness retail price control, with theexpansion of competition, measuringthe impact of customer gains andlosses is an important metric.Metrics for assessing lowestsustainable costs include ouroutperformance against the newtotex model (replacing separate opexand capex models for 2010–15) andfinancing levels set by Ofwat. Withthe retail household price controlnow being separated, we are alsointroducing a new KPI to measure ourcosts in this area.The degree to which our actions areviewed as responsible is taken fromperformance measures set by theindustry regulator, the EnvironmentAgency and those which measureglobal best practice, as defined by theDow Jones Sustainability Index.Our KPI performance for 2010–15 isshown on pages 32 and 33 and furtherdetails on our <strong>2015</strong>–20 KPIs are shownon pages 50 and 51.In addition, executive bonuses andlong-term incentives are intrinsicallylinked to our financial and operationalperformance and further details areprovided on pages 84 to 103.12
UNITED UTILITIES GROUP PLC ANNUAL REPORT AND FINANCIAL STATEMENTS <strong>2015</strong>Stock Code: UU.<strong>united</strong><strong>utilities</strong>.comTHE BEST SERVICETO CUSTOMERSDelivering excellentservices to our customers byanticipating and respondingto their needs.Deliver a service customers canrely on, provide great water anddispose of wastewater• Customers are highly satisfiedwith our service and find it easyto do business with us• Drinking water is safe and clean• Customers have a reliable supplyof water now and in the future• Wastewater is removed andtreated without customersever noticing• The risk of sewer flooding forhomes and businesses is reduced• Serviceability• SIM – qualitative• SIM – quantitative• Wholesale ODI composite• SIM – qualitative• SIM – quantitative• Business retail customer growthOur strategy – to deliver value by providing:AT THE LOWESTSUSTAINABLE COSTProviding services as efficientlyas possible on a cost basis thatcan be sustained over thelong-term.Customer outcomes:Give value for money• Customer bills are fair• We support those customerswho are struggling to pay• The North West’s economy issupported by our activitiesand investmentHow we measured our performance – KPIs 2010–15:• Opex outperformance• Financing outperformance• Capex outperformanceHow we will measure our performance – KPIs <strong>2015</strong>–20• Totex outperformance• Financing outperformance• Domestic retail cost to serveIN A RESPONSIBLEMANNERManaging responsibly ourinteraction with the environment,the communities where weoperate and our employees.Protect and enhance theenvironment• The natural environment isprotected and improved in theway we deliver our services• The North West’s bathing andshellfish waters are cleanerthrough our work• Our services and assets arefit for a changing climate• Leakage• EA performance assessment• Dow Jones Sustainability Index• Leakage• EA performance assessment• Dow Jones Sustainability IndexSHAREHOLDER INFORMATION FINANCIAL STATEMENTS GOVERNANCE STRATEGIC REPORT13
UNITED UTILITIES GROUP PLC ANNUAL REPORT AND FINANCIAL STATEMENTS <strong>2015</strong>Stock Code: UU.<strong>united</strong><strong>utilities</strong>.comHow we create valueWe create value forour stakeholdersprincipally by agreeingand then delivering,or outperforming, ourregulatory contract.A long-term approach isessential to creating valueToday we benefit from the strategicdecisions and work delivered byour predecessors over the last 150years to provide the North West withgood quality water and to reducethe environmental impact of thewastewater we treat.The work we do today will help toensure customers of the North Westcontinue to enjoy an effective, efficientservice for many generations to come.We create value for our stakeholdersprincipally by agreeing and thendelivering, or outperforming, ourregulatory contract. The way we useour key resources and interact with ourever-evolving external environment,influenced by our long-term strategicapproach, helps to achieve valuecreation. This also facilitates thedelivery of our five customer outcomesalongside ensuring investors receive anappropriate return.Pictured: The £100 million Davyhulme sludgerecycling centre treats the wastewater sludgefrom half the North West’s population, withthe potential to generate up to 80GWh ofelectricity each year.14
UNITED UTILITIES GROUP PLC ANNUAL REPORT AND FINANCIAL STATEMENTS <strong>2015</strong>Stock Code: UU.<strong>united</strong><strong>utilities</strong>.comHow we create valueStrategic themesKey resourcesHow we add valueCustomer outcomesTHE BESTSERVICETO CUSTOMERSPeople• Employees• SuppliersECONOMIC • TECHNOLOGICAL •Financing• Debt• EquityLOWESTSUSTAINABLECOSTLong-term planning: 25-year Strategic Direction Statement• Committed, capableand motivated workforce• Close collaborationwith suppliersShort-term planning: 5-year Business Plan• Improving customerservice• Enhancing debtcollection activitiesProvide greatwater• Robust and efficientmix of debt and equityfinancing• Raising low costfinance• Implementing hedgingstrategiesDispose ofwastewaterExternal environmentPOLITICAL AND REGULATORY • SOCIA • NATURALDeliver a servicecustomers canrely onAssets• Reservoirs• Treatment works• Networks• Carefully planned,disciplined investment,applying efficient,long-term costsolutions• Embracing innovation• Minimising total costson a sustainable basis• Delivering regulatorycommitments andcustomer promisesGive value formoneyLRESPONSIBLEMANNERNatural Resources• Water• Waste• Catchment land• 25-year WaterResourceManagement Plan• Responding to climatechange• Sustainable catchmentmanagement• Reducing pollutionincidents• Meeting economicleakage target• Increasing renewableenergy productionProtect andenhance theenvironmentSHAREHOLDER INFORMATION FINANCIAL STATEMENTS GOVERNANCE STRATEGIC REPORTProvide an appropriate return for investors15
UNITED UTILITIES GROUP PLC ANNUAL REPORT AND FINANCIAL STATEMENTS <strong>2015</strong>Stock Code: UU.<strong>united</strong><strong>utilities</strong>.comHow we create valueExternal environmentEconomicChanges in the economy, suchas inflation, interest rates, orunemployment levels, can influenceour ability to create value. Whilstoutside of our direct control, wecan mitigate some of the potentialadverse impact associated withmarket movements, such as oninflation and interest rates, throughour hedging strategies. More detailsabout the economic environment aredescribed on page 29.TechnologicalAdvances in technology can be usedto help deliver improvements inthe quality or cost of our service.Embracing innovation, using moderntechnology or techniques, is at theheart of how we do business. Forexample, our Davyhulme sludgerecycling centre which employeda ground-breaking configurationof thermal hydrolysis to maximiseenergy generation from sludge, wonan Annual Institute of ChemicalEngineers award for innovation in2013/14. We also have to be mindfulof our customers’ ever increasinguse of technology and we have beenimproving our website and usingtext messages and social media toexpand communication options withcustomers. More information on howwe are embracing innovation is shownwithin our 2014/15 performance onpages 34 to 45.Political and regulatoryOver a long time frame the politicaland regulatory environment canchange significantly. In the 26years since the water industry wasprivatised by the UK Government, wehave seen substantial tightening oflaws and regulations. Whilst to someextent, changes to the regulatoryenvironment are outside of ourdirect control, maintaining a goodreputation is important to enablepositive participation in regulatorydiscussions. By positively engagingand using our industry knowledge, wecan help influence future policy withthe aim of achieving the best outcomefor our customers, shareholders andother stakeholders.SocialWe see some significant societaltrends that we plan to address inour long-term strategy. The NorthWest remains the most socially andeconomically deprived region inEngland and so we can anticipatecontinued hardship for a number ofcommunities and difficulties for somecustomers in paying their bills. Wewill remain committed to supportingthese customers through a suite ofpayment assistance schemes andlooking at new ways to help, likethe introduction of our social tariffin <strong>2015</strong>. We anticipate an increasein the North West population ofaround 600,000 by 2040 (more thanthe population of a large city suchas Liverpool). We are planning toensure our services and supportinginfrastructure meet the needs of thisgrowing population, which will includea higher proportion of older people.NaturalPlanning far into the future ensuresthat we are prepared for the changingnatural environment, most notablythe effects of climate change. Wehave a responsibility to return waterto the environment safely and weare focused on reducing pollutionincidents, caused by spills from ournetwork. We can make an importantcontribution to protecting andenhancing the natural environment byusing fewer natural resources and weare reducing our carbon footprint aswell as increasing renewable energyproduction. More detail across eachof these areas is provided within the‘Our natural environment’ section onpage 25.16
UNITED UTILITIES GROUP PLC ANNUAL REPORT AND FINANCIAL STATEMENTS <strong>2015</strong>Stock Code: UU.<strong>united</strong><strong>utilities</strong>.comKey resourcesPeopleOur employees play a critical rolein increasing long-term valuegeneration. Fundamental to thedecisions we take and operationalperformance we deliver is a skilled,engaged and motivated team.We place a strong emphasis onproviding comprehensive trainingand development opportunities. Ourlatest engagement score is <strong>report</strong>edin ‘Our performance 2014/15’on page 38. Management has arange of incentives which focus onperformance over a number of years,rather than just the current year, toencourage the delivery of benefitsover the longer term.Our suppliers and contractorsprovide us with essential serviceswhich we rely on to deliver ourstrategy. It is vital that we workclosely with them, for example onlarge capital projects where thedelivery of projects on time, tobudget and with minimal customerimpact has economic, societal andenvironmental benefits. Closecollaboration is important to helpsupport the delivery of thesebenefits and, for example, oursuppliers contributed significantlytowards our c£7 billion estimatedcontribution to the regional economyover the 2010–15 period. ‘Ourresponsible approach to doingbusiness’ on pages 20 and 21outlines the standards we expect ofour suppliers.FinancingWe aim to maintain a robust andresponsible capital structure,balancing both equity and debt toachieve a strong investment gradecredit rating. Our proactive equityand credit investor programmesallow us to engage effectivelywith investors. Issuing new debt isparticularly important as our capitalinvestment is largely financedthrough a mix of debt and cashgenerated from our operations. Wemaintain access to a broad range ofsources of finance in a number ofmarkets across which best relativevalue is sought when issuing newdebt. The European InvestmentBank is our largest lender with c£1.9billion of debt and undrawn facilites.Locking in long-term debt at goodrelative value can help keep ourfinance costs low and enablesus potentially to outperform theindustry-allowed cost of debt.Sustained low-cost finance acrossthe industry benefits customerbills. The average life of our termdebt is over 20 years. Our prudentfinancial risk management policiescovering credit, liquidity, interestrate, inflation and currency riskhelp reduce the group’s exposureto the economic and regulatoryenvironment.Our employees playa critical role inincreasing long-termvalue generationThe average life of ourterm debt is over20 yearsSHAREHOLDER INFORMATION FINANCIAL STATEMENTS GOVERNANCE STRATEGIC REPORT17
UNITED UTILITIES GROUP PLC ANNUAL REPORT AND FINANCIAL STATEMENTS <strong>2015</strong>Stock Code: UU.<strong>united</strong><strong>utilities</strong>.comHow we create valueKey resourcesAssetsOur fixed assets (including all ourreservoirs, treatment works and pipes)have a replacement cost of around £80billion which is the estimated amount itwould cost for another company to buildsimilar assets and networks. However,it is not the replacement cost of ourassets upon which we are allowed toearn a return, through our revenues. Weearn a return on our regulatory capitalvalue (RCV), a regulatory measure of ourcapital base, which is currently just over£10 billion, so it is this asset value whichis more important economically.Many of our assets are long-term innature – for example, our impoundingreservoirs have a useful economiclife of around 200 years. By carefullyreviewing our potential capital projects,considering the most efficient longtermsolutions, we can save futureoperating costs, also helping to reducefuture customer bills. Embracinginnovation in our asset configurationand work processes can help to makeour future service better, faster orcheaper.Since privatisation in 1989, total capitalinvestment of over £14 billion hasprovided substantial benefits to ourcustomers and our region’s environmentas well as contributing to the NorthWest economy through job creation,both within our company and in oursupply chain. Disciplined investment,along with RPI inflation, also grows ourRCV, increasing future revenues.We need to continue with a substantialinvestment programme for theforeseeable future in order to meetever more stringent environmentalstandards and to maintain and improvethe current standards of our assets andservices.However, in deciding on our investmentstrategy, we have to be mindful of theimpact on our customers’ bills, and thisis why, for example, we are spreadingsome of the environmental spendrequired by European legislation overthe next 15 years.Natural resourcesWhilst rainfall in the North West ofEngland is greater than other partsof the country, and thus supplyis not as constrained, it is still ineveryone’s interest to make the mostof this precious resource. We haveencouraged customers to use watermore efficiently and have increasedthe number of households fitted withmeters. We also have a regulatory<strong>annual</strong> leakage target which we aimto meet each year.We own over 55,000 hectaresof land around our reservoirs.Through our sustainable catchmentmanagement programme (SCAMP),we can effectively manage thesecatchments to protect and enhancewater quality and to provide otherbenefits such as an improved naturalenvironment. Over the past fiveyears we have invested £12 millionthrough this programme. Our newCatchment Wise project is lookingat working with others to improvethe lakes, rivers and coastal waterswhere we return wastewater.As well as water and our catchmentland, another key resource is waste.Sludge from wastewater can beprocessed to generate renewableenergy, helping to save power costsand protect the environment. Ouradvanced digestion facility atDavyhulme is one of the largestworks of its type in the world. Wealso recycle waste by supplyingtreated biosolids to agriculture,which provides a valuable resourceto farmers.18
UNITED UTILITIES GROUP PLC ANNUAL REPORT AND FINANCIAL STATEMENTS <strong>2015</strong>Stock Code: UU.<strong>united</strong><strong>utilities</strong>.comShorter term (up to five years)Ofwat, our economic regulator,determines the prices we can chargeour customers to provide them withwater and wastewater services.Ofwat sets our regulatory contractfollowing the receipt of our five-yearplan proposals (see the ‘Regulatoryenvironment’ section on page 26 forfurther details).By submitting a robust, balancedplan, we can help ensure we receivea regulatory contract that allowsfor the best overall outcome for ourcustomers, shareholders and theenvironment.Once each five-year regulatorycontract is set, we create valueprincipally by delivering oroutperforming it by providing thebest service to customers, at thelowest sustainable cost and in aresponsible manner. Investing inour people to ensure a committed,capable and motivated workforce isa major contributor to delivering highperformance. Some of the key wayswe create value over this shorter timeframe are by:• improving customer service – whichwill improve efficiency, reduce costsand reduce potential penalties/increase rewards from Ofwat, underits service incentive mechanism(SIM);• enhancing our debt collectionactivities – which will reduce ourretail costs. Alongside this, wecontinue to provide comprehensivesupport for customers strugglingto pay;• raising low-cost finance – whichhelps us outperform the financecosts allowed in our regulatorycontract;• implementing our hedgingstrategies, such as fixing mediumterminterest rates and powercosts, to reduce the volatility ofthese costs, helping us meet ourregulatory contract;• minimising total costs on asustainable basis, such as on power,materials and property rates – whichhelps us meet or outperform totexcosts allowed in our regulatorycontract;• delivering our operational andregulatory commitments – whichhelps ensure we achieve highlevels of customer service andmeet environmental standards.Our performance can also resultin potential financial rewards orpenalties such as those linked to ouroutcome delivery incentives (ODIs),which include reliably deliveredhigh-quality water and reducingpollution and sewer floodingincidents;• meeting our regulatory leakagetarget – which provides waterresource and customer supplybenefits and avoids any unfundedexpenditure requirements from ourregulators; and• increasing our production ofrenewable energy from waste –which helps protect us from risingenergy costs and reduces ourcarbon footprint.Over the 2010–15 regulatory period,outperformance was generatedmainly through efficiency savings onoperating costs, capital expenditureand financing costs. Ofwat’s SIMassessment also rewarded companieswho performed well on customerservice, or penalised companies whoperformed badly, relative to otherwater companies.Our KPIs over this period, includingfor 2014/15, were reflective of thesepotential areas for outperformance,and how we performed is describedwithin the ‘Our performance 2014/15’section on pages 34 to 45. ‘Keyachievements 2010-15’ on pages 30and 31 also outlines our progress overthe last five years, particularly in theimportant area of customer service.Ofwat has evolved the regulatoryframework so that, over the <strong>2015</strong>–20period, the way we can add value haschanged. Operating costs and capitalinvestment are no longer separatelyassessed as they are now combinedinto a new ‘totex’ methodology. Therewill be additional rewards or penaltiesbased on performance as measuredthrough a range of ODIs. Ofwat iscontinuing with its SIM assessmentfor household customers with a similarincentive and penalty framework.Companies are still incentivised tooutperform in the area of financingcosts. The progressive opening upof the retail market for businesscustomers will also encouragecompanies to improve service. We willcontinue to improve our service to helpus win more out of area customersand, importantly, to retain our existingcustomers.Our KPIs for <strong>2015</strong>–20 have evolved toreflect the changes in the regulatoryframework and further details of theseare shown on pages 50 and 51.SHAREHOLDER INFORMATION FINANCIAL STATEMENTS GOVERNANCE STRATEGIC REPORT19
UNITED UTILITIES GROUP PLC ANNUAL REPORT AND FINANCIAL STATEMENTS <strong>2015</strong>Stock Code: UU.<strong>united</strong><strong>utilities</strong>.comOur responsible approachto doing businessOur aim is to protectpublic health andprovide excellentservices to ourcustomersWe believe that responsiblebusiness should be embeddedin everything we do and thisshould be evident across all ofour activitiesWe continue toinvest in our localcommunities bothfinancially andthrough employeevolunteeringWe are committed to delivering our services in a responsible way and ourapproach to responsible business practice is outlined in our Business Principlesdocument available on our website at corporate.<strong>united</strong><strong>utilities</strong>.com/<strong>united</strong><strong>utilities</strong>-business-principles.Some of the key components of our approach areset out in more detail below:Customers: Our aim is to protect publichealth and provide excellent servicesto our customers. This means removingthe need for customers to contact usunnecessarily, to taking ownership ofqueries and satisfactorily resolvingthem as quickly as possible, whilekeeping our customers informed alongthe way. We aim to provide bills thatrepresent good value for money.Environment: Whether it’s treatingand delivering drinking water forour customers, or returning treatedwastewater to rivers and the sea, we’reacutely aware of our responsibility tothe environment. We continue to investto protect and, where appropriate,enhance the natural environmentof the North West. We continue toconsider the impacts of climate changeon the services we deliver and adaptaccordingly. Our greenhouse gasdisclosures can be found on pages 104and 105.Communities: The communities in whichwe operate are of great importanceto our business – it is where ourcustomers and employees live andwork. We continue to invest in ourlocal communities both financially andthrough employee volunteering. Werecognise the effect that our operationscan have on the community and investin programmes that support affectedareas or help tackle current socialissues.Employees: Health and safety isparamount and we strongly focus on ourperformance in this area. High employeeengagement is a key contributorto our performance and we placeThe table below shows the male:female ratio of people at United Utilities.<strong>2015</strong> Male FemaleGroup board 6 (75%) 2 (25%)Senior managers– Executive team* 4 (57%) 3 (43%)– Other senior managers 39 (80%) 10 (20%)Wider employees 3,428 (63%) 1,986 (37%)* Figures exclude CEO and CFO, who are included in group board figures.We also have 15 (79 per cent) male and 4 (21 per cent) female employees who areappointed as statutory directors of subsidiary group companies but who do notfulfil the Companies Act 2006 definition of ‘senior managers’.20
UNITED UTILITIES GROUP PLC ANNUAL REPORT AND FINANCIAL STATEMENTS <strong>2015</strong>Stock Code: UU.<strong>united</strong><strong>utilities</strong>.comsignificant emphasis on maintaining andstrengthening levels of engagement.Our policies on maternity, paternity,adoption, personal and special leave gobeyond the minimum required by law.For disabled applicants and existingemployees, we are committed tofulfilling our obligations in accordancewith the relevant legislation. Applicantswith disabilities are given equalconsideration in the application process.Disabled colleagues have equipmentand working practices modified forthem as far as possible and whereverit is safe and practical to do so. Wevalue diversity, providing equalityof opportunity and recruiting andpromoting on merit.Delivering good value: We arecommitted to honouring ourresponsibility to our shareholders,credit investors and those who provideus with goods and services. How wecreate value for our stakeholders is setout on pages 14 to 19. We work withsuppliers whose business principles,conduct, and standards align with ourown. Our key suppliers have committedto our Sustainable Supply Chain Charter,supporting us in the delivery of widersocial, economic and environmentalbenefits.Running our business with integrityWe have procedures and policies inplace to ensure we act in accordancewith the Universal Declaration of HumanRights.Given the long life of our infrastructure,we take a long-term view of ouroperations and key to the group’sstrategic objectives is the goal tooperate in a more sustainable manner.Sustainability is fundamental to themanner in which we undertake ourbusiness and the group has, for manyyears, included corporate responsibility(CR) factors as a strategic considerationin its decision making. Our boardlevelCR committee (see pages 82and 83) develops and oversees ourCR strategy and this continuing focushelped the group retain our Dow JonesSustainability Index ‘World Class’ rating.Read more about our Responsible BusinessPerformance on pages 37and 38Our business principles document can befound at corporate.<strong>united</strong><strong>utilities</strong>.com/<strong>united</strong>-<strong>utilities</strong>-business-principlesBusiness InsightWhat our customersthink of usEvery month, an independent agency contacts around 600 households who wehave recently had contact with. They are asked to rate their experience and tosay how satisfied they are with our service and what would make it better.This gives us great insight into how tomake improvements in our customerservice, whether it’s how we deal withwater supply problems, bill paymentsor other enquiries. According tothose surveyed across 2014/15,the majority of customers rated ourservice in the highest category of‘very satisfied’. This is supported bythe improvements we have seen incustomer satisfaction over recentyears, as evidenced by Ofwat’s SIMassessment – see ‘Key achievements2010–15’ on pages 30 and 31.However, a minority of customerssuggested we could have done betterand we are listening carefully to theirfeedback as we strive for continuousimprovement. Another valuablesource of information is providedthrough our programme of proactivelytexting around 1,000 customers aday who have recently contacted usby mobile phone, inviting them to rateour service and provide any feedback.Our WOW Awards scheme givescustomers a forum to say ‘thank you’to any individual employee who hasprovided excellent customer service.The forum allows the customers tosuggest ways in which we can improveour overall customer experience.Some of the comments have beentruly inspiring and demonstrate thededication and commitment of ourstaff.To assess customers’ perceptionsof United Utilities and how theycompare to nine other major serviceproviders in our region, every quarterwe commission an independentagency to contact over 1,000household and business customers.Throughout the quarterly surveyswe have consistently ranked 3rd outof 10 overall for customer service,behind only John Lewis and Marks& Spencer but ahead of sevenother major organisations coveringsectors including <strong>utilities</strong>, telecoms,media and banking services. Across2014/15, we ranked particularlyhighly on the attributes of being‘Socially responsible’ (2nd out of 10)as well as being ‘Trustworthy’ (3rd outof 10) and having a ‘Good reputation’(3rd out of 10). Our lowest rankingwas on ‘Innovation’ (5th out of 10)although this is an area of renewedfocus for us and customer perceptionson this attribute have been graduallyimproving over the last few years.Personality traits customersassociate with United Utilities• Efficient• Reliable• HelpfulSHAREHOLDER INFORMATION FINANCIAL STATEMENTS GOVERNANCE STRATEGIC REPORT21
UNITED UTILITIES GROUP PLC ANNUAL REPORT AND FINANCIAL STATEMENTS <strong>2015</strong>Stock Code: UU.<strong>united</strong><strong>utilities</strong>.comOur operating environmentWe provide servicesto approximatelyseven million peoplein the North West ofEnglandThe water industrycurrently invests around£80 million a week inmaintaining and improvingassets and servicesOur industry and marketEvery day, over 50 million household and business consumers in England andWales receive water and wastewater services. These are served by 10 licensedcompanies which provide both water and wastewater services.Pictured: We celebrated 100 years of sewagetreatment at Davyhulme this year. The ‘activatedsludge’ process began life at our own Davyhulmetreatment works back in 1914 and harnessedthe power of micro-organisms which meant thatwaste from millions of people could be treatedin a relatively small space.Additionally, there are licensedcompanies which provide water-onlyservices and tend to be smaller in size.As each company in the water sectoroperates as a regional monopolyfor its services, they are subject toregulation in terms of both price andperformance.The privatisation of the industry overtwo decades ago has been widelyperceived as a success, making asignificant contribution to publichealth. It has led to improvementsin the quality of services providedto customers, higher environmentalstandards and superior quality drinkingwater at lower estimated costs tocustomers than if the water sectorwas still owned by the UK Government.The water industry currentlyinvests around £80 million a week inmaintaining and improving assets andservices.22
UNITED UTILITIES GROUP PLC ANNUAL REPORT AND FINANCIAL STATEMENTS <strong>2015</strong>Stock Code: UU.<strong>united</strong><strong>utilities</strong>.comOur customersUnited Utilities Water holds licences toprovide water and wastewater servicesto a population of approximatelyseven million people in the North Westof England. We provide services toapproximately three million householdsin our region and this generates aroundtwo-thirds of our total revenues. Wealso serve approximately 200,000businesses, ranging in size from largemanufacturing companies to smallshops. Our focus over recent yearshas been on improving customersatisfaction.For our business customers we havebeen extending the range of valueaddedservices we offer, includingour on-site engineering solutions andwater efficiency advice. By offeringvalue for money, as well as theincreased range of services, we havebeen winning customers out of area.More details on how we are winningcustomers in the Scottish market,which offers attractive margins, can beseen on page 28.Our households pay just over £1 perday on average for the combined waterand wastewater services we provide.Our price determination for <strong>2015</strong>–20means customers will benefit frombelow inflation increases to averagehousehold bills for the decade to 2020.Average household bill*Average household bill (£)6005004003002001000Our objective is to continue to provideour customers with high qualitydrinking water to meet all their dailyneeds and environmentally responsiblewastewater collection and treatmentat a price that represents good valuefor money.We are continuing to invest heavily forour customers. During the five-yearperiod to <strong>2015</strong>, we delivered a capitalinvestment programme of around £3.8billion as we continued to improve ourasset base, delivering further benefitsfor customers. Capital investment willcontinue at high levels in the <strong>2015</strong>–20period and is expected to remain highbeyond 2020 as we continue to:• upgrade our region’s water andwastewater networks;• maintain our ageing assets;• deliver a cleaner environment;• provide high quality water to ourcustomers; and• improve our customers’ experience.We have a strong focus on effectivedelivery of our capital programme, akey driver of value, for customers, theenvironment and shareholders.2009/10 2010/11 2011/12 2012/13 2013/14 2014/15 <strong>2015</strong>/16 2016/17 2017/18 2018/19 2019/20RPIAverage household billCustomers will benefitfrom below inflationincreases in averagehousehold bills for thedecade to 2020SHAREHOLDER INFORMATION FINANCIAL STATEMENTS GOVERNANCE STRATEGIC REPORT* Assumes 3% p.a. RPI inflation from 2016/17 to 2019/2023
UNITED UTILITIES GROUP PLC ANNUAL REPORT AND FINANCIAL STATEMENTS <strong>2015</strong>Stock Code: UU.<strong>united</strong><strong>utilities</strong>.comOur operating environmentOur business uses a combination oftechnology and the natural environmentto become part of the water cycleOur water cycleWe collect water from the environment, clean and distribute it to our customers before collecting it, treating it,and then returning it back to the environment.The treatedwater is thenreturned safely backinto rivers and the sea.We recycle water backto rivers and the seaWe collect water fromthe environmentWater is collected from ourcatchment land and storedin our 178 reservoirs ortaken directly fromboreholes.We clean thewaterWater istreated in our 93water treatment worksto produce high qualitydrinking water.We treat thewastewaterWastewater istreated in our 567wastewater treatment worksso that it meets stringentenvironment standards and isready to return to theenvironment.UnitedUtilitiesWaterCycleClean water isprotected in ourcovered reservoirs.clean waterWe store theWe collectwastewaterWastewater iscollected from ourcustomers and takento our treatmentworks using our78,000km ofsewerage pipes.3m householdsand 200,000business customerscan enjoy our watersupply and wastewatercollection services24 hours a day.A clean, reliablesupply of around 1,700million litres of water aday is distributed to ourcustomers’ taps usingour 43,000kmnetwork of pipes.We distributethe waterCustomers usethe water24
UNITED UTILITIES GROUP PLC ANNUAL REPORT AND FINANCIAL STATEMENTS <strong>2015</strong>Stock Code: UU.<strong>united</strong><strong>utilities</strong>.comOur natural environmentWe plan far into the future to ensurewe are prepared for the changingnatural environment, most notably theeffects of climate change. With severedry periods becoming increasinglycommon, we must ensure we continueto have resilient water resources andan infrastructure capable of movingwater efficiently around the region.The potential effect of climate changeon our future water resources isincluded in our 25-year Water ResourceManagement Plan. We must seek totackle flooding incidents caused bythe intensive bursts of rainfall, whichare becoming more frequent dueto changing weather patterns, andensure we are able to meet increaseddemand on our sewerage network asthe regional population is expected toincrease. A phased, long-term approachensures that the necessary work can bedelivered whilst not placing too muchpressure on customer bills.We have a responsibility to return waterto the environment safely. Spills fromour network can lead to pollution whichcan damage the natural environmentand could lead to loss of reputationand financial penalties, depending ontheir severity. Our number of seriouspollution incidents has decreased overrecent years and it is an important areaof focus within our 25-year StrategicDirection Statement. The EnvironmentAgency assesses water companies’performance across a basket ofmeasures including pollution and itsoverall assessment is included as oneof our KPIs (see page 33) with all of thepollution sub-measures also <strong>report</strong>edwithin our Corporate Responsibilitypages on our website.We can make an important contributionto protecting and enhancing the naturalenvironment by using fewer naturalresources. We have been drivingdown our carbon footprint over thelast decade and have plans to halveemissions by 2035, from a 2005/06starting position. Our greenhouse gasdisclosures can be found on pages104 and 105. Less than 10 per centof our waste goes to landfill and ouruse of recycled products is increasing.We are increasing our renewal energyproduction with plans to furtherincrease this over the longer term,including wind and solar opportunities.This will provide environmental benefitsand add value to shareholders throughenergy cost savings.We can make animportant contributionto protecting andenhancing the naturalenvironment by usingfewer natural resourcesPictured: As part of a £90 million scheme toimprove water quality in the Manchester ShipCanal, we took ownership of ‘Gloria’, a 140tonne tunnel-boring machine used to dig a700 metre long tunnel underneath TraffordPark.SHAREHOLDER INFORMATION FINANCIAL STATEMENTS GOVERNANCE STRATEGIC REPORT25
UNITED UTILITIES GROUP PLC ANNUAL REPORT AND FINANCIAL STATEMENTS <strong>2015</strong>Stock Code: UU.<strong>united</strong><strong>utilities</strong>.comOur operating environmentOur regulatory environmentEconomic regulationThe water industry currently operateswithin five-year planning cycles knownas Asset Management Plan (AMP)periods. Prior to the start of eachfive-year period, companies submittheir business plans which includetheir projected expenditure in orderto enhance and maintain their assets.Following review of these plans, Ofwatsets the prices each company cancharge their customers across theperiod. We have just finished the2010–15 (AMP5) period and pricecontrols for the <strong>2015</strong>–20 (AMP6)period were set in December 2014,when Ofwat published their finaldeterminations.Ofwat assesses companies’operational performance across a widerange of measures, including someof our key performance indicators(KPIs) such as service incentivemechanism (SIM), leakage and,from April <strong>2015</strong>, outcome deliveryincentives (ODIs). Where performancefalls short of expectations, Ofwat cantake measures, such as enforcementactions or penalties, in order to protectcustomers’ interests. Operationalperformance and customer serviceremain high priorities for us, as theyare key contributors in our drive tocreate value, as explained in moredetail on pages 14 to 19 in the ‘How wecreate value’ section.Ofwat (The Water ServicesRegulation Authority) is theeconomic regulator of the waterand sewerage sectors in Englandand Wales, responsible forensuring the companies providecustomers with a good-quality,efficient service at a fair price.www.ofwat.gov.ukOfwat review <strong>2015</strong>–20Ofwat introduced a number ofimportant changes for the <strong>2015</strong>–20(AMP6) price review, with the aim ofevolving the sector in order to meetfuture challenges and placing greaterfocus on customers’ needs.Moving away from one single pricecontrol, there are now four separateprice controls:• wholesale water, covering thephysical supply of water;• wholesale wastewater, coveringthe removal and treatment ofwastewater;• household retail, covering customerfacingactivities (principallycustomer contact, billing, meterreading and cash collection) forhousehold customers; and• non-household retail, coveringcustomer-facing activities forbusiness customers.Separate retail price controls shouldprovide retail businesses with greaterincentives and focus on deliveringmore efficient service to businesscustomers as competition expands,and also to household customers undera new average cost to serve approach.This new retail household model allowseach water company only to chargeits customers an amount based onthe average costs of the industryplus any allowed company-specificadjustments, such as our £20 millionper annum special allowance to reflectthe very high levels of deprivationin the North West (see ‘Economicenvironment’ on page 29).The way companies’ operating andcapital costs are assessed has beenmodified to encourage companies toutilise the most efficient, sustainablesolutions under a new ‘totex’ model.There is also a move to a moreoutcomes-based approach, withgreater emphasis being placed oncustomer engagement to agree theoutcomes.26
UNITED UTILITIES GROUP PLC ANNUAL REPORT AND FINANCIAL STATEMENTS <strong>2015</strong>Stock Code: UU.<strong>united</strong><strong>utilities</strong>.comEnvironmental and quality regulationThe water and wastewater industry in the UK is subject to substantial domesticand European Union regulation, placing significant statutory obligations on waterand wastewater companies with regard to, among other factors, the quality ofdrinking water supplied, wastewater treatment and the effects of their activitieson the natural environment.Defra is the UK Government department responsible forwater policy and regulations in England and Wales; it also setsdrinking water quality and environmental standards (manybased on European law) which water companies must meet.www.gov.uk/defraThe Environment Agency controls how much water canbe drawn from the environment and the quality of waterreturned to rivers and the sea. The EA produces anassessment of water and wastewater companies’ <strong>annual</strong>performance, and we include this as one of our KPIs,see page 33. www.gov.uk/government/organisations/environment-agencyThe Drinking Water Inspectorate is responsible for ensuringcompliance with the drinking water quality regulations.www.dwi.gov.ukThe Consumer Council for Water represents customers’interests relating to price, service and value for money. Italso investigates customer complaints about water quality.www.ccwater.org.ukWATRS – an independent service designed to adjudicatedisputes that have not been resolved through the watercompany’s customer service teams or by referring thematter to the Consumer Council for Water.www.watrs.orgNatural England is responsible for the protection ofdesignated sites for nature conservation, e.g. Sites ofSpecific Scientific Interest. Companies are required tomanage these sites and to protect and enhance biodiversity.www.naturalengland.org.ukWe aim to maintain and enhance wide-ranging relationships with key peoplewithin all of these regulatory bodies to help shape balanced investmentprogrammes which address the needs of all of our stakeholders and contribute toour ability to create value.Regulatory risksGiven the complex legal and regulatory environment within which we operate, thereis a range of risks to which we are exposed. Risks can be in the form of possiblenon-compliance with existing laws or regulations or failure to meet the terms ofour current <strong>2015</strong>–20 regulatory contract. We also face risks in relation to potentialfuture changes in legislation or regulation. See pages 52 to 55 for more details inrespect of these risks.Impact of environmental legislationEuropean Union environmentallegislation will require us andother UK water companies to incuradditional capital investment toensure compliance with more stringentstandards. We do, however, recognisethat in our region we cannot achievethis alone and we are partnering withothers who also have a role to play,such as the Environment Agency, localauthorities and other interest groupssuch as the North West Rivers Trusts.The revised Bathing Water Directive,effective from <strong>2015</strong>, sets higherstandards for bathing waters. Underthe previous standards North Westbeaches achieved over 90 per centbathing water compliance. The newstandards are likely to prove verychallenging to meet. As one of manycontributors to bathing water andshellfish quality we have plannedinvestment of over £200 million across<strong>2015</strong>–20 to achieve our ‘Contributionto Bathing Waters Improved’performance commitment to helpensure compliance with the higherstandards. We will work in partnershipwith other organisations to ensureinvestment is as efficient as possible.The Water Framework Directive setsan objective that European memberstates should achieve ‘good’ statusfor all surface water beyond 2027.Considerable capital investment isrequired to meet this, which we arespreading over 12 years, balancing theneeds of current and future customers.Our <strong>2015</strong>-20 plan includes around£400 million of investment to achieveour ‘Contribution to Rivers Improved’performance commitment, whichincludes schemes relating to a numberof environmental drivers within theWater Framework Directive as well asother environmental legislation.The Habitats Directive requiresmember states to maintain biodiversityby protecting natural habitats andcertain wild species. For example,one of the key drivers for our plannedThirlmere pipeline project is to helpprotect England’s largest species offreshwater mussels in West Cumbria.See our business insight on page 47.SHAREHOLDER INFORMATION FINANCIAL STATEMENTS GOVERNANCE STRATEGIC REPORT27
UNITED UTILITIES GROUP PLC ANNUAL REPORT AND FINANCIAL STATEMENTS <strong>2015</strong>Stock Code: UU.<strong>united</strong><strong>utilities</strong>.comOur operating environmentOur competitive environmentComparative competitionOur main competitors to benchmarkour performance against are the othernine water and wastewater companies(WaSCs) across England and Wales. Weare the second largest WaSC based onthe size of our asset base, as measuredby Regulatory Capital Value (RCV). We,along with these other nine companies,comprise the vast majority of thetotal water and wastewater sector, asdepicted on the pie chart on the right.Although their relative sizes aregenerally far smaller than the waterand wastewater companies, theremaining water-only companies areimportant competitors as their relativeperformances are also includedin Ofwat’s published comparativeinformation.We have a strong drive on improvingboth absolute and relative performanceas we aim to deliver good service to ourcustomers, thereby helping to build aplatform for us to create value.Away from the water sector, in line withour vision to be a leading North Westservice provider, we also benchmarkour customer service performanceagainst other leading service providersin our region. In addition, as a publiclylisted FTSE 100 company, the otherUK and worldwide listed <strong>utilities</strong> arecompetitors from an investmentperspective.Direct competitionCurrently only very large businesscustomers are allowed to choosetheir water supplier. Under thisarrangement, the new water supplierwould buy water directly from theregional water company and be allowedto use its network for this watersupply. Although very few users haveswitched supplier in England, the 2014Water Act aims to open up future retailcompetition to all business customers,including sewerage as well as waterservices from 2017.We have been building our capabilityto ensure we are in a strong positionas the competitive business retailmarket evolves and are very active inthis expanding market. After attaininga Scottish water supply licence in2012, we quickly grew and are oneof the most successful new entrantsin Scotland. We have continued ourexpansion in 2014/15 and have nowwon over 200 customers, covering over2,800 sites and representing future<strong>annual</strong> revenue of c£15 million. Weremain a leading new entrant, althoughour selective bidding for business atattractive margins means we are notsolely focusing on growing marketshare. We also continue to offer anddevelop our range of value-addedservices, such as leak detection andrepair, waste digestion and wastewatersystem optimisation.The Water Act also paves the way forthe future introduction of competitionfor certain parts of the wholesale,or upstream, business (for examplethe input of raw or treated water intoa water company’s network or theremoval of wastewater for treatment),although any such reforms are notexpected until 2020 at the earliest.We are fully engaged with regards tomarket reform, being always mindful ofthe potential impact on our customersand the value implications for ourshareholders.Pictured: Construction on our £160 millionPreston tunnel project, helping to enhance thecity’s sewer system and prevent storm waterspilling back into watercourses. The 3.5kmtunnel can hold 40 million litres of waterduring heavy rainfall.28
UNITED UTILITIES GROUP PLC ANNUAL REPORT AND FINANCIAL STATEMENTS <strong>2015</strong>Stock Code: UU.<strong>united</strong><strong>utilities</strong>.comOur economic environmentAlthough many economic factors areoutside of the direct control of thegroup, we do, where appropriate, aimto manage the associated risks andopportunities, for the benefit of ourcustomers and shareholders.Whilst the North West unemploymentrate has followed the national trenddownwards, at 5.7 per cent for thequarter ending March <strong>2015</strong>, it remainsabove the UK average of 5.5 per cent.A <strong>report</strong>, ‘Department for Communitiesand Local Government, Indices ofDeprivation 2010’, published in March2011, highlighted that the North Westhad more of the most deprived areasin England than any other region. Evenas the North West economy recovers itis unlikely to have a significant impacton deprivation, which is the principaldriver of our higher than average coststo serve our household customers.This is currently recognised by Ofwatthrough a special allowance fordeprivation of £20 million per annumover the <strong>2015</strong>–20 period.Bad debts remain a risk to whichwe are exposed, particularly withthe continuing tightening of realdisposable incomes and the impactof recent welfare reforms likely tointensify. Whilst our debt managementprocesses have been externallybenchmarked as efficient andeffective, we will continue to refineand enhance them whilst also helpingcustomers back into making regularpayment through use of manageablepayment plans.Interest rates have remained belowthe long-term trend and we havebenefited from this as we have madefurther drawdowns on our £500 millionloan signed in 2013/14 and £100million of new debt raised in 2014/15.Comparatively low interest rates havealso been beneficial to our futurecost of debt as we continue with ourinterest rate hedging strategy.RPI inflation has declined recently,impacted by the significant fall in oilprices over the winter, and was 0.9per cent at March <strong>2015</strong>. The prices wecharge our customers (and thereforerevenues), as well as our asset base,are linked to RPI inflation, so lowerRPI will mean slightly lower growthon these measures. However, we alsohave a large quantity of index-linkeddebt which means our finance costsdecrease as inflation falls, providinga partial economic offset to revenue(although this is not a perfect hedgeas changes to revenue and indexlinkedfinance costs are based ondiffering lagged measures of inflation).Our pension liabilities are linked toinflation, which provides an additionaleconomic offset against our assetbase. Overall, we are currently moreinflation-hedged than the other listedwater and wastewater companiesso we are better protected in a lowinflation environment.United Utilities’ total contribution tothe regional economy over 2010–15was estimated at £7 billion. Directeconomic contributions from ouractivities include the purchase ofgoods and services and providingextensive employment. There is alsoan indirect economic contribution, forexample when our suppliers, in turn,make purchases from their suppliersand when people whose jobs aresupported by United Utilities spendtheir personal incomes.United Utilities’ totalcontribution to theregional economyover 2010–15 wasestimated at £7 billionWater sector RCVUnited Utilities 16%Other nine water andwastewater companies 79%Total RCV for all water-only companies 5%SHAREHOLDER INFORMATION FINANCIAL STATEMENTS GOVERNANCE STRATEGIC REPORT29
UNITED UTILITIES GROUP PLC ANNUAL REPORT AND FINANCIAL STATEMENTS <strong>2015</strong>Stock Code: UU.<strong>united</strong><strong>utilities</strong>.comKey achievements 2010–15We have continued todevelop our systemsand processes todeliver the experienceour customers seekwhen they need tocontact usSignificant operationalimprovements providinga solid platform for thenext five years75%Reduction in customer complaintsover the 2010-15 period.Our focus on improving customerserviceGreat customer service relies onunderstanding what our customersneed, anticipating problems, resolvingcomplaints quickly and courteously anddeveloping new, innovative servicesthat fit into people’s busy lifestyles.We want our customers to trust us andhave confidence in our service.Over the last five years, we havecontinued to develop our systems andprocesses to deliver the experienceour customers seek when they needto contact us, including multi-channelcontact centre technology. We haveplaced a strong emphasis on strivingfor first time resolution of customerenquiries, keeping customers informedof progress until resolution. This hasbeen underpinned by investment in ourpeople in terms of better training andimproved systems. We have enhancedour customer feedback process tohelp us respond to customers’ evolvingneeds and continuously improve.The introduction of the serviceincentive mechanism (SIM) as ameasure of customer satisfaction overthis regulatory period has providedus with a strong benchmark of waterindustry comparative performance.SIM results sit alongside our other,ongoing, research on customerexpectations and satisfaction.Customer satisfaction improvement9085Combined SIM Score80757065602011/12 2012/132013/14United Utilities Current Best Performer Current Worst Performer30
UNITED UTILITIES GROUP PLC ANNUAL REPORT AND FINANCIAL STATEMENTS <strong>2015</strong>Stock Code: UU.<strong>united</strong><strong>utilities</strong>.comKey achievements to date include:• We were the most improved waterand wastewater company asmeasured under Ofwat’s three-yearSIM assessment from 2011/12 to2013/14 (the chart on the previouspage shows how we have movedfrom just above the worst performerto just below the best performer).As well as benefiting customers, thisimproved performance also resultedin us avoiding a revenue penalty ofup to c£80 million in Ofwat’s finaldetermination;• Customer complaints reduced byapproximately 75 per cent over the2010-15 period;• Complaints warranting investigationby the Consumer Council for Water(CCW) reduced from 63 in 2010/11to zero in 2012/13 and 2013/14and two in 2014/15;• We are consistently third behindonly John Lewis and Marks &Spencer on the customer servicebrand tracker measure out of 10leading service providers in theNorth West;• Awarded ‘Best Utility’ in the Top50 Contact Centre Awards andreceived the ‘Service to the WaterIndustry’ award presented by theHouse Builders Federation; and• We are one of the leading waterretailers in Scotland despite onlyentering the market in 2012/13.Other operational improvementsWe have been working hard to improveour performance in achieving statutorycompliance and on-time delivery ofschemes contributing to water qualityand environmental improvement.Highlights include:• Delivered stable asset serviceabilityperformance or better on all fourwater and wastewater measures for2013/14 and 2014/15, avoiding apotential serviceability penalty oftens of millions of pounds;• Upper quartile sector performanceon Ofwat’s <strong>annual</strong> key performanceindicators and on the EnvironmentAgency’s assessment of water andwastewater companies 2013/14;• Met or outperformed <strong>annual</strong>leakage targets in each of the lastnine years;• Efficiency improvements indelivering our capital programmeallowed us to reinvest over£200 million of savings intoprojects which improve servicesto customers or benefit theenvironment; and• Sustainable operating costefficiencies have helped us toexceed our outperformance targetof £50 million over 2010–15 againstour allowed operating costs. Thiswas in addition to efficiency targetsset by Ofwat of approximately £150million over the five years.Financing outperformanceOur treasury function has continuedto deliver a good performance, raisingdebt at better rates than allowed bythe regulator, and we exceeded ourfinancing outperformance target of£300 million across the 2010–15period.Overall, we are pleased with thesignificant progress we have made overthe last five years, although we knowthat we still have plenty more to do.Shareholder returnsOver the 2010-15 period, we havedelivered a strong total shareholderreturn (TSR) of 115 per cent,outperforming the market. A longerterm view of our TSR relative to theFTSE 100 is shown on page 100.Efficiency improvementsin delivering our capitalprogramme allowedus to reinvest over£200 million of savingsinto projects whichimprove services tocustomers or benefitthe environmentSHAREHOLDER INFORMATION FINANCIAL STATEMENTS GOVERNANCE STRATEGIC REPORT31
UNITED UTILITIES GROUP PLC ANNUAL REPORT AND FINANCIAL STATEMENTS <strong>2015</strong>Stock Code: UU.<strong>united</strong><strong>utilities</strong>.comOur key performance indicators (KPIs)2010–15We focus on a range of financial and operational KPIs to help assess our performance. We believe that the KPIs definedbelow provide a rounded view as to how we are performing against our primary objectives, helping us on our path toreaching our long-term strategic vision. These KPIs encompass the important areas of customer service and environmentalperformance, as well as financial indicators, taking into consideration the interests of all of our stakeholders.Financial KPIsIn respect of our financial KPIs, we use underlying profit measures as these enable more meaningful comparisons of theyear-on-year performance of our business.KPI Definition PerformanceRevenueA definition of revenue is included within the ‘Accounting policies’ note on page125.£1,720m +1.9%14/15 £1,720m13/1412/1311/1210/11£1,689m£1,636m£1,565m£1,513mRegulatorycapitalexpenditureTotal regulatory capital expenditure during the year (including infrastructurerenewals expenditure).£869m +3.9%14/15£869m13/14£836m12/13£787m11/12£680m10/11£608mUnderlyingoperating profitThe underlying operating profit measure excludes from the <strong>report</strong>ed operatingprofit any restructuring costs and other significant non-recurring items. Areconciliation is shown on page 44.£664m +4.7%14/15 £664m13/14£635m12/1311/1210/11£594m£604m£596mUnderlyingearnings pershareThis measure deducts underlying net finance expense and underlying taxationfrom underlying operating profit to calculate underlying profit after tax andthen divides this by the average number of shares in issuance during the year.Underlying net finance expense makes adjustments to the <strong>report</strong>ed net financeexpense, including the stripping out of fair value movements. Underlyingtaxation strips out any prior year adjustments, exceptional tax or any deferredtax credits or debits arising from changes in the tax rate from <strong>report</strong>ed taxation.Reconciliations to the underlying measures above are shown on page 44.51.9p +16.1%14/15 51.9p13/1444.7p12/1338.7p11/1235.3p10/1135.1pDividend pershareThis measure divides total dividends declared by the average number of shares inissuance during the year.37.70p +4.6%14/15 37.70p13/1436.04p12/1311/1210/1130.00p32.01p34.32pGearing: net debtto regulatorycapital valueGroup net debt (including derivatives) divided by UUW’s regulatory capital value(Ofwat’s published RCV in outturn prices adjusted for actual capital expenditureto date).Ofwat’s assumed range for 2010–15 is 55% to 65%.59% +1%14/15 59%13/1458%12/1360%11/1210/1159%59%32
UNITED UTILITIES GROUP PLC ANNUAL REPORT AND FINANCIAL STATEMENTS <strong>2015</strong>Stock Code: UU.<strong>united</strong><strong>utilities</strong>.comOperational KPIsThese operational KPIs feed through from all of our strategic themes: the best service to customers; at the lowestsustainable cost; and in a responsible manner.Company objective/KPI Definition Target PerformanceBest service to customersServiceabilityService incentivemechanism –qualitativeService incentivemechanism –quantitativeLowest sustainable costOpexoutperformanceFinancingoutperformanceCapexoutperformanceResponsible mannerLeakage – average<strong>annual</strong> leakageEnvironmentAgencyperformanceassessmentDow JonesSustainabilityIndex ratingOfwat rates each company’s assets as‘improving’, ‘stable’, ‘marginal’ or ‘deteriorating’across four categories covering waterand wastewater infrastructure and noninfrastructureOfwat derived index based on quarterlycustomer satisfaction surveys, measuringthe absolute and relative performance ofthe 19 water companies (previously 21 up to2012/13). Each company receives a score inthe range of zero to five, with five being thehighest attainable scoreOfwat derived composite index based on thenumber of customer contacts, assessed bytype, measuring the absolute and relativeperformance of the 19 water companies(previously 21 up to 2012/13). Each companyreceives a SIM point total, where the lowestscore represents the best performanceProgress to date on cumulative operatingexpenditure outperformance versus Ofwat’sallowed operating costs over the 2010–15periodProgress to date on financing expenditureoutperformance secured versus Ofwat’sallowed cost of debt of 3.6% real over the2010–15 periodCapital expenditure (excluding private sewersand transitional investment) progress to dateagainst Ofwat’s capital expenditure allowancefor the 2010–15 period, after adjusting,through the regulatory methodology, for theimpact of construction output pricesAverage <strong>annual</strong> water leakage from ournetwork quantified in megalitres per dayComposite assessment produced by theEnvironment Agency, measuring the absoluteand relative performance of the 10 water andwastewater companies across a broad rangeof areas, including pollution.Independent rating awarded usingsustainability metrics covering economic,environmental, social and governanceperformanceTo hold at least a stablerating for all four assetclasses, which is consistentwith Ofwat’s targetTo move to the firstquartile in the mediumtermTo move to the firstquartile in the mediumtermTotal opex outperformanceover the 2010–15 periodof at least £50mTotal financingoutperformance over the2010–15 period of at least£300mTo meet Ofwat’s revisedcapital expenditureallowance for the 2010–15period (after reinvestingaround £200m ofoutperformance)To meet our regulatoryleakage target, as set byOfwat, each yearTo be a first quartileperformer on a consistentbasisTo retain ‘World Class’rating each year2014/15: 2 x improving, 2 x stable2013/14: 1 x improving, 3 x stable2012/13: 1 x improving, 3 x stable2011/12: 1 x improving, 2 x stable. 1 x marginal2010/11: 3 x stable, 1 x marginalSignificant improvement recognised by Ofwat inthe final determination14/15 n/a - AMP6 pilot year13/1412/1311/1210/117th14th16th21stSignificant improvement recognised by Ofwat inthe final determination14/1513/1412/1311/1210/11n/a - AMP6 pilot year1351792732010–15: Exceeded £50m target5392010–15: Exceeded £300m target2010–15: Reinvested over £200m ofoutperformance2014/15: 454Ml/d – Met target2013/14: 452Ml/d – Met target2012/13: 457Ml/d – Met target2011/12: 453Ml/d – Met target2010/11: 464Ml/d – Met targetDelivered another upper quartile performance in2013/14 (latest available) assessment13/14 2nd12/1311/1210/1109/107th6th2014/15: ‘World Class’2013/14: ‘World Class’2012/13: ‘World Class’2011/12: ‘World Class’2010/11: ‘World Class’3rd2ndSHAREHOLDER INFORMATION FINANCIAL STATEMENTS GOVERNANCE STRATEGIC REPORTOur performance and the progress we have made against our objectives and their associated KPIs are included within thebusiness performance section on pages 34 to 45.33
UNITED UTILITIES GROUP PLC ANNUAL REPORT AND FINANCIAL STATEMENTS <strong>2015</strong>Stock Code: UU.<strong>united</strong><strong>utilities</strong>.comOur performance 2014/15FULL YEAR RESULTS FOR THE YEAR ENDED 31 MARCH <strong>2015</strong>Continuing operationsYear ended31 March <strong>2015</strong>Year ended31 March 2014(Restated (1) )Revenue £1,720.2m £1,688.8mUnderlying operating profit (2) £664.3m £634.6mOperating profit £653.3m £630.2mTotal dividends per ordinary share (pence) 37.70p 36.04pRegulatory capital expenditure (3) £869m £836mRCV gearing (4) 59% 58%(1) The comparatives have been restated to reflect the requirements of accounting standard IFRS 11 ‘Joint Arrangements’.(2) Underlying profit measures have been provided to give a more representative view of business performance and are defined in the underlying profitmeasure tables on page 44.(3) Regulatory capex represents fixed asset additions and infrastructure renewals expenditure using regulatory accounting guidelines; there is no equivalentGAAP measure.(4) Regulatory capital value or RCV gearing calculated as group net debt/United Utilities Water’s RCV (outturn prices).Step change in performance in 2010-15regulatory period delivers benefits for allstakeholders• Significant customer service improvements, asmeasured through Ofwat’s SIM mechanism• Much improved delivery of capital investmentprogramme; Time:Cost:Quality index above 95 percent• Investment totalling c£3.8 billion over the five years,enhancing assets and services for customers• Upper quartile operational performance on Ofwatand Environment Agency KPI assessments• Strong shareholder returns and dividend policydelivered• Exceeded regulatory outperformance targets,enabling us to reinvest c£280 million to benefitcustomers• Responsible business practice, reflected by DowJones Sustainability Index ‘World Class’ ratingStrong 2014/15 financial performance• Underlying operating profit up £30 million to£664 million• RCV gearing at 59 per cent, well within our targetrange of 55 per cent to 65 per cent• Final dividend of 25.14 pence per share (total for theyear of 37.70 pence), in line with policyGood platform to deliver further value in nextregulatory period• Already a leading operational performer, providing asolid foundation for further improvements• ‘Systems thinking’ approach, leveraging technologyand data intelligence to improve efficiency• Regulatory capital investment of £3.5 billion+;network resilience, customer and environmentalbenefits• Robust capital structure and strong credit ratings• Dividend growth rate target of at least RPI inflationeach year through to 2020• Below inflation growth in average household bills forthe decade to 202034
UNITED UTILITIES GROUP PLC ANNUAL REPORT AND FINANCIAL STATEMENTS <strong>2015</strong>Stock Code: UU.<strong>united</strong><strong>utilities</strong>.comOPERATIONAL PERFORMANCEWe aim to deliver long-termshareholder value by providing:• the best service to customers;• at the lowest sustainable cost; and• in a responsible manner.Throughout the 2010–15 period,we demonstrated a strong linkbetween performance and employeeremuneration and we intend tocontinue with this approach across thenew regulatory period.Best service to customersImproving customer service willcontinue to be a significant areaof management focus and we seeopportunities to deliver furtherbenefits for our customers.Customer service – our continuingstrong focus on dealing effectivelywith customer enquiries has helped usdeliver further improvements in ourperformance, as measured by Ofwat’sservice incentive mechanism (SIM) andoutlined in the KPIs section (see panel).This is also reflected in a reduction inthe number of customer complaintsreceived, which has contributed toimprovements in opex efficiency. Theoverall number of customer complaintshas reduced by approximately 75 percent across the 2010–15 period.Our significant improvements overthe regulatory period were recognisedby Ofwat in the final determinationin December 2014, resulting in thecompany avoiding a revenue penalty.Over this period, we have continued todevelop our systems and processes todeliver the experience our customersseek when they need to contact us,including multi-channel contact centretechnology. We have placed a strongemphasis on striving for first timeresolution of customer enquiries,keeping customers informed ofprogress until resolution. This has beenunderpinned by investment in our peoplein terms of better training and improvedsystems. We have also enhanced ourcustomer feedback process to help usrespond to customers’ evolving needsand continually improve.Leading North West service provider– we are pleased to have beenconsistently ranked third out of 10leading organisations in the NorthWest, through an independent brandtracker survey which is undertakenquarterly. This covers key attributessuch as ‘reputation’, ‘trustworthy’ and‘customer service’. We are behind onlyMarks & Spencer and John Lewis,and ahead of seven other majororganisations covering <strong>utilities</strong>,telecoms, media and banking services.Robust water supply – our customerscontinue to benefit from our robustwater supply and demand balance,along with high levels of water supplyreliability. We continue to supply a highlevel of water quality, with mean zonalcompliance in excess of 99.9 per cent.Mitigating sewer flooding – we havecontinued to invest heavily in schemesdesigned to mitigate the risk of floodingof our customers’ homes, includingincidence-based targeting on areasmore likely to experience flooding anddefect identification through CCTVsewer surveys. Our plan for the <strong>2015</strong>–20period includes a target of reducingsewer flooding incidents by over 40 percent, in line with customers’ affordabilitypreferences. Our wastewater networkwill continue to benefit from significantinvestment going forward as we adaptto weather patterns likely to result fromclimate change.Asset serviceability – we have arange of actions to help support theserviceability of our assets. We areimproving the robustness of our watertreatment processes, refurbishingservice reservoir assets, continuingwith our comprehensive mains cleaningprogramme and optimising watertreatment to reduce discoloured waterevents. Our good asset serviceabilityperformance over the last few yearswas recognised by Ofwat in the finaldetermination, in December 2014, withUnited Utilities not receiving any penalty.Ofwat KPIs – our overall goodoperational performance is reflectedin Ofwat’s latest (2013/14) keyperformance indicators <strong>report</strong>.The balance of ratings for UnitedUtilities across the 15 assessmentmeasures represented an upperquartile performance, in respect ofthe 10 water and sewerage companies.Our performance in 2014/15 hasimproved further, although the industrycomparatives are not available untillater in the year.Key performance indicators:Serviceability – long-termstewardship of assets is criticaland Ofwat measures this throughits serviceability assessment(Ofwat defines serviceabilityas the capability of a system ofassets to deliver a reference levelof service to customers and tothe environment now and in thefuture). We are currently assessedas ‘improving’ for our waterinfrastructure and wastewaternon-infrastructure assetsand ‘stable’ for our water noninfrastructureand wastewaterinfrastructure assets. The aim is tocontinue to hold at least a ‘stable’rating for all four asset classes,which aligns with Ofwat’s target.Service incentive mechanism(SIM) – United Utilities continuedits progress on Ofwat’s combined(qualitative and quantitative) SIMassessment for 2013/14 (latestavailable), moving up to 9th placeout of the 18 water companies.This compares with joint 13thposition for 2012/13 (althoughOfwat previously measured outof 21 water companies). At thestart of this regulatory period,United Utilities was an outlierin last position. Our continuedprogress is encouraging, althoughwe recognise that there is stillmore to do. Ofwat is amending itsSIM methodology for the <strong>2015</strong>–20period, based on domestic retailonly and with more emphasis onqualitative performance, andOfwat and the water companieshave been piloting the newprocess. This revised methodologyis based on a different dataset and quarterly results maywell produce wider fluctuationscompared with the last regulatoryperiod.35SHAREHOLDER INFORMATION FINANCIAL STATEMENTS GOVERNANCE STRATEGIC REPORT
UNITED UTILITIES GROUP PLC ANNUAL REPORT AND FINANCIAL STATEMENTS <strong>2015</strong>Stock Code: UU.<strong>united</strong><strong>utilities</strong>.comOur performance 2014/15Lowest sustainable costPower and chemicals – our assetoptimisation programme continues toprovide the benefits of increased andmore effective use of operational sitemanagement to optimise power andchemical use and the development ofmore combined heat and power assetsto generate renewable energy. We havealready substantially locked in ourpower commodity costs across <strong>2015</strong>–20, providing greater cost certainty forthe regulatory period.Proactive network management – weare implementing a more proactiveapproach to asset and networkmanagement, with the aim of improvingour modelling and forecasting to enableus to address more asset and networkproblems before they affect customers,thereby reducing the level of reactivework and improving efficiency.Debt collection – we highlighted in May2014 that debt collection was likely tobecome more challenging for UnitedUtilities, particularly as our region suffersfrom high levels of income deprivation.Notwithstanding our industry-leadingdebt management processes and widerangingschemes to help customersstruggling to pay, including our trust fund,deprivation remains the principal driver ofour higher than average bad debt and costto serve. In 2014/15, bad debt expensehas increased by £16 million, from 2.2 percent to 3.1 per cent of regulated revenue,as a result of four main factors:• the cumulative impact of economicfactors on customers’ ability to pay;• under IFRS accounting, an increasein the number of customers recommencingpayment through ourhelp-to-pay initiatives has resultedin additional revenue recognitionand associated bad debt;• a review of bad debt provisions forbusiness customers in preparationfor systems upgrades, ahead of fullmarket opening; and• a review of operational debtprocesses and bad debt provisionsin domestic retail in preparation forthe <strong>2015</strong>–20 period.Although bad debts will continue to bechallenging for us, we do expect the levelto fall to around 2.5 per cent of regulatedrevenue in <strong>2015</strong>/16 as our recentreviews have resulted in an additionalcurrent year charge which is notexpected to continue at the same level.Pensions – United Utilities placedits pension provision on a moresustainable footing in 2010 and hassubsequently taken additional stepsto de-risk the pension scheme further.Further details on the group’s pensionprovision are provided in the pensionssection on page 43.Capital delivery and regulatorycommitments – the business is stronglyfocused on delivering its commitmentsefficiently and on time and has a robustcommercial capital delivery frameworkin place. Regulatory capital investmentin the year, including £148 million ofinfrastructure renewals expenditureand £30 million of transitional spend,was £869 million, an increase of £33million compared with 2013/14.Following our rapid increase in ourinternal Time: Cost: Quality index(TCQi) score from around 50 per cent in2010/11 to approximately 90 per centin 2012/13, we further improved ourscore and have achieved over 95 percent in both 2013/14 and 2014/15.As we strive to improve efficiencyfurther, we have implemented newcontracting arrangements for the<strong>2015</strong>–20 regulatory period to helpdeliver our regulatory capital investmentprogramme of over £3.5 billion. Wehave re-tendered our engineering andconstruction partners and selected asingle engineering partner and four newdesign and construction partners. Weare involving our partners much earlier inproject definition and packaging projectsby type, geography and timing to deliverefficiencies. Projects will be allocatedto partners on an incentive basis orcompeted between the partners and,where appropriate, third parties. Earlyresults are encouraging. Our partnershave come forward with a range ofsolutions, innovations and pricing whichis building our confidence that the finaldetermination targets we have acceptedare tough but within reach.Pictured: One of our process controllers takespart in a trial of a new custom-built phoneapplication, which aims to makes us an industryleader in how we manage our assets.Key performance indicators:Financing outperformance –United Utilities set a financingoutperformance target, acrossthe 2010–15 period, of at least£300 million, based on an averageRPI inflation rate of 2.5 per centper annum, and we have exceededthis target. We have reinvestedover £30 million of our financingoutperformance in private sewerscosts, which were not reflected in2010–15 price limits.Operating expenditureoutperformance – the businesstargeted total operatingexpenditure outperformance overthe 2010–15 period of at least£50 million, or approximately2 per cent, compared with theregulatory allowance. This wasin addition to the base operatingexpenditure efficiency targets setby Ofwat, which equated to a totalof approximately £150 millionover the five years. We are pleasedto <strong>report</strong> that we have exceededour outperformance target.Capital expenditureoutperformance – UnitedUtilities has delivered significantefficiencies in the area ofcapital expenditure and wehave reinvested over £200million of capital expenditureoutperformance for the benefitof our customers and theenvironment.36
UNITED UTILITIES GROUP PLC ANNUAL REPORT AND FINANCIAL STATEMENTS <strong>2015</strong>Stock Code: UU.<strong>united</strong><strong>utilities</strong>.comResponsible mannerActing responsibly is fundamentalto the manner in which we undertakeour business and the group hasfor many years included corporateresponsibility factors in its strategicdecision making. Our environmentaland sustainability performance acrossa broad front has received externalrecognition. United Utilities retainedits ‘World Class’ rating in the DowJones Sustainability Index for theseventh consecutive year, achievingindustry leading performance statusin the multi-utility/water sector in themost recent assessment. Retaining‘World Class’ status for this lengthof time is a significant achievement,particularly as the assessmentstandards continue to increase andevolve. United Utilities also holdsmembership of the FTSE 350 CarbonDisclosure Project Leadership Index.We are the only UK water company tohold both accolades.Leakage – our strong, year round,operational focus on leakage andthe implementation of a range ofinitiatives, such as active pressuremanagement, enabled us to again beatour leakage target in 2014/15. Ourleakage performance, alongside thenetwork resilience improvements weare making, are helping us to maintaina robust water supply and demandbalance, and deliver high levels ofreliability for our customers.Environmental performance – this isa high priority for United Utilities andwe are pleased to be an upper quartilecompany in the Environment Agency’slatest available performance metrics(2013/14), as described in the KPIssection on page 38.Carbon footprint – we are committedto reducing our carbon footprintand increasing our generation ofrenewable energy. In 2014/15, ourcarbon footprint totalled 473,708tonnes of carbon dioxide equivalent.We set a target of achieving a 21 percent reduction in carbon emissionsby <strong>2015</strong>, measured from a 2005/06baseline. We have achieved significantreductions and were pleased to meetthis target in 2013/14. However, weBusiness InsightEnergy: increasingself-generationTo supplement the electricity we generate from sludge and hydro, wehave created an energy business to exploit other opportunities using thecompany’s land, assets and skills. This business has three key aims: to useless electricity, generate more, and use our assets smarter. This shouldhelp to save energy costs, which is one of our biggest expenses at around£65 million a year, and generate revenue from renewable incentives, whichcurrently stands at around £5 million per year.Using less: through a series ofoperational projects and behaviouralprogrammes we are targeting energyefficiency savings across our waterand wastewater sites over the nextfive years.Generating more: we have securedplanning approvals for two 500kWwind generation facilities at two ofour sites and expect these turbinesto be generating power in <strong>2015</strong>. Wehave a number of potential schemesat the early stages of developmentwith two schemes currently in theplanning process.Last year we installed 2 megawattsof solar panels across four sites. Thisincluded our Fleetwood treatmentworks, (pictured below), which, with5,281 panels, is now one of thebiggest solar panel installations inthe North West.We have a further 8 megawatts ofsolar under construction and plan toadd a further 20 megawatts of solarthis year.Including our sludge to energyprogrammes, we have increasedenergy production from our facilitiesby around a third over the last twoyears and are targeting to increaseenergy self- generation to around 35per cent by 2020, contingent on goodprojected returns. Using our ownenergy has helped us avoid energypurchase costs of around £13 millionin 2014/15.Using smarter: we were the firstwater company to sign up toNational Grid’s Dynamic FrequencyResponse scheme under which wereduce our electricity consumptionwhen demand on the network isgreater than supply or converselyto consume energy when supplyexceeds demand. These schemesoffer incentives linked to responsetimes and availability of service.SHAREHOLDER INFORMATION FINANCIAL STATEMENTS GOVERNANCE STRATEGIC REPORT37
UNITED UTILITIES GROUP PLC ANNUAL REPORT AND FINANCIAL STATEMENTS <strong>2015</strong>Stock Code: UU.<strong>united</strong><strong>utilities</strong>.comOur performance 2014/15narrowly missed the target in 2014/15,being 19 per cent below the baseline,impacted adversely by an 11 percent increase in the carbon contentin the UK energy mix in the yearwhich increased our <strong>report</strong>ed carbonemissions. Notwithstanding this, in2014/15, we have purchased lesselectricity than in any of the previous10 years and still achieved our highestever renewable energy production of144 GWh. This is the equivalent ofc18 per cent of our total electricityconsumption, up from c17 per cent inthe previous year and c13 per cent in2012/13. We are already implementingplans to significantly increase selfgenerationover the next few years,with a target of around 35 per cent ofour electricity consumption by 2020(see business insight on page 37).Employees – we work hard to sustainhigh levels of engagement by ouremployees. The company has seensignificant change over the last fouryears and our plans will engage ourteams for further improvements.Employee engagement is 79 percent, well above the norm for UKcompanies going through businesstransition and just below the normfor high performing UK companies, soour employees demonstrate a strongcapability to adapt. We continueto be successful in attracting andretaining people and have continuedto expand our apprentice and graduateprogrammes, having recruited a further22 graduates and 32 apprentices in2014/15, taking the current total to 56graduates and 97 apprentices. As partof our health and safety improvementprogramme, we have implemented anumber of initiatives which helpedreduce the employee accidentfrequency rate to 0.112 accidents per100,000 hours for 2014/15, comparedwith a rate of 0.137 in 2013/14 and0.188 in the previous year. Whilst weare pleased with our performanceimprovement, we recognise we stillhave more to do. Health and safetywill continue to be a significant areaof focus, as we strive for continuousimprovement.Communities – we continue to supportpartnerships, both financially andin terms of employee time throughvolunteering, with other organisationsacross the North West that shareour objectives. We recently set upCatchment Wise, our new approachto tackling water quality issues inlakes, rivers and coastal waters acrossthe North West, and our ‘Beachcare’employee volunteering schemehelps to keep our region’s beachestidy. We continue to support localcommunities, through contributionsand schemes such as providing debtadvisory services and our CommunityFund, offering grants to local groupsimpacted by our capital investmentprogramme.Key performance indicators:Leakage – we met our economiclevel of leakage target forthe ninth consecutive year in2014/15, with a performance of454 megalitres per day versusthe regulatory target of 463megalitres per day.Environmental performance –on the Environment Agency’slatest assessment (2013/14<strong>report</strong>), which covers a broadrange of operational metrics,United Utilities is an upperquartile company. Based on ourperformance across the range ofmetrics, this indicates we were injoint 2nd position among the 10water and sewerage companiesand aligns with our medium-termgoal of being a first quartilecompany on a consistent basis.Corporate responsibility – we havea strong focus on operating in aresponsible manner and are theonly UK water company to have a‘World Class’ rating as measuredby the Dow Jones SustainabilityIndex. The group has retained its‘World Class’ rating and aims toretain this rating each year.Systems thinking approachTo support the delivery of ourobjectives, we are focused oncontinuous improvement and overthe last few years have progressivelyinstilled a ‘systems thinking’ approachinto the way we run our business.This is an engineering-led approachwhich integrates the use of our assets,leverages data intelligence and employstechnology and new work processes todeliver improved customer satisfactionand operational efficiency. We havemade good progress over the lastfew years and this ‘systems thinking’approach is expected to deliverbenefits of over £100 million over the<strong>2015</strong>–20 regulatory period, which arealready built into our business planassumptions.The step change in performance ofthe business over the 2010–15 periodhas its origins in good managementpractice; constancy of purpose, clearobjectives, attention to detail, goodpeople and performance management.However, it was also clear to us thatwe could improve further if we tookthe learning from other sectors totransform the way a water company isrun and we started that transformationover three years ago. There are five keyphases of transformation:• ‘Systems thinking’ – we haveprogressively instilled anengineering-led ‘systems thinking’approach which integrates theuse of our assets, leverages dataintelligence and employs technologyand new work processes. Wehave audited our asset base andare investing in a new enterpriseasset management system andfield force scheduling system,supported by the recruitment ofnew people from other sectorswith experience in these areas.By capturing and processing datafrom multiple information points,we are aiming for ever-improvingasset intelligence. We have fittedsensors in our water networks toprovide visibility as to how theyare performing, helping us toreduce burst frequency, and weare currently piloting drainagesystem performance monitoring38
UNITED UTILITIES GROUP PLC ANNUAL REPORT AND FINANCIAL STATEMENTS <strong>2015</strong>Stock Code: UU.<strong>united</strong><strong>utilities</strong>.comin our wastewater networks. Weare building enhanced visibilityof our assets and more effectivemonitoring and control, enablingus to make more informed andproactive management decisions.This should lead to better modellingand prediction of events beforethey occur, reducing reactive workand thereby improving efficiency,operational performance and,importantly, customer service.• Production lines – for the lastfew years we have considered ourtreatment works as ‘factories’,each with its own productionline. We have over 600 of these‘factories’, small and large,producing clean water, bio wasteand energy. Our business has beenrestructured to create a strongfocus on accountability and delivery,integrating the disciplines oftenfound as functional silos in othercompanies. Our managers areresponsible for the performanceof their production lines includinginvestment of capital to optimiseoperational performance, to deliverenvironmental or water qualityrequirements and to maximiseenergy production, providing a moreintegrated approach.• Organisational structurealigned with new price control– we recognised that we wouldbest address the regulatoryreform agenda by aligning ourorganisational structure withthe new price control, with threebusiness areas: Wholesale,Domestic Retail and Business Retail.We did this nearly three years agoand recruited a business retail teamexperienced in competitive utilitymarkets.• Wholesale business split – wesubsequently subdivided ourWholesale business to concentrateon three business areas: Water,Wastewater and Energy, with astrong focus on increasing ourrenewable and self-generation toreduce the amount of electricity wepurchase. Our people are all alignedto this model and our productionleadership team has responsibility,authority and accountability for theperformance of their assets usinga total expenditure, whole life costapproach to decision management.• Integrated control centre –underpinning our ‘systems thinking’ethos is our recently openedintegrated control centre inWarrington (see ‘business insight’below).Business InsightNew integrated controlcentre acts as the‘digital brain’ of oursystemsLike many companies in our sector,we have no real time view of how ourgigantic water and wastewater systemis performing. Too often our customerstell us when the service has failed andthen we react but incidents are expensive,disruptive for us and more importantly forour customers.In April <strong>2015</strong>, we opened our newintegrated control centre (ICC) (picturedbelow) at our head office in Warrington.This acts as the ‘digital brain’ of ournetwork, providing visualisation of theservice we are providing right across theregion.This has all been supported by asignificant cultural change in thecompany over the last few years, whichhas helped United Utilities progressinto a leading operational performer inthe sector. A critical enabler has beenour people and we continue to invest inattracting talent and in developing thebest, giving us a powerful mix of waterexperience and knowledge of othersectors.In preparation, we have been investingin a new digital network with over3,000 facilities which are now able totalk to each other and the ICC over ourdata highway. We are now beginning toshare real time information about theperformance of our assets.With our new ’systems thinking’ approach,our goal is to improve both efficiencyand performance and aim to prevent aproblem or fix it before a customer’sservice is disturbed.SHAREHOLDER INFORMATION FINANCIAL STATEMENTS GOVERNANCE STRATEGIC REPORT39
UNITED UTILITIES GROUP PLC ANNUAL REPORT AND FINANCIAL STATEMENTS <strong>2015</strong>Stock Code: UU.<strong>united</strong><strong>utilities</strong>.comOur performance 2014/15FINANCIAL PERFORMANCERevenueWe have delivered a good set offinancial results for the year ended31 March <strong>2015</strong>. Revenue increasedby £31 million to £1,720 million. Thisincrease principally reflects the allowedregulated price rise, partly offset by thepreviously announced special customerdiscount of £21 million.Operating profitUnderlying operating profit was up £30million to £664 million, as we tightlymanaged our cost base despite theexpected increase in depreciation andother cost pressures, including bad debt.As planned, there was also a £17 millionreduction in infrastructure renewalsexpenditure this year as we transitionfrom this regulatory period to the next.Reported operating profit increased by£23 million, to £653 million.Investment income and financeexpenseThe underlying net finance expense of£222 million was £29 million lower thanlast year, primarily reflecting the impactof lower RPI inflation on the group’sindex-linked debt. The indexation ofthe principal on our index-linked debtamounted to a net charge in the incomestatement of £47 million, comparedwith a net charge of £83 million lastyear. The group had approximately£3.1 billion of index-linked debt as at31 March <strong>2015</strong> at an average real rateof 1.6 per cent. The lower RPI inflationcharge contributed to the group’saverage underlying interest rate of 4.0per cent being lower than the rate of 4.6per cent for 2013/14.Reported investment income andfinance expense of £317 million wassignificantly higher than the £92 millionexpense in 2013/14. This £225 millionincrease principally reflects a changein the fair value gains and losses ondebt and derivative instruments, froma £129 million gain in 2013/14 to a£105 million loss in 2014/15. The £105million fair value loss is largely due tolosses on the regulatory swap portfolio,resulting from a significant decreasein medium-term sterling interest ratesduring the period, partly offset by a gainfrom the unwinding of the derivativeshedging interest rates to <strong>2015</strong>. Thegroup uses these swaps to fix interestrates on a substantial proportion ofits debt to better match the financingcash flows allowed by the regulator ateach price review. The group fixed themajority of its non index-linked debt forthe 2010–15 financial period, providinga net effective nominal interest rate ofapproximately 5 per cent.Profit before taxUnderlying profit before tax was £447million, £59 million higher than lastyear, due to the £30 million increasein underlying operating profit and the£29 million decrease in underlyingnet finance expense. This underlyingmeasure adjusts for the impact of oneoffitems, principally from restructuringwithin the business, and other itemssuch as fair value movements in respectof debt and derivative instruments.Reported profit before tax decreasedby £202 million to £342 million,primarily due to the aforementionedfair value movements.TaxationConsistent with our wider businessobjectives, we are committed to actingin a responsible manner in relation toour tax affairs.Our tax policies and objectives, whichare approved by the board on a regularbasis, ensure that we:• only engage in reasonable taxplanning aligned with our commercialactivities and we always comply withwhat we believe to be both the letterand the spirit of the law;• do not engage in aggressive orabusive tax avoidance; and• are committed to an open,transparent and professionalrelationship with HMRC basedon mutual trust and collaborativeworking.Under the regulatory framework thegroup operates within, the majority ofany benefit from reduced tax paymentswill typically not be retained by thegroup but will pass to customers viareduced bills. For 2013/14, the groupagreed, over and above the normalregulatory rules, to voluntarily sharewith customers the one-off net cashbenefit of £75 million due to the group,following the industry-wide agreementwith HMRC in relation to the abolitionof industrial buildings allowances in2008.In any given year, the group’s effectivecash tax rate may fluctuate from thestandard UK rate due to the availabletax deductions on pension contributionsand capital investment. Thesedeductions are achieved as a result ofutilising tax incentives, which have beenexplicitly put in place by successivegovernments precisely to encouragesuch investment. This reflectsresponsible corporate behaviour inrelation to taxation.The group’s effective cash tax ratemay also fluctuate from the standardUK rate due to unrealised profitsor losses in relation to treasuryderivatives where the correspondingprofits or losses are only taxed whenrealised. These movements are purelytiming differences and are expectedto continue going forward, followingHMRC’s recent review of the relevanttax rules.The group’s principal subsidiary, UnitedUtilities Water Limited (UUW), operatessolely in the UK and its customers arebased here. All of the group’s profits aretaxable in the UK (other than the group’s35 per cent holding in Tallinn Waterwhich generates around £6 millionprofit before tax with around £1 millionEstonian tax paid).In 2014/15, we paid corporation taxof £62 million, which represents aneffective cash tax rate of 18 per cent,3 per cent lower than the mainstreamrate of corporation tax of 21 per cent.In 2013/14, we paid corporation taxof £64 million. For both years, the keyreconciling items to the mainstreamrate were allowable tax deductionson net capital investment and timingdifferences in relation to fair valuemovements on treasury derivatives. In2013/14, the group also received anexceptional tax refund of £96 millionin relation to prior years’ tax matters,covering a period of over 10 years intotal.40
UNITED UTILITIES GROUP PLC ANNUAL REPORT AND FINANCIAL STATEMENTS <strong>2015</strong>Stock Code: UU.<strong>united</strong><strong>utilities</strong>.comThe current tax charge was £57 millionin 2014/15, compared with a chargeof £75 million in the previous year. Inaddition, there were current tax creditsof £10 million in 2014/15 and £141million in 2013/14, both followingagreement with the UK tax authoritiesof prior years’ tax matters.For 2014/15, the group recogniseda deferred tax charge of £14 million,compared with a charge of £41 millionin 2013/14. In addition, in 2014/15 thegroup recognised a deferred tax chargeof £9 million relating to prior years’tax matters, compared to a deferredtax credit of £13 million in 2013/14.In 2013/14, the group also recogniseda deferred tax credit of £157 millionrelating to the 3 per cent stagedreduction in the mainstream rate ofcorporation tax, substantively enactedon 2 July 2013, to reduce the rate to20 per cent by <strong>2015</strong>/16.The total tax charge, excluding one-offcharges and credits, of £71 million for2014/15 represents a rate of 21 percent, similar to the rate in 2013/14.In addition to corporation tax, the grouppays and bears further <strong>annual</strong> economiccontributions, typically of around£140 million per annum, in the formof business rates, employer’s nationalSummary of net debt movement£m7,0006,5006,0005,5005,0004,5005,515.9Net debt at31/03/14709.0Net capex249.4Dividends235.2Interest& taxinsurance contributions, environmentaltaxes and other regulatory service feessuch as water abstraction charges.Profit after taxUnderlying profit after tax of £354million was £49 million higher thanfor 2013/14, reflecting an increase inunderlying profit before tax partly offsetby an increase in underlying tax chargedue on higher profits. Reported profitafter tax was £271 million, comparedwith £739 million for 2013/14, impactedby the £234 million movement in fairvalue on debt and derivative instrumentsand the £266 million net increase in taxbetween the two periods.Earnings per shareUnderlying earnings per share increasedfrom 44.7 pence to 51.9 pence. Thisunderlying measure is derived fromunderlying profit after tax. This includesthe adjustments for the deferred taxcredits in 2013/14 associated withthe reductions in the corporation taxrate and an adjustment for the taxcredit arising from agreement of prioryears’ tax matters. Basic earnings pershare decreased from 108.3 pence to39.8 pence, for the same reasons thatreduced profit after tax.156.2 941.7Non-cashmovements& otherOperatingcash flow5,924.0Net debt at31/03/15Dividend per shareThe board has proposed a final dividendof 25.14 pence per ordinary share inrespect of the year ended 31 March<strong>2015</strong>. Taken together with the interimdividend of 12.56 pence per ordinaryshare, paid in February, this producesa total dividend per ordinary share for2014/15 of 37.70 pence. This is anincrease of 4.6 per cent, compared withthe dividend relating to last year, in linewith group’s dividend policy of targetinga growth rate of RPI+2 per cent perannum through to <strong>2015</strong>. The inflationaryincrease of 2.6 per cent is based onthe RPI element included within theallowed regulated price increase forthe 2014/15 financial year (i.e. themovement in RPI between November2012 and November 2013).The final dividend is expected to be paidon 3 August <strong>2015</strong> to shareholders onthe register at the close of businesson 26 June <strong>2015</strong>. The ex-dividend dateis 25 June <strong>2015</strong>.Cash flowNet cash generated from continuingoperating activities for the yearended 31 March <strong>2015</strong> was £707million, compared with £797 millionin the previous year. This reductionmainly reflects the receipt of theaforementioned exceptional taxrefund in 2013/14. The group’s netcapital expenditure was £709 million,principally in the regulated water andwastewater investment programmes.This excludes infrastructure renewalsexpenditure which is treated as anoperating cost under IFRS.Net debt including derivatives at31 March <strong>2015</strong> was £5,924 million,compared with £5,516 million at31 March 2014. This increase reflectsexpenditure on the regulatory capitalexpenditure programmes and paymentsof dividends, interest and tax, alongsidefair value losses on the group’s debt andderivative instruments, partly offset byoperating cash flows.SHAREHOLDER INFORMATION FINANCIAL STATEMENTS GOVERNANCE STRATEGIC REPORT41
UNITED UTILITIES GROUP PLC ANNUAL REPORT AND FINANCIAL STATEMENTS <strong>2015</strong>Stock Code: UU.<strong>united</strong><strong>utilities</strong>.comOur performance 2014/15Fair value of debtThe group’s gross borrowings at31 March <strong>2015</strong> had a carrying value of£6,645 million. The fair value of theseborrowings was £7,350 million. This£705 million difference principallyreflects the significant fall in realinterest rates, compared with the ratesat the time we raised our index-linkeddebt. This difference has increasedfrom £267 million at 31 March 2014.Gross debtYankee bonds (USD)Euro bonds (EUR)GBP bondsGBP index-linked bondsEIB and other index-linked bondsOther EIB loansOther borrowings£782.5m£424.1m£1,718.8m£1,711.3m£1,372.5m£350.0m£286.2mDebt financing and interest ratemanagementGearing (measured as group net debtdivided by UUW’s regulatory capital value)was 59 per cent at 31 March <strong>2015</strong>, anincrease of 1 per cent compared with theposition at 31 March 2014, remaining wellwithin our target range of 55 per cent to65 per cent.UUW has long-term credit ratings of A3/BBB+ and United Utilities PLC has longtermcredit ratings of Baa1/BBB- fromMoody’s Investors Service and Standard& Poor’s Ratings Services respectively.The split rating reflects differingmethodologies used by the credit ratingagencies. Both agencies have the group’sratings on stable outlook.The group has access to theinternational debt capital marketsthrough its €7 billion euro mediumtermnote programme (EMTN).On 19 November 2014, the EMTNprogramme was updated adding anew financing subsidiary of UUW,United Utilities Water Finance PLC(UUWF), to issue new listed debton behalf of UUW going forwardsfollowing UUW’s re-registration as aprivate limited company. The EMTNprogramme provides for the periodicissuance by United Utilities PLC andUUWF (guaranteed by UUW) of debtinstruments on terms and conditionsdetermined at the time the notes areissued. The EMTN programme does notrepresent a funding commitment, withfunding dependent on the successfulissue of the notes.Cash and short-term deposits at31 March <strong>2015</strong> amounted to £244million. Over <strong>2015</strong>–20 we havefinancing requirements totalling around£2.5 billion to cover refinancing andincremental debt, supporting our <strong>2015</strong>–20 investment programme. In December2013, UUW agreed a new £500 millionterm loan facility with the EuropeanInvestment Bank (EIB) and as at31 March <strong>2015</strong> UUW had drawn down£350 million on this facility, all on afloating rate basis. The remaining £150million is expected to be drawn downduring the first half of <strong>2015</strong>/16. InMarch <strong>2015</strong>, UUW signed a new £250million index-linked term loan facilitywith the EIB. This is an amortisingfacility with an average loan life of 10years and a final maturity of 18 yearsfrom draw down and we expect to drawthe new loan in tranches over the nextyear or so. In the same month, UUWarranged a new £100 million, 10-yearindex-linked loan with an existingrelationship bank, at a real interestrate of around 0.5 per cent. The groupalso agreed £150 million of committedbank facilities during 2014/15.Term-debt maturity per regulatory period3,0002,000£m1,0000<strong>2015</strong>–202020–252025–302030–352035–402040–452045–502050–552055–6042
UNITED UTILITIES GROUP PLC ANNUAL REPORT AND FINANCIAL STATEMENTS <strong>2015</strong>Stock Code: UU.<strong>united</strong><strong>utilities</strong>.comFollowing the year-end, UUWF issuedtwo index-linked notes totalling £60million, split by a £25 million, 10-yearmaturity and a £35 million, 15-yearmaturity. UUWF also issued a €52million note (swapped to floatingsterling) with a 12-year maturity. Allthese notes were issued via privateplacement off our EMTN programme.The group now has headroom to coverits projected financing needs into2017.Long-term borrowings are structured orhedged to match assets and earnings,which are largely in sterling, indexedto UK retail price inflation and subjectto regulatory price reviews every fiveyears.Long-term sterling inflation indexlinkeddebt provides a natural hedgeto assets and earnings. At 31 March<strong>2015</strong>, approximately 52 per cent ofthe group’s net debt was in index-linkedform, representing around 31 per centof UUW’s regulatory capital value, withan average real interest rate of 1.6per cent. The long-term nature of thisfunding also provides a good match tothe company’s long-life infrastructureassets and is a key contributor to thegroup’s average term-debt maturityprofile, which is over 20 years.Where nominal debt is raised in acurrency other than sterling and/or witha fixed interest rate, to manage exposureto long-term interest rates, the debt isgenerally swapped to create a floatingrate sterling liability for the term of thedebt. To manage exposure to mediumterminterest rates, the group fixesunderlying interest costs on nominaldebt out to 10 years on a reducingbalance basis. This is supplemented byfixing substantially all remaining floatingrate exposure across the forthcomingregulatory period around the time of theprice control determination.In line with this, the group has nowfixed interest costs for substantially allof its floating rate exposure over the<strong>2015</strong>–20 period, locking in an average<strong>annual</strong> interest rate of around 3.75 percent (inclusive of credit spreads). For<strong>2015</strong>/16, the rate is slightly higher,as we transition between the tworegulatory periods.LiquidityShort-term liquidity requirements aremet from the group’s normal operatingcash flow and its short-term bankdeposits and supported by committedbut undrawn credit facilities. Thegroup’s €7 billion euro medium-termnote programme provides furthersupport.In line with the board’s treasury policy,United Utilities aims to maintain a robustliquidity position. Available headroom at31 March <strong>2015</strong> was £616 million basedon cash, short-term deposits, mediumtermcommitted bank facilities, alongwith the undrawn portion of the EIB termloan facilities, net of short-term debt.United Utilities believes that it operatesa prudent approach to managingbanking counterparty risk. Counterpartyrisk, in relation to both cash depositsand derivatives, is controlled throughthe use of counterparty credit limits.United Utilities’ cash is held in the formof short-term money market depositswith prime commercial banks.United Utilities operates a bilateral,rather than a syndicated, approach toits core relationship banking facilities.This approach spreads maturitiesmore evenly over a longer time period,thereby reducing refinancing riskand providing the benefit of severalrenewal points rather than a large singlerefinancing requirement.PensionsAs at 31 March <strong>2015</strong>, the group hadan IAS 19 net pension surplus of £79million, compared with a net pensiondeficit of £177 million at 31 March2014. This £256 million favourablemovement mainly reflects a decreasein inflation expectations alongside anincrease in corporate credit spreads. Incontrast, the scheme specific fundingbasis does not suffer from volatilitydue to inflation and credit spreadmovements as it uses a fixed inflationassumption via the inflation fundingmechanism and a prudent, fixed creditspread assumption. Therefore, therecent inflation and credit spreadmovements have not had a materialimpact on the deficit calculated on ascheme specific funding basis or thelevel of deficit repair contributions.The triennial actuarial valuations ofthe group’s defined benefit pensionschemes were carried out as at31 March 2013 and the overallfunding position has improved sinceMarch 2010. Following the de-riskingmeasures we have implemented overrecent years, our pension fundingposition remains well placed and in linewith our expectations. There has beenno material change to the scheduledcash contributions as assessed at theprevious valuations in 2010.Further detail is provided in note 18(‘Retirement benefit obligations’)of these consolidated financialstatements.SHAREHOLDER INFORMATION FINANCIAL STATEMENTS GOVERNANCE STRATEGIC REPORT43
UNITED UTILITIES GROUP PLC ANNUAL REPORT AND FINANCIAL STATEMENTS <strong>2015</strong>Stock Code: UU.<strong>united</strong><strong>utilities</strong>.comOur performance 2014/15Underlying profitIn considering the underlying results for the period, the directors have adjusted for the items outlined in the table belowto provide a more representative view of business performance. Reported operating profit and profit before tax fromcontinuing operations are reconciled to underlying operating profit, underlying profit before tax and underlying profit aftertax (non-GAAP measures) as follows:Continuing operationsOperating profitYear ended31 March <strong>2015</strong>£mRestated (1)Year ended31 March 2014£mOperating profit per published results 653.3 630.2One-off items (2) 11.0 4.4Underlying operating profit 664.3 634.6Net finance expense £m £mFinance expense (317.8) (98.7)Investment income 1.0 6.8Net finance expense per published results (316.8) (91.9)Adjustments:Net fair value losses/(gains) on debt and derivative instruments 104.7 (129.2)Interest on swaps and debt under fair value option 4.0 8.1Net pension interest expense/(income) 7.0 (1.3)Capitalised borrowing costs (20.9) (19.4)Release of tax interest accrual – (13.3)Interest receivable on tax settlement – (4.5)Underlying net finance expense (222.0) (251.5)Profit before tax £m £mShare of profits of joint ventures 5.1 5.0Profit before tax per published results 341.6 543.3Adjustments:One-off items (2) 11.0 4.4Net fair value losses/(gains) on debt and derivative instruments 104.7 (129.2)Interest on swaps and debt under fair value option 4.0 8.1Net pension interest expense/(income) 7.0 (1.3)Capitalised borrowing costs (20.9) (19.4)Release of tax interest accrual – (13.3)Interest receivable on tax settlement – (4.5)Underlying profit before tax 447.4 388.1Profit after tax £m £mUnderlying profit before tax 447.4 388.1Reported tax (charge)/credit (70.4) 195.3Deferred tax credit – change in tax rate – (156.8)Agreement of prior years’ UK tax matters (0.7) (154.3)Tax in respect of adjustments to underlying profit before tax (22.2) 32.6Underlying profit after tax 354.1 304.9Earnings per share £m £mProfit after tax per published results (a) 271.2 738.6Underlying profit after tax (b) 354.1 304.9Weighted average number of shares in issue, in millions (c) 681.9m 681.9mEarnings per share per published results, in pence (a/c) 39.8p 108.3pUnderlying earnings per share, in pence (b/c) 51.9p 44.7p(1) The comparatives have been restated to reflect the requirements of IFRS 11 ‘Joint Arrangements’. See accounting policies page 124 for details.(2) Relates to restructuring costs within the business.44
UNITED UTILITIES GROUP PLC ANNUAL REPORT AND FINANCIAL STATEMENTS <strong>2015</strong>Stock Code: UU.<strong>united</strong><strong>utilities</strong>.comUnderlying operating profit reconciliationThe table below provides a reconciliation between group underlying operating profit and United Utilities Water Limited(UUW) historical cost regulatory underlying operating profit (non-GAAP measures) as follows:Continuing operationsUnderlying operating profitYear ended31 March <strong>2015</strong>£mRestated (1)Year ended31 March 2014£mGroup underlying operating profit 664.3 634.6Underlying operating profit not relating to UUW 2.5 (0.4)UUW statutory underlying operating profit 666.8 634.2Revenue recognition 9.8 (0.2)Infrastructure renewals accounting 30.6 52.9Other differences (including non-appointed business) (5.9) (5.3)UUW regulatory underlying operating profit 701.3 681.6(1) The prior year has been restated to reflect the requirements of IFRS11 and to reflect that UUW now <strong>report</strong>s in accordance with IFRS accounting standards,rather than UK GAAP previously.SHAREHOLDER INFORMATION FINANCIAL STATEMENTS GOVERNANCE STRATEGIC REPORT45
UNITED UTILITIES GROUP PLC ANNUAL REPORT AND FINANCIAL STATEMENTS <strong>2015</strong>Stock Code: UU.<strong>united</strong><strong>utilities</strong>.comOur plans for <strong>2015</strong>–20The final determinationdelivers value for all ofour stakeholdersThe final determination for our <strong>2015</strong>–20 price controls was published by Ofwaton 12 December 2014 and, after careful consideration, we accepted theseproposals on 27 January <strong>2015</strong>.The final determination delivers valuefor all of our stakeholders, with astrong focus on customer benefits,including reduced bills in <strong>2015</strong>/16,alongside continued high levelsof investment which will providefurther environmental benefits and asignificant contribution to the regionaleconomy. Household customers arealso set to benefit from below inflationgrowth in average bills for the decadethrough to 2020.We aim to maintain efficient accessto debt capital markets throughoutthe economic cycle and believe thatit is appropriate to keep gearing,measured as net debt to regulatorycapital value, within our existingtarget range of 55 per cent to 65 percent. This is supported by our aim tomaintain, as minimum, our existingUUW credit ratings of A3 with Moody’sand BBB+ with Standard & Poor’s. Weare targeting growth in the dividendper share, from 2014/15 base, of atleast RPI inflation each year through to2019/20. This target reflects detailedanalysis and assessment of the finaldetermination, including the lowerallowed regulatory return for <strong>2015</strong>-20.The key features of the delivery plansfor each of the four price controls areset out below.Wholesale waterThe North West benefits from one ofthe youngest water networks in thecountry, with over 50 per cent of ournetwork constructed or renewed in thelast 30 years. This is a consequence ofsignificant investment over previousregulatory cycles to improve water46
UNITED UTILITIES GROUP PLC ANNUAL REPORT AND FINANCIAL STATEMENTS <strong>2015</strong>Stock Code: UU.<strong>united</strong><strong>utilities</strong>.comquality. We benefit from historicinvestment in the integration of ournetworks to create a core ‘integratedsupply zone.’ The most recent additionto this was the West–East pipelinerunning approximately 50 kilometresbetween Liverpool and Manchester. Asa consequence, we are able to provideone of the most efficient and flexiblewater services in the sector.Customers told us they want to retaintheir current level of water services,but do not want to pay for waterservice improvements. This has drivenour proposals for the next five years,where our core focus is to continueongoing maintenance of the existingservice to keep it working reliablynow and in the future, managing costscarefully and reducing the number ofcustomer contacts.Key features of our plan mean that weaim to:• maintain existing high levels ofreliability in the delivery of dayto-daywater services, makingbetter use of technology to monitorremotely and control more of oursource-to-tap assets;• maintain existing high levels ofwater quality as measured atcustomers’ taps and our watertreatment works;• reduce the number of contacts fromcustomers regarding water quality;• maintain leakage at or below thesustainable economic level;• limit the impact on customers ofincreases in operating costs, suchas chemicals and rates, by makingcost savings elsewhere throughthe continuous improvement in theefficiency of our operations; and• commence work to link 150,000customers in West Cumbria toThirlmere reservoir to ensure along-term, reliable supply of drinkingwater and to support the sensitiveecology in that area (see businessinsight opposite).Business InsightSecuring a sustainablewater supply for CumbriaOur 25-year Water Resources Management Plan forecast that the vastmajority of our region (covering 97 per cent of our customer base andincluding our large integrated supply zone) will be in water surplus, despiteexpected increases in population and the impact of climate change.The only exception was WestCumbria, where we predicted asupply/demand deficit. This wasdriven by the Environment Agency’sdetermination that, in future, wewill have to extract less water fromEnnerdale lake in West Cumbria, inorder to protect England’s largestpopulation of freshwater mussels inthe River Ehen.With the support of the EA and otherstakeholders, our plan is to usesurplus water from our integratedresource zone to supply WestCumbria to ensure its populationhas a long-term sustainable, secureWorkingtonWhitehavenAspatriaEnnerdale WTWEnnerdaleWaterCornhowWTWCrummockWaterRiver Duddonsupply of water. We will build over90km of pipeline from Thirlmerereservoir to supply West Cumbria asshown in the diagram below. A newwater treatment works is plannedto be built in Keswick to replace fiveexisting water treatment works andavoid significant future maintenanceat these sites. We received fundingof around £200 million for thisproject over <strong>2015</strong>–20, making it ourlargest capital scheme.Quarry Hill WTWBassenthwaiteKeswickButtermere WTWThirlmereUllswaterBridge End WTWWindermerePenrithKendalHaweswaterCUMBRIARiver EdenSHAREHOLDER INFORMATION FINANCIAL STATEMENTS GOVERNANCE STRATEGIC REPORTTreatment sites to be closedNew Thirlmere supply pipelineLocation of new WTWBarrowRiver Lune47
UNITED UTILITIES GROUP PLC ANNUAL REPORT AND FINANCIAL STATEMENTS <strong>2015</strong>Stock Code: UU.<strong>united</strong><strong>utilities</strong>.comOur plans for <strong>2015</strong>–20We are expanding ouroptions for assistanceto hard-pressedcustomersWe are increasingour production ofrenewable energyfrom waste to protectcustomers from risingenergy costs andreduce our carbonfootprintWholesale wastewaterThe region’s geography and weather,the legacy of the Industrial Revolution,population growth and long-termunder investment in the region’swastewater infrastructure mean thatnew European environmental legislationhas a significant impact on our plansfor the next five years and beyond.Furthermore, the North West has one ofthe country’s largest combined wasteand surface water infrastructures andthis has significant implications forriver and bathing water quality in theheavy rainfall events anticipated underclimate change. These are significantnew challenges for our wastewaterservice and will drive high levelsof capital expenditure in meetingstatutory obligations.Against this backdrop, customers toldus that for the most part they wantedtheir wastewater services to remainstable. Whilst they want to see progressin reducing sewer flooding and inimproving the environment, they areconcerned about the impact that serviceimprovements will have on their bills.We have responded to this by devisinga balanced programme of work over the<strong>2015</strong>–20 period and beyond that willprogressively deliver our contribution tothe UK Government’s compliance withEuropean legislation. This also takesaccount of customers’ views on theacceptable level of future bill increases.In the next five-year period weaim to:• build on the customer satisfactionimprovements we have alreadydelivered. We will continue toimprove the way we operate ourwastewater business, making betteruse of technology, automation andcontrol to drive better customerservice at reduced cost;• reduce the number of ourcustomers’ properties exposedto sewer flooding by over 40 percent, seeking opportunities towork in partnership with others todeliver schemes cost-effectivelyand promote the use of moresustainable drainage systems;• improve the region’s bathing waters,in light of tougher regulatorystandards;• work with other organisationsto support them in deliveringimprovements to our region’sbeaches;• improve the water quality in theNorth West’s rivers and lakesthrough investment in our treatmentworks and at overflows, reducingpollution. We are engaging withstakeholders to explore innovativecatchment management techniquesto control diffuse pollution in ourcatchments;• increase our production ofrenewable energy from waste tohelp protect customers from risingenergy costs and reduce our carbonfootprint; and• constrain costs associated withtaking responsibility for all privatesewers and private pumpingstations across the region, throughimprovements to our operatingmodel and efficient delivery of ourprogramme.48
UNITED UTILITIES GROUP PLC ANNUAL REPORT AND FINANCIAL STATEMENTS <strong>2015</strong>Stock Code: UU.<strong>united</strong><strong>utilities</strong>.comHousehold retailOur focus for the current regulatoryperiod has been. and continues to be.to improve the customer experience.This involves being more proactivewith customers, anticipating problemsbefore they materialise and improvingour communication channels so thatwe are easier to do business with.We aim to reduce further the numberof complaints and to resolve themwhenever we can, avoiding the needfor complaints to be referred to theConsumer Council for Water.We aim to reduce the debt burden onthe company and its customers byengaging with those who are strugglingto pay, helping them to return tosustained payment behaviour. We areextending our options for assistance tohard-pressed customers by developinga social tariff that secures a high levelof acceptability from customers. Weremain committed to contributing<strong>annual</strong>ly to the United Utilities TrustFund, which has proven effective inhelping customers in difficulty returnto regular payment.Our domestic retail plan also sees uscontinuing our efforts to reduce thecosts to serve our customers throughsystems and process improvement.This is particularly important under thenew price control methodology whichuses an industry average retail cost toserve to determine part of customerbills.Non-household retailWe welcome the opportunity offeredthrough the opening of the Englishnon-household retail market tocompetition. Over the last three yearswe have recruited a management teamwith other sector experience to leadour business retail area, and separatedthis team from our domestic retail andwholesale business areas. This teamhas embarked on a transformationprogramme focused on getting thebasics right against core customerneeds, creating the culture of abusiness-to-business retailer.Our early progress has beenencouraging and our success ingrowing our United Utilities Scotlandbusiness has allowed us to learnabout the propositions, processesand systems required to win, serveand retain non-household customers.Research has highlighted a need for abroader range of services targeted todifferent segments. We are developingthese in our non-appointed business,ensuring that they are only paid for bycustomers who want these services.Non-household customers tell us thatthe three most important things theylook to their water supplier to deliverare: value for money; a reliable supply;and great customer service. With thisin mind, through the course of the<strong>2015</strong>–20 period we aim to:• install meters in all businesscustomer premises that giveautomated meter reads (AMR)to facilitate billing for actualconsumption;• build stronger relationships withcustomers to develop tailored plansto meet their needs;• give customers greater choice inhow they contact and transact withus; and• increase first point resolution andcase ownership, reducing cost toserve and improving customersatisfaction.SHAREHOLDER INFORMATION FINANCIAL STATEMENTS GOVERNANCE STRATEGIC REPORT49
UNITED UTILITIES GROUP PLC ANNUAL REPORT AND FINANCIAL STATEMENTS <strong>2015</strong>Stock Code: UU.<strong>united</strong><strong>utilities</strong>.comOur key performance indicators (KPIs)<strong>2015</strong>–20Pictured: Construction of a storm tank as partof a £5 million sewer improvement schemein St Helens. Underground tanks such as thishelp to store huge amounts of water duringheavy rainfall, preventing flooding.As we enter the next fiveyears, we have refined ourKPIs to reflect the changingregulatory environmentWe will first <strong>report</strong> against these refined KPIs for the year ending 31 March 2016.Our financial KPIs will remain thesame except that we will no longerbe including capital investmentspecifically due to Ofwat’s move awayfrom opex and capex and into the newtotex-based price control for <strong>2015</strong>–20.The definitions are as outlined in our2010–15 KPIs on pages 32 and 33.Financial KPIs <strong>2015</strong>–20• Revenue• Underlying operating profit• Underlying earnings per share• Dividend per share• Gearing: net debt to regulatorycapital valueOur operational KPIs have evolvedto reflect the move to a totex pricecontrol, with a totex outperformancemeasure replacing the previousseparate opex outperformance andcapex outperformance measures.We are including an outcome deliveryincentive (ODI) KPI in our wholesalebusiness to monitor our performanceagainst these important newoperational measures. This replacesthe previous serviceability KPIwhich is incorporated within the ODImeasures. With the retail householdprice control now being separated, weare introducing a new KPI to measureour costs in this area. In the businessretail price control, with the expansionof competition, we are including a newKPI measuring the impact of customergains and losses.50
UNITED UTILITIES GROUP PLC ANNUAL REPORT AND FINANCIAL STATEMENTS <strong>2015</strong>Stock Code: UU.<strong>united</strong><strong>utilities</strong>.comOperational KPIs <strong>2015</strong>–20Company objective/KPIDefinitionBest service to customersWholesale outcome delivery incentive Net reward/(penalty) accrued across United Utilities’ 18 wholesale financial ODIs(ODI) compositeService incentive mechanism –qualitativeService incentive mechanism –quantitativeBusiness retail customer growthLowest sustainable costTotex outperformanceFinancing outperformanceDomestic retail cost to serveResponsible mannerLeakage – average <strong>annual</strong> leakageEnvironment Agency performanceassessmentDow Jones Sustainability Index ratingOfwat derived index based on quarterly customer satisfaction surveys, measuringthe absolute and relative performance of the 18 water companies. Each companyreceives a score in the range of zero to five, with five being the highest attainablescoreOfwat derived composite index based on the number of customer contacts,assessed by type, measuring the absolute and relative performance of the 18water companies. Each company receives a SIM point total, where the lowest scorerepresents the best performanceAmount of additional revenue from winning customers from other water retailproviders less the amount of revenue lost from losing customers to other waterretail providersProgress to date on cumulative totex outperformance across the wholesale waterand wastewater price controls versus Ofwat’s allowed totex over the <strong>2015</strong>–20periodProgress to date on financing expenditure outperformance secured versus Ofwat’sallowed cost of debt of 2.59 per cent real over the <strong>2015</strong>–20 periodAverage cost to serve in our domestic retail businessAverage <strong>annual</strong> water leakage from our network quantified in megalitres per dayComposite assessment produced by the Environment Agency, measuring theabsolute and relative performance of the 10 water and wastewater companiesacross a broad range of areas, including pollutionIndependent rating awarded using sustainability metrics covering economic,environmental, social and governance performanceSHAREHOLDER INFORMATION FINANCIAL STATEMENTS GOVERNANCE STRATEGIC REPORT51
UNITED UTILITIES GROUP PLC ANNUAL REPORT AND FINANCIAL STATEMENTS <strong>2015</strong>Stock Code: UU.<strong>united</strong><strong>utilities</strong>.comPrincipal risks and uncertaintiesOur risk management framework aimsfor continuous improvementWe have developed a sophisticated approach to the assessment, management and <strong>report</strong>ing of risks, with a process alignedto ISO 31000: 2009 and a well-established governance structure for the group board to review the nature and extent ofthe risks that the group faces and for the audit committee to review process effectiveness. This process is supported by acentral database, tools, templates and guidance to drive consistency.Our risk profile currently illustratesaround 200 event-based risks. All eventtypes (strategic, financial, operational,compliance and hazard) are consideredin the context of our strategic themes(best service to customers; lowestsustainable cost; and responsiblemanner). For internal or external drivers,each event is assessed for the likelihoodof occurrence and the negative financialor reputational impact on the companyand its objectives, should the eventoccur.Responsibility for the assessmentand management of the risk (includingmonitoring and updating) is assignedto the appropriate individual managerwho is also responsible for <strong>report</strong>ingon assessment, management andcontrol/mitigation at least twice a year,in line with the <strong>report</strong>ing to the groupboard at full and half-year statutoryaccounting <strong>report</strong>ing periods.By their nature, event-based risks inthe context of our strategic themeswill include all combinations of high tolow likelihood and high to low impact.Heat maps are typically used in variousmanagerial and group <strong>report</strong>s eitheras a method to collectively evaluatethe extent of all risks within a certainprofile or to illustrate the effectivenessof mitigation for a single risk by plottingthe gross, current (net of existingcontrols) and the selected targetposition in an individual risk statement.ImpactLikelihoodHowever, <strong>report</strong>ing a small number ofevent-based risks ranked by combinedevent likelihood and potential impactcould distort principal risk disclosureas it would overlook other risks witha lesser individual exposure that,if they materialised individually orin aggregate, could have a materialimpact on the business model, futureperformance, solvency or liquidityof the group. Equally, event-basedrisks identified as part of ourinternal assessment process can becommercially sensitive, the disclosureof which could be detrimental tocompetitive advantage or our ability tomitigate risk over the longer term.In order to address this, furtherunderstand the nature and extentof our entire profile and support thedisclosure of principal risks, eventbasedrisks are categorised (basedon the event), when recorded ontothe central database, into areas thatdefine business activity or contributingfactors where value can be lost. Thesecategories have been set out in thetable on pages 54 and 55 to reflect theprincipal risks (aggregated), togetherwith associated issues or areas ofuncertainty, potential for materialeffect, the extent of control/mitigationand the link to our main businessobjectives. We have also includedin the three columns ‘Likelihood ofoccurrence’, ‘Potential aggregatednet impact’ and ‘Trend’ more detailedanalysis as explained in the key at thetop of page 55.Key features, developments overthe last year and looking aheadAs expected, following the 2014price determination the group’s riskprofile is returning to one basedmore on operational performance,compliance and delivery risk. We havechallenging demands on customerbenefits, operational performance andinvestment requirements in light ofpopulation growth, climate change andstrict legal/regulatory requirements.Competition and market reformremain high on the agenda however,with the ongoing development of thenon-household market and uncertaintysurrounding the impact of upstreamcompetition for water and wastewaterservices.52
UNITED UTILITIES GROUP PLC ANNUAL REPORT AND FINANCIAL STATEMENTS <strong>2015</strong>Stock Code: UU.<strong>united</strong><strong>utilities</strong>.comThere continue to be two ongoingpieces of material litigation worthy ofnote but, based on the facts currentlyknown to us and the provisions in ourstatement of financial position, ourdirectors remain of the opinion that thelikelihood of these having a materialadverse impact on the group’s financialposition is remote.• In February 2009, United UtilitiesInternational Limited (UUIL) wasserved with notice of a multiparty‘class action’ in Argentina relatedto the issuance and paymentdefault of a US$230 million bondby Inversora Eléctrica de BuenosAires S.A. (IEBA), an Argentineproject company set up to purchaseone of the Argentine electricitydistribution networks which wasprivatised in 1997. UUIL had a45 per cent shareholding in IEBAwhich it sold in 2005. The claimis for a non-quantified amountof unspecified damages andpurports to be pursued on behalf ofunidentified consumer bondholdersin IEBA. UUIL has filed a defenceto the action and will vigorouslyresist the proceedings given therobust defences that UUIL has beenadvised that it has on proceduraland substantive grounds.• In March 2010, Manchester ShipCanal Company (MSCC) issuedproceedings seeking, amongst otherrelief, damages alleging trespassagainst United Utilities WaterLimited (UUW) in respect of UUW’sdischarges of water and treatedeffluent into the canal. Whilst thematter has not reached a finalconclusion, the Supreme Court hasfound substantively in UUW’s favouron a significant element of the claimand referred the remainder of theproceedings back to the High Court.United Utilities risk management process (adapted from ISO 31000: 2009)MONITOR &REVIEWIDENTIFY &ASSESSCONSULT &COMMUNICATERECORD &UPDATECONTROL &MITIGATECorporate risk framework – governance and <strong>report</strong>ing structureGROUP BOARDReview of the nature andextent of riskGROUP AUDIT &RISK BOARDReview of governance,risk and complianceCORPORATE RISKTEAMFramework development,assurance, advice and<strong>report</strong>ingBUSINESS AREA& PROJECTSAssessment andmitigation of riskAUDIT COMMITTEEReview of theeffectiveness of riskmanagement and internalcontrol systemsCORPORATE AUDITReview of riskmanagement and internalcontrol systemsSHAREHOLDER INFORMATION FINANCIAL STATEMENTS GOVERNANCE STRATEGIC REPORT53
UNITED UTILITIES GROUP PLC ANNUAL REPORT AND FINANCIAL STATEMENTS <strong>2015</strong>Stock Code: UU.<strong>united</strong><strong>utilities</strong>.comPrincipal risks and uncertaintiesRisk categoryRegulatoryenvironment andframeworkCorporategovernance andlegal complianceWater serviceWastewaterserviceSecurity, assetsand operationalresilienceMain businessobjectiveLowestSustainableCostResponsibleMannerBest Serviceto CustomersBest Serviceto CustomersBest Serviceto CustomersCurrent key risks, issues or areas ofuncertainty include:• Market reform including non-householdand upstream competition• A possible change from using the retailprices index to the consumer prices indexfor regulatory indexation• Competition law and regulatorycompliance whilst preparing for andoperating within a changing competitivemarket• Material litigation (see page 53)• New higher fine levels for environmentaloffences• Dealing with the impacts of populationgrowth, climate change and weatherconditions• Meeting infrastructure investmentrequirements and balancing supply anddemand• Expected change to the abstractionlicensing regime• The threat of cybercrime and/or terrorismaffecting our assets or operationsPotential impactsChanges to regulation and the regulatory regime (either through political orregulatory events) may increase costs of administration, reduce income andmargin and lead to greater variability of returns.Non-compliance with existing or future UK or international laws or regulations(especially given the highly regulated environment we operate in) could resultin additional workload and operating costs in justifying or defending ourposition and financial penalties (including of up to 10 per cent of relevantregulated turnover for extreme events) and compensation following litigationis also possible, together with additional capital/operating expenditure as aresult of the imposition of enforcement orders. In more remote but extremecircumstances, impacts could ultimately include licence revocation or theappointment of a special administrator.Operational performance problems or service failures can lead to increasedregulatory scrutiny, regulatory penalties and/or additional operating or capitalexpenditure. In more extreme situations the group could also be fined forbreaches of statutory obligations, be held liable to third parties and sustainreputational damage.Our resources, assets and infrastructure are exposed to various threats(malicious or accidental) and natural hazards which could impact theprovision of vital services to the public and commercial business.Human and ITresourceTax, treasuryand financialcontrolProgrammedeliveryResponsibleMannerLowestSustainableCostLowestSustainableCost• Delivering required employeeengagement, talent management,technological innovation and IT assetmanagement• Stability of financial institutions and theworld economy• The speed of economic recovery• Inflation/deflation• Financial market conditions, interestrates and funding costs• Supply chain security of supply anddelivery of solutions, quality andinnovation• New contract delivery partnershipsfor the <strong>2015</strong>–2020 period with a newapproach to construction and designCapacity, capability and effectiveness problems associated with human andIT resource will impact the efficiency and effectiveness of business activity,the ability to make appropriate decisions and ultimately meet targets. This canalso affect the ability to recruit and retain knowledge/expertise or to recovereffectively following an incident. In remote but extreme circumstances thereis also the potential for higher levels of regulatory scrutiny, financial penalties,reputational damage and missed commercial opportunities.The failure of financial counterparties could result in additional financingcost, an adverse impact on the income statement and potential reputationaldamage. Variability in inflation (as measured by the UK Retail Prices Index) andchanges in interest rates, funding costs and other market risks could adverselyimpact the economic return on the regulatory capital value (RCV) and affectour pension schemes with a requirement for the group to make additionalcontributions. In extreme but remote cases adverse market conditions couldaffect our access to debt capital markets and subsequently available liquidityand credit ratings.Failure to deliver capital or change programmes against relevant time, costor quality measures could result in a failure to secure competitive advantageor operating performance efficiency and cost benefits. There is also the riskof increased delivery costs or a failure to meet our obligations and customeroutcomes which, depending on the nature and extent of failure, could resultin an impact at future price reviews, regulatory or statutory penalties andnegative reputational impact with customers and regulators.RevenuesHealth,safety andenvironmentalLowestSustainableCostResponsibleManner• Socio-economic deprivation in the NorthWest• Welfare reform and the impact ondomestic bad debt• Competition in the water and wastewatermarket and competitor positioning• The standards of service to ourcustomers• Risks associated with excavation,tunnelling and construction work andworking with water and wastewater• Weather conditionsPoor service to customers can result in financial penalties issued by theregulator through components of the service incentive mechanism fordomestic customers and loss of revenue associated with commercial churnfor commercial customers using five megalitres and above per annum. Theproposed opening of the market for retail services to all non-householdcustomers in England from 2017 generates both opportunities and riskassociated with market share, scale and margin erosion. There is alsomuch uncertainty surrounding the form of upstream reform which is nowanticipated to materialise post-2019.Working with and around water, sewage, construction and excavation sites,plant and equipment exposes employees, contractors and visitors to variousman-made and naturally occurring hazards which could cause harm to peopleand the environment. Depending on the circumstances the group could befined for breaches of statutory obligations, be held liable to third parties andsustain reputational damage.54
UNITED UTILITIES GROUP PLC ANNUAL REPORT AND FINANCIAL STATEMENTS <strong>2015</strong>Stock Code: UU.<strong>united</strong><strong>utilities</strong>.comEach risk category is made up of lotsof individual risks. The value of eachindividual risk is used to determine therelevant proportions in these illustrations.Likelihood of occurrence columnThe proportion of the risks in the category that are classifiedfor likelihood as:Red = Very likelyAmber = LikelyYellow = UnlikelyGreen = RemotePotential aggregated net impact columnAn assessment of impact should every risk in the categoryoccur but ignoring likelihood, timing and duration of thisoccurringTrend columnAn indication of that category’s current exposure relative tothe previous year (down = reducing, up = increasing,across = stable).Likelihood ofoccurrenceUnlikelyUnlikelyRemoteUnlikelyRemoteUnlikelyUnlikelyUnlikelyUnlikelyPotentialaggregatednet impact Trend Control mitigationWe engage in relevant government and regulatory consultations which may affect policy andregulation in the sectors where we operate. We also consult with customers to understand theirMediumrequirements and proactively consider all the opportunities and threats associated with anypotential change, exploiting opportunities and mitigating risks where appropriate.LowHighLowMediumLowHighMediumMediumLegislative and regulatory developments are continually monitored. Risk-based training ofemployees is undertaken and we participate in consultations to influence legislative and regulatorydevelopments. Funding for any additional compliance costs in the regulated business is soughtas part of the price determination process. The group also robustly defends litigation whereappropriate and seeks to minimise its exposure by establishing provisions and seeking recoverywherever possible.Mitigation is provided through core business processes, including forecasting, quality assuranceprocedures, risk assessments and rigorous sampling/testing regimes. Ongoing integration ofwater and wastewater networks improves service provision and measures of success have beendeveloped to monitor performance. We also undertake customer education programmes, seekingto minimise related operational issues.Physical and technological security measures combined with strong governance and inspectionregimes aim to protect infrastructure, assets and operational capability. Ongoing integration of waterand wastewater networks improves operational resilience and we maintain robust incident response,business continuity and disaster recovery procedures. We also maintain insurance cover for loss andliability and the licence of the regulated business also contains a ‘shipwreck’ clause that, if applicable,may offer a degree of recourse to Ofwat/customers in the event of a catastrophic incident.Developing our people with the right skills and knowledge, combined with delivering effectivetechnology are important enablers to support the business to meet its objectives. Employees arekept informed regarding business strategy and progress through various communication channels.Training and personal development programmes exist for all employees in addition to talentmanagement programmes and apprentice and graduate schemes. We focus on change programmesand innovative ways of working to deliver better, faster and more cost-effective operations.Refinancing is long-term with staggered maturity dates to minimise the effect of short-termdownturns. Counterparty credit, exposure and settlement limits exist to reduce any potentialfuture impacts. These are based on a number of factors, including the credit rating and the sizeof the asset base of the individual counterparty. The group also employs hedging strategies tostabilise market fluctuation for inflation, interest rates and commodities (notably energy prices).Sensitivity analysis is carried out as part of the business planning process, influencing the variousfinancial limits employed. Continuous monitoring of the markets takes place including movementsin credit default swap prices and movements in equity levels.We have a developed and clear view of our investment priorities which are built into our programmes,projects and integrated business and asset plans. We have created better alignment and integrationbetween our capital delivery partners and engineering service provider including alignment with ouroperating model. Our programme and project management capabilities are well established withstrong governance and embedded processes to support delivery, manage risks and achieve businessbenefits. We utilise a time, cost and quality index (TCQi) as a key performance indicator and enhanceour performance through a dedicated programme change office to deliver change in a structured andconsistent way. Supply chain management is utilised to deliver end-to-end contract managementwhich includes contract strategy and tendering, category management, security of supply, price andprice volatility and financial and operational service level performance.For domestic retail there is a transformation plan in place covering a wide range of initiatives andactivities to improve customer service, with a number of controls in place to monitor achievementagainst the plan. Similarly, we look to retain existing and acquire new commercial customersby striving to meet their needs more effectively. We monitor competitor activity and target areduction in operating costs.SHAREHOLDER INFORMATION FINANCIAL STATEMENTS GOVERNANCE STRATEGIC REPORTRemoteLowWe have developed a strong health, safety and environmental culture supported by stronggovernance and management systems which include policies and procedures which are certified toOHSAS 18001 and ISO 14001.55
SmartAdvanced technology throughout ournetworks is helping us to find and fixproblems before they happen.
GOVERNANCEThe corporate governance <strong>report</strong> presents informationon the board of United Utilities and its activities andthose of the various committees, and sets out how theboard demonstrates leadership, effectiveness and itsaccountability to the company’s stakeholders and itsapproach to the remuneration of the directors.Corporate governance <strong>report</strong>Board of directors 58Letter from the Chairman 60Nomination committee <strong>report</strong> 68Audit committee <strong>report</strong> 76Corporate responsibility <strong>report</strong> 82Remuneration committee <strong>report</strong> 84Directors’ <strong>report</strong> 104Statement of directors’ responsibilities 111
UNITED UTILITIES GROUP PLC ANNUAL REPORT AND FINANCIAL STATEMENTS <strong>2015</strong>Stock Code: UU.<strong>united</strong><strong>utilities</strong>.comCorporate governance <strong>report</strong>Board of directorsDr John McAdam (67)ChairmanSteve Mogford (58)Chief Executive Officer (CEO)Responsibilities: Responsible for the leadership of the board, settingits agenda and ensuring its effectiveness on all aspects of its role.Qualifications: BSc (Hons) Chemical Physics, Diploma AdvancedStudies in Science, PhD.Appointment to the board: Appointed as a non-executive director inFebruary 2008 and as Chairman in July 2008.Committee membership: Nomination (chair).Skills and experience: With over 16 years’ service as a board directorin a wide range of companies, and as a current non-executive directorserving on a number of other boards, John has a wealth of experienceon which to draw in his role as Chairman and leader of the board.Career experience: Appointed to the board of ICI plc in 1999 andbecame chief executive in 2003, a position held until ICI’s takeover byAkzo Nobel.Current directorships/business interests: Chairman of Rentokil Initialplc, senior independent director of J Sainsbury plc and a non-executivedirector of Rolls-Royce Holdings plc. He is also Chairman of UnitedUtilities Water Limited.Independence: John met the Code’s independence criteria at the timeof his initial appointment as Chairman.Responsibilities: To manage the group’s business and to implement thestrategy and policies approved by the board.Qualifications: BSc (Hons) Astrophysics/Maths/Physics.Appointment to the board: January 2011.Committee membership: Corporate responsibility.Skills and experience: Steve’s experience of the highly competitivedefence market and complex design, manufacturing and supportprogrammes has brought renewed focus to customer service andoperational performance at United Utilities, and his perspective of theconstruction and infrastructure sector provides valuable experiencerelating to United Utilities’ capital investment programme.Career experience: Previously chief executive of SELEX Galileo, thedefence electronics company owned by Italian aerospace and defenceorganisation Finmeccanica and chief operating officer at BAE SystemsPLC, and a member of its PLC board, he spent his earlier career withBritish Aerospace PLC.Current directorships/business interests: Senior independent directorof Carillion PLC, vice-president of Liverpool School of TropicalMedicine. He is also chief executive officer of United Utilities WaterLimited.Russ Houlden (56)Chief Financial Officer (CFO)Dr Catherine Bell (64)Independentnon-executive directorResponsibilities: To manage the group’s financial affairs and tocontribute to the management of the group’s business.Qualifications: BSc (Hons) Management Sciences, Fellow of the CharteredInstitute of Management Accountants, Chartered Global ManagementAccountant and a Fellow of the Association of Corporate Treasurers.Appointment to the board: October 2010.Committee membership: Treasury.Skills and experience: Russ’s skills and experience in accounting,treasury, tax, M&A and investor relations in other commercial andregulated companies, along with his extensive experience of drivingperformance improvement and managing large capital investmentprogrammes, provides the group with valuable expertise with regard toits drive for improvements in customer service, business development,operations, capital investment and financing.Career experience: Chief financial officer at Telecom New Zealand.Previously finance director of Lovells, BT Wholesale, BT Networks andInformation Services, ICI Polyurethanes and ICI Japan.Current directorships/business interests: Member of the supervisoryboard and chairman of the audit committee of Orange Polska SA,the largest listed telecommunications company in Poland. He is amember of the main committee and chairman of the financial <strong>report</strong>ingcommittee of the 100 Group. He is also chief financial officer of UnitedUtilities Water Limited.Qualifications: MA Geography, PhD Economic History.Appointment to the board: March 2007.Committee membership: Nomination, audit, remuneration andcorporate responsibility (chair).Skills and experience: Catherine’s civil service background andunderstanding of the operation of government departments and utilityregulation are particularly valued given the regulated frameworkwithin which the business operates.Career experience: Formerly a non-executive director of the CivilAviation Authority and prior to that a former civil servant and actingpermanent secretary at the Department for Trade and Industry. Previouslya non-executive director of Ensus Limited and Swiss Re GB Plc.Current directorships/business interests: Non-executive directorand executive board member of the Department of Health and anon-executive director of National Grid Gas plc and National GridElectricity Transmission plc. She is also an independent non-executivedirector of United Utilities Water Limited.58
UNITED UTILITIES GROUP PLC ANNUAL REPORT AND FINANCIAL STATEMENTS <strong>2015</strong>Stock Code: UU.<strong>united</strong><strong>utilities</strong>.comQualifications: Bachelor of Law.Appointment to the board: September 2014.Committee membership: Nomination, audit andcorporate responsibility.Brian May (51)Independentnon-executive directorQualifications: BSc (Hons) Actuarial Science, Chartered AccountantFCA.Appointment to the board: September 2012.Stephen Carter (51)Independentnon-executive directorSkills and experience: As the CEO of a FTSE listed company, Stephenbrings current operational experience to the board. His time spent inpublic service will provide additional insights to the board regardingregulation and government relations, and his experience in the mediaand technology industries will provide a new perspective for the board’sdiscussions.Career experience: Prior to his appointment as group chief executive atInforma plc on 1 January 2014, he was appointed CEO designate on 1September 2013, having previously served on its board as an independentnon-executive director and member of the audit committee. He has alsoheld non-executive director positions at Travis Perkins plc and Royal MailHoldings plc. Previous roles include president/managing director, Europe,Middle East & Africa, and a member of the executive management boardat Alcatel Lucent Inc. Stephen has also held a number of public serviceroles, serving a term as the founding chief executive of Ofcom. He wasformerly chairman of the board at Ashridge Business School. He is a LifePeer.Current directorships/business interests: Group chief executive atInforma plc and a governor of the Royal Shakespeare Company. He is alsoan independent non-executive director of United Utilities Water Limited.Committee membership: Nomination, audit (chair), treasury (chair).Skills and experience: Brian joined Bunzl plc in 1993 as head of internalaudit before becoming group treasurer, then finance director, Europeand Australasia, and is currently finance director. Brian’s backgroundand the various finance roles that he has held are major assets to theboard in chairing both the audit and the treasury committees.Career experience: Brian has been finance director at Bunzl plc since2006 and prior to that held a number of senior finance roles withinthe company. Prior to joining Bunzl, Brian qualified as a charteredaccountant with KPMG.Current directorships/business interests: Finance director at Bunzlplc. He is also an independent non-executive director of UnitedUtilities Water Limited.Mark Clare (57)Senior independentnon-executive directorQualifications: Chartered Management Accountant (FCMA).Appointment to the board: November 2013.Committee membership: Nomination, remuneration.Skills and experience: As the CEO of a FTSE listed company, Markbrings additional current operational experience to the board. His timeat British Gas and BAA means he has a strong background operatingin a regulated environment and his extensive knowledge of customerfacingbusinesses is particularly valuable as the industry prepares forincreased competition and pursues its continuous drive to improvecustomer service.Career experience: Mark has been group chief executive at BarrattDevelopments plc since October 2006 and is also a trustee of theBuilding Research Establishment and the UK Green Building Council.Prior to joining Barratt, he was an executive director of Centrica plcand held a number of senior roles within both Centrica plc and BritishGas. Mark has also been a non-executive director of BAA plc, theairports operator.Current directorships/business interests: Group chief executive atBarratt Developments plc. He is also an independent non-executivedirector of United Utilities Water Limited.Qualifications: MA Chemistry.Appointment to the board: March 2012.Sara Weller (53)Independentnon-executive directorCommittee membership: Nomination and remuneration (chair).Skills and experience: Sara’s experience of customer-facingbusinesses, together with her knowledge of operating within aregulated environment, is a major asset to the board as the waterindustry prepares for the opening up of the sector to more competitionand in improving customer service.Career experience: Sara has wide-ranging business experience havingworked for Mars, Abbey National and J Sainsbury plc and latterly asmanaging director of Argos from 2004 to 2011. She served as thesenior independent director at Mitchells and Butlers from 2003 to2006 and also chaired its remuneration committee from 2003 to 2010.Current directorships/business interests: Non-executive directorof Lloyds Banking Group plc and lead non-executive director for theDepartment for Communities and Local Government. Sara is chair ofthe Planning Inspectorate, (an executive agency of the Departmentof Communities and Local Government), a board member at theHigher Education Funding Council for England and a council memberat Cambridge University. She is also an independent non-executivedirector of United Utilities Water Limited.SHAREHOLDER INFORMATION FINANCIAL STATEMENTS GOVERNANCESTRATEGIC REPORTNick Salmon retired from the board on 24 July 201459
UNITED UTILITIES GROUP PLC ANNUAL REPORT AND FINANCIAL STATEMENTS <strong>2015</strong>Stock Code: UU.<strong>united</strong><strong>utilities</strong>.comCorporate governance <strong>report</strong>Letter from the ChairmanQuick facts• The Chairman met theindependence criteria as setout in the 2012 UK CorporateCode (the Code) when he wasappointed as Chairman• The Code requires that at leasthalf of the board is made upof independent non-executivedirectors (the test excludes theChairman). At United Utilities,five out of the remainingseven directors (excluding theChairman) are independent nonexecutivedirectors• The company secretary attendsall board and committeemeetings and advises theChairman on governancematters. The companysecretariat team providesadministrative support• All directors are subject to<strong>annual</strong> election at the AGMheld in July. Following thecompletion of the <strong>annual</strong>evaluation process all thenon-executive directors wereconsidered by the board tobe independent and makinga valuable and effectivecontribution to the board. As aresult, the board recommendsthat shareholders vote in favourof those standing for a furtherterm at the forthcoming AGMQuick linksThe details of the matters thatthe board has reserved for itsown decision can be found in the‘Schedule of matters reserved forthe board’. A copy can be found atcorporate.<strong>united</strong><strong>utilities</strong>.com/corporate-governanceA copy of the FRC 2012 UKCorporate Governance Codecan be found at frc.org.uk/Our-Work/Publications/Corporate-Governance/UK-Corporate-Governance-Code-September-2012.pdfDear shareholder,Our yearThe focus of the board has beenin the planning for United UtilitiesWater’s (UUW’s) next five-yearregulatory period for <strong>2015</strong> to 2020,and endeavouring to ensure the longtermsuccess of the company and thegroup for that period and beyond. Theboard has concentrated on pursuingthe company’s continuing strategy toprovide the best service to customers,at the lowest sustainable cost and in aresponsible manner, and in meeting thechallenges of the financial year ended31 March <strong>2015</strong>.Having the same directors on boththe UUG and UUW boards (with theaddition of Steven Fraser, managingdirector of UUW’s Wholesale business,on the UUW board) reflects our visionwhich is to focus on our core water andDr John McAdamChairmanwastewater business and become aleading North West service provider.So, whilst both the UUG and UUWboards’ agendas have been dominatedby the next regulatory period, the UUGboard has also been addressing thestrategic and directional challenges ofthe group. Our governance processesalso address Ofwat’s publishedprinciples on board leadership,transparency and governance, and ourstatement can be found on our websiteat corporate.<strong>united</strong><strong>utilities</strong>.com/corporate-governanceWe have achieved considerableprogress against our strategy,particularly in customer service,although this is still a primaryarea of focus for the board. Theimplementation of our new operatingOur intention is to handover the business to oursuccessors in a better andmore sustainable position forthe future60
UNITED UTILITIES GROUP PLC ANNUAL REPORT AND FINANCIAL STATEMENTS <strong>2015</strong>Stock Code: UU.<strong>united</strong><strong>utilities</strong>.commodel for our wholesale businessemploying new technology and newwork processes will support us inachieving this target. The board issdetermined to maintain the rate ofprogress that has been achieved todate as we enter the next five-yearperiod.In January <strong>2015</strong>, the UUW board metto consider the best course of actionin terms of accepting or rejectingOfwat’s <strong>2015</strong>–20 final determination.The board concluded that, althoughthis was a challenging price control,we have plans in place to maintain andimprove services for customers andprovide an appropriate return for ourinvestors.Our approachAs individual directors we arecognisant of our statutory duties andin particular to promote the long-termsuccess of our company. Our role asthe board is to set the strategy ofthe group, and ensure its long-termsuccess and create shareholder value.Our intention as directors is to handover the business to our successorsin a better and more sustainableposition for the future. Information onour vision and strategy and the way inwhich we create value is included in thestrategic <strong>report</strong> on pages 4 to 55.Our governance structureWe held eight scheduled boardmeetings during the year, whichwere attended by all directors.There were also a number of ad hocboard meetings held which directorsattended either in person or viatelephone conferencing facilities,a number of which related to theboard’s involvement in the pricereview process. A diagram showingthe inter-relationships of the variousboard committees can be found onpage 64, and <strong>report</strong>s from each of thecommittee chairs about their workcan be found on the following pages.The diagram also describes some ofthe group’s principal managementcommittees.Our peopleNick Salmon retired as a director atthe AGM on 25 July 2014 and at thattime Mark Clare replaced him as seniorindependent director. We welcomedStephen Carter to the board as anindependent non-executive directorand member of the audit committeeon 1 September 2014. On Stephen’sappointment, Mark Clare steppeddown from the audit committee andwas appointed as a member of theremuneration committee.Stephen brings to the board tablea strong career in government andregulation, having held a number ofpublic sector roles, including servinga term as the founding chief executiveof Ofcom. He is currently group chiefexecutive at Informa plc, a FTSE 250listed company. Further information onthe process for Stephen’s appointmentcan be found in the <strong>report</strong> of thenomination committee on pages 68 to72.We have maintained our target ofat least 25 per cent of our boardcomprising of women, and in termsof diversity of experience, skills andpersonal attributes, we have greatdiversity around our board. Goodboard dynamics are vital to the properinteraction and working of a boardof directors. Board directors need towork together effectively for the goodof the company and, in short, theyneed to get on with each other; clashesof personality are to be avoided asthey do not facilitate constructivedebate and challenge and effectivecommunication.Collectively, the directors have manyyears of experience gained acrossa variety of areas and industries.Some have spent part of their careersoverseas, and whilst there is a hugediversity in their skills and experience,they have predominantly worked inregulated industries, as is appropriate.Around our board table, I believe wehave individuals who will apply theirskills and experience to the benefitof our business and speak up if theydisagree but, equally, listen to theviews of others.The focus of the grouphas been in the planningfor UUW’s next fiveyearregulatory periodfor <strong>2015</strong> to 2020 andendeavouring to ensurethe long-term successof the company and thegroup for that period andbeyond.Code principlesLeadershipRead more on page 63EffectivenessRead more on page 66AccountabilityRead more on page 74Relations with shareholdersRead more on page 73RemunerationRead more on page 84SHAREHOLDER INFORMATION FINANCIAL STATEMENTS GOVERNANCESTRATEGIC REPORT61
UNITED UTILITIES GROUP PLC ANNUAL REPORT AND FINANCIAL STATEMENTS <strong>2015</strong>Stock Code: UU.<strong>united</strong><strong>utilities</strong>.comCorporate governance <strong>report</strong>Letter from the ChairmanAlthough there are time constraintsfor non-executive directors whoalso have an executive role, theseindividuals bring valuable currentmarket experience to any board table.Similarly, we encourage our executivedirectors to serve as a non-executivedirector elsewhere to help broadentheir experience, although this isrestricted to one other directorship ina company which does not conflict withUnited Utilities’ business.Our CEO, Steve Mogford, has madesome changes during the year to thestructure of his executive team ofsenior managers. This has resulted in achange of <strong>report</strong>ing lines and a relatedchange in the male:female ratios of theexecutive team (excluding the CEO andCFO) of 4:3, (2014: 5:5).Our ethos and cultureOne of our key core values, both atboard level and as a company, is toact with integrity, by applying thehighest standards of responsiblebusiness practice. The company hascomplied with the 2012 UK CorporateGovernance Code in accordance withthe FCA’s Listing Rules with which wewere required to comply for the yearended 31 March <strong>2015</strong>. For the periodfrom 25 July 2014 (on the retirementof Nick Salmon) until 1 September2014 (on the appointment ofStephen Carter), there were only twoindependent non-executives directorsappointed to the remunerationcommittee, notwithstanding thefact that the Code requires thatthree independent non-executivedirectors be appointed. During thistime no meetings of the remunerationcommittee were scheduled or held andas a result we do not regard this asbeing an incident of non-compliancewith the Code.Our approach to riskWe adopt a prudent approach tothe way we manage the risks to ourbusiness; we feel this is appropriatefor an organisation such as oursthat provides a vital service toits customers, and is an approachthat permeates the culture of ourbusiness. That being said, we are acommercial organisation operatingwithin a regulated framework, andaccepting some level of risk is anormal consequence of doing business.It is the board’s and the executiveteam’s role to understand the risksassociated with each activity of thebusiness and that actions are takento mitigate these risks as they feelappropriate. The greatest risk to ourbusiness is ensuring that we get theconstituent elements of our five-yearlybusiness plans correct to ensure ourfinanceability, and that they are agreedby Ofwat in its final determination, aswe are bound by these plans for thefollowing five-year period with limitedopportunity to change them.Our investorsThe remuneration committee, underSara Weller’s leadership, has beeninstrumental in updating the executivedirectors’ remuneration packages toensure they align the directors’ andsenior managers’ interests with thelong-term interests of the companyand its shareholders. At the time thechanges were introduced in 2013,the committee went to considerableeffort to consult on the changes witha number of the company’s largeinvestors. At the 2014 AGM, 98.48per cent of the vote was in favour ofthe directors’ remuneration policy and,although only an advisory vote, 99.39per cent of the votes cast were infavour of the directors’ remuneration<strong>report</strong>, which would suggest that ourinvestors are comfortable with ourapproach to reward.We welcome any feedback you mayhave on this <strong>annual</strong> <strong>report</strong> -please email any comments you mayhave to secretariat@uuplc.co.ukDr John McAdamChairman62
UNITED UTILITIES GROUP PLC ANNUAL REPORT AND FINANCIAL STATEMENTS <strong>2015</strong>Stock Code: UU.<strong>united</strong><strong>utilities</strong>.comCode principle: LeadershipOverview of the board’sresponsibilities• The board is responsible forsetting the strategy of thegroup and ensuring the longtermsuccess of the group forcustomers, investors and widerstakeholders; and in creatingshareholder value• The board is responsible forchallenging and encouraging theexecutive team in its interpretationand implementation of how itmanages the business, and that itis doing so in accordance with thestrategic goals the board has set• The board is responsible forensuring the company’s internalcontrol systems (includingfinancial, operational andcompliance) and processes aresound and fit for purpose. Seethe ‘accountability’ section of this<strong>report</strong> on page 74 for more detail• The board is responsible forensuring that the company has thenecessary financial resources andpeople with the necessary skillsto achieve its objectives. It alsoreviews managerial performance<strong>annual</strong>ly• The UUG board has oversight ofcapital expenditure projects withinUUW which exceed £50 million,and any project which materiallyincreases the group’s risk profile oris not in the ordinary course of thegroup’s business• Full details of the matters thatthe board has reserved for itsown decision making due to theirimportance to the business orthe working of the board, can befound on our website at corporate.<strong>united</strong><strong>utilities</strong>.com/corporategovernanceDirectors’ tenure as at 31 March <strong>2015</strong>John McAdamSteve MogfordRuss HouldenCatherine BellStephen CarterMark ClareBrian MaySara WellerDirectors’ key responsibilitiesTitle Name ResponsibilityChairman John McAdam Is responsible for the leadership of theboard, setting its agenda and ensuring itseffectiveness in all aspects of its roleChief ExecutiveOfficerChief FinancialOfficerIndependent nonexecutivedirectorsSenior independentnon-executivedirector31 March200631 March2007Steve MogfordRuss HouldenCatherine BellBrian MayStephen CarterSara WellerMark Clare31 March2008Governance structure forour board and our committeesIn line with the Code, the board delegatescertain roles and responsibilities to itsvarious principal board committees, asshown in the diagram on page 64. Whilstthe board retains overall responsibility,a sub-committee structure allowsthese committees to probe the subjectmatter more deeply and gain a greaterunderstanding of the detail, and then<strong>report</strong> back to the board on the mattersdiscussed. The <strong>report</strong>s of the principalboard committees required by the Codecan be found on the subsequent pages.Minutes of the board and principalcommittee meetings (with the exceptionof the remuneration committee) aretabled at board meetings and the chairsof each of the board committees verbally<strong>report</strong> to the board on their activities.The executive team is chaired by theCEO, and its members are the senior31 March200931 March201031 March201131 March201231 March201331 March2014To manage the group’s business andto implement the strategy and policyapproved by the board7yrs 2m4yrs 3m4yrs 6m8yrs 1m1yr 5m2yrs 7mTo manage the group’s financial affairsand to contribute to the management ofthe group’s business7m3yrs 1mTo challenge constructively the executivedirectors and monitor the delivery ofthe strategy within the risk and controlframework set by the board31 March<strong>2015</strong>managers who have a direct <strong>report</strong>ingline to the CEO. The executive teammeets monthly and is responsible foroperational matters and implementingthe strategies that the board has set, andthe day-to-day running of the business.Short biographies of the executiveteam can be found on our website atcorporate.<strong>united</strong><strong>utilities</strong>.com/<strong>united</strong><strong>utilities</strong>-executive-teamThe structure chart shown on page 64also shows the principal managementcommittees and a brief description oftheir roles. These committees enablesenior management to understand and,if necessary, challenge the business inits interpretation of the implementationof the strategies the board has set. Theboard received <strong>report</strong>s from the CEO andCFO at every scheduled board meeting,providing the board with an updatedoverview of the business and its financialposition.Is responsible, in addition to his role as anindependent non-executive director, fordiscussing any concerns with shareholdersthat cannot be resolved through thenormal channels of communication withthe Chairman or chief executive officer63SHAREHOLDER INFORMATION FINANCIAL STATEMENTS GOVERNANCESTRATEGIC REPORT
UNITED UTILITIES GROUP PLC ANNUAL REPORT AND FINANCIAL STATEMENTS <strong>2015</strong>Stock Code: UU.<strong>united</strong><strong>utilities</strong>.comCorporate governance <strong>report</strong>Governance structure of the board and its principal committees and the principal management committeesGROUP BOARDChair: John McAdamChief Executive OfficerPrincipal board committeesPrincipal management committeesAUDITCOMMITTEEChair: Brian MayRead more on pages 76 to 81EXECUTIVE TEAMChair: Steve Mogford, CEOThis forum is responsible for implementing theboard’s strategy and the day-to-day operation ofrunning the business.REMUNERATIONCOMMITTEEChair: Sara WellerRead more on pages 84 to 103NOMINATIONCOMMITTEEChair: John McAdamRead more on pages 68 to 72CORPORATERESPONSIBILITY COMMITTEEChair: Catherine BellRead more on pages 82 and 83GROUP AUDIT AND RISK BOARDChair: Steve Mogford, CEORead more on page 81SECURITY GOVERNANCE BOARDCo chairs: Sally Cabrini, business servicesdirector and Paula Steer, director of operationalcontrolThis forum is responsible for setting andensuring the implementation of the securitygoals of the business, encompassing allelements of security i.e. IT and systems security,physical security, fraud, business continuity andresilience and any emerging security issues.TREASURYCOMMITTEEChair: Brian MayThe committee considers and approvesborrowing, leasing, bonding and otherbanking facilities within limits set by theboard. The CFO and treasurer are alsomembers. Some powers are sub-delegated,within certain limits, to the CFO andtreasurer.QUARTERLY BUSINESS REVIEWChair: Steve Mogford, CEOThis forum is responsible for the quarterly reviewof operational and financial performance.POLITICAL AND REGULATORYSTEERING GROUPChair: Gaynor Kenyon, corporate affairs directorThis forum is responsible for discussing politicaland regulatory issues affecting the company,where any ‘horizon scanning’ issues are raised andbusiness responses to consultations are agreed.64
UNITED UTILITIES GROUP PLC ANNUAL REPORT AND FINANCIAL STATEMENTS <strong>2015</strong>Stock Code: UU.<strong>united</strong><strong>utilities</strong>.comBoard activity in 2014/15Cross referenceShareholder relations• Received and discussed a presentation by Makinson Cowell on investors’ views and See page 73perceptions• Received and discussed feedback from roadshows/presentations to investors bythe CEO and/or CFOLeadership and employees• Reviewed and discussed the health and safety of employees• Considered board succession planning and the appointment of Stephen Carter as anew non-executive director• Reviewed and discussed executive succession plans and the needs of the businessand an update on the activities to develop talented employees• Discussed the results of the <strong>annual</strong> employee engagement surveyStrategy• Debated and discussed developments in shale gas in the North West of England• Reviewed the group’s energy strategy and the progress with the installation ofrenewable sources of energy production at treatment works and other facilities• Held a strategy session debating and discussing the future direction of Wholesale,Domestic Retail and Business Retail business unitsGovernance• Reviewed and debated the risk profile of the group and in particular the principalrisks• Reviewed and discussed updates on cyber security and information managementstrategies• Approved revised terms of reference for the audit, remuneration, treasury andcorporate responsibility committees• Reviewed bi<strong>annual</strong> updates on changes and developments in corporate governance• Reviewed and discussed the evaluation of the board, its committees and individualdirectors and conflicts of interest• Reviewed the performance of the external auditor and recommendation forreappointment• Reviewed the effectiveness of the risk management and internal control systemsRegulation (UUW business)• Reviewed, challenged and approved the <strong>2015</strong>–20 business plan submission• Reviewed the award of the framework contracts for capital programme contractorsfor the <strong>2015</strong>–20 period• Approval of capital expenditure to modernise Davyhulme wastewater treatmentworksFinancial• Reviewed and challenged the dividend policy• Reviewed and approved the half and full year results and associatedannouncements• Reviewed and approved the company’s tax strategy• Reviewed and approved the company’s treasury policy and insurance arrangements• Reviewed progress with material cases of litigation involving the groupKey to strategic objectivesBest service to customers Lowest sustainable cost Responsible mannerSee page 73See page 38See page 70See pages 71-72See page 38See page 37See page 54See page 54See page 66See page 78See page 74See page 8See page 14See pages 8-9See page 40See page 53Link to strategicobjectivesSHAREHOLDER INFORMATION FINANCIAL STATEMENTS GOVERNANCESTRATEGIC REPORT65
UNITED UTILITIES GROUP PLC ANNUAL REPORT AND FINANCIAL STATEMENTS <strong>2015</strong>Stock Code: UU.<strong>united</strong><strong>utilities</strong>.comCorporate governance <strong>report</strong>Company secretaryIndependent non-executive directorSenior independent non-executive directorThe boardroom tableExecutive directorChairmanChairmanExecutive directorSenior independent non-executive directorIndependent non-executive directorCompany secretaryAttendance at board andcommittee meetingsEight scheduled board meetings wereplanned and held during the year(2014: eight). A number of other boardmeetings and telephone conferenceswere also held during the year, as theneed arose. The table below showsthe actual number of scheduledmeetings attended and the maximumnumber of scheduled meetings whichthe directors could have attended.As directors, our intention is alwaysto attend all scheduled boardand committee meetings; only inexceptional circumstances would wenot do so. Similarly, every effort ismade to attend ad hoc meetings eitherin person or via the use of video ortelephone conferencing facilities ifneeds be. None of our non-executivedirectors have raised concerns overthe time commitment required of themto fulfil their duties.On the evening before each scheduledboard meeting all the non-executivedirectors meet together with the CEO;this time is usefully spent enabling usto share views and cross-check ourunderstanding of certain issues.Code principle: EffectivenessBoard evaluationWe engaged Lintstock Consultants(Lintstock) to undertake our externalevaluation; they also conducted theexternal evaluation in 2012. Otherthan conducting the 2012 evaluation,Lintstock had no other connection withthe company.The process, facilitated and evaluatedby Lintstock, was based on thecompletion of online questionnairesby board members addressing theperformance of the board and itscommittees, the Chairman andindividual directors.In addition to board members, othermembers of the executive teamwho regularly attend and supportcommittee meetings were asked tocomplete the same questionnaires.The anonymity of all respondents wasensured throughout the process inorder to encourage an open and frankexchange of views. The results werethen analysed by Lintstock; werethen discussed with the Chairman,the chair of the relevant committee,and the company secretary; tabled ata meeting of the relevant committee;and then presented to the board.BoardmeetingsAuditcommitteeRemunerationcommitteeNominationcommitteeJohn McAdam 8 8 n/a n/a 4Steve Mogford 8Russ Houlden 8CorporateresponsibilitycommitteeTreasurycommittee4 n/a n/a8 n/a n/a n/a 2 2 n/a8 n/a n/a n/a n/a 4 4Catherine Bell 8 8 4 4 5 5 4 4 2 2 n/aStephen Carter 4Mark Clare 8Brian May 8Nick Salmon 4Sara Weller 84 2 3 n/a 1 1 2 2 n/a8 1 1 3 3 4 4 n/a n/a8 4 4 n/a 3 4 n/a 4 44 0 1 2 2 2 2 n/a n/a8 n/a 5 5 3 4 n/a n/aActual number of meetings attendedMaximum number of scheduled meetings which the directors could have attended(1) Nick Salmon retired from the board and the relevant committees with effect from the close of the AGM held on 25 July 2014. Nick was unable to attend themeeting of the audit committee in May 2014.(2) Stephen Carter was appointed to the board and the audit, nomination and corporate responsibility committees on 1 September 2014, at which time MarkClare stepped down from the audit committee and joined the remuneration committee. Stephen was unable to attend the November 2014 meeting of theaudit committee due to a pre-existing commitment arranged prior to him joining the board.(3) Sara Weller and Brian May were not able to attend the August 2014 meeting of the nomination committee, as it was arranged at short notice.66
UNITED UTILITIES GROUP PLC ANNUAL REPORT AND FINANCIAL STATEMENTS <strong>2015</strong>Stock Code: UU.<strong>united</strong><strong>utilities</strong>.comA summary of Lintstock’s analysis of the 2014/15 evaluation is as follows:Board composition andexpertiseBoard agendaBoard supportWider strategic oversightRisk management andinternal controlSuccession planning andhuman resource managementCommitteesIndividual directorsBoard members’ skills and expertise were felt to be appropriate, and in particular theboard members’ knowledge and understanding of the regulatory environment the companyoperates within, along with their understanding of the views of regulators, customers andinvestors.The allocation of time spent on the key strategic issues of the price review during the yearwas appropriate as were the other topics devoted to board discussion. With the completionof the price review, more time could now be allocated to address the advent of furthermarket reform and competition in the sector.Presentations to the board and the timeliness of board documentation were appropriate,although improvements could be made to the content and format of papers. The supportand training needs of board members continued to be addressed.The involvement of the board in the development of the strategic direction of the group wasconsidered to be appropriate. The board would consider what improvements could be madeto the format of the board strategy day.The board’s approach to the management of risk was considered to be appropriate, withsuggestions being made to refine the management and oversight of risk overall.Board members felt that the senior management structure and the succession planning forexecutive and key management positions supported the strategic objectives. The visibilityby the board of potential internal candidates for succession should be maintained andenhanced.The composition and performance of the audit, remuneration, nomination, corporateresponsibility and treasury committees were considered to be appropriate.The individual performance of the directors was assessed; all of which were considered tobe effective and all directors demonstrated the expected level of commitment to the role.The review of the Chairman’s performance, led by the senior independent director and thatof Catherine Bell concluded that both continued to demonstrate an independent approach,notwithstanding they had each served in excess of six years as a director.The internal evaluation conducted in 2013/14 identified the following actions:• There was a need to improve further the visibility and engagement of the executive team and a wide range of seniormanagers with the board and provide more opportunities for such engagement; and• Maintain the strong focus on succession planning for executives and those in critical posts in the talent pipeline.Whilst progress has undoubtedly been made during the year, these are enduring themes which will continue to be pursued.TrainingSpecific training has been provided to the directors during the year on a number of areas including regulatory mattersand changes in <strong>report</strong>ing and governance requirements and their responsibilities in accordance with the Goods Vehicles(Licensing of Operators) Act 1995. On the appointment as a director to the UUG and/or the UUW board, directors receiveinformation on the key duties of being a director of a regulated water company including the role of the regulated company’sholding company. This information is kept continually under review.SHAREHOLDER INFORMATION FINANCIAL STATEMENTS GOVERNANCESTRATEGIC REPORT67
UNITED UTILITIES GROUP PLC ANNUAL REPORT AND FINANCIAL STATEMENTS <strong>2015</strong>Stock Code: UU.<strong>united</strong><strong>utilities</strong>.comCorporate governance <strong>report</strong>Nomination committeeNomination committeemembers• Dr John McAdam (chair)• Dr Catherine Bell• Stephen Carter• Mark Clare• Brian May• Sara WellerRead biographies of the directorson pages 58 and 59Dr John McAdamChair of the nominationcommitteeQuick facts• The Code requires that a‘majority of members of thenomination committee shouldbe independent non-executivedirectors’• The role of the committee isto make recommendations tothe board on its composition,balance and membership and onrefreshing the membership ofthe board committees• The company secretary attendsall meetings of the committee• The business services director,who has responsibility forhuman resources, regularlyattends meetings and isresponsible for engaging withexecutive search recruitmentadvisors• The CEO is not a member ofthe committee, but from timeto time is invited to attend.Neither the Chairman northe CEO would participate inthe recruitment of their ownsuccessorQuick linksTerms of reference – corporate.<strong>united</strong><strong>utilities</strong>.com/corporategovernanceDear shareholder,We have, for the fourth successiveyear, undertaken the recruitment ofa new non-executive director, whichculminated in the appointment ofStephen Carter to the board on1 September 2014.We feel as we move forward intoa new regulatory period that ourdirectors have an excellent mix ofskills and experience for leading thecompany into the new five-year period.The combination of relatively newdirectors, coupled with those that haveserved for a number of years, providesus with the benefit of new ideas, whilstnot losing sight of what has gone inthe past. We have maintained a 25 percent gender diversity ratio, and theboard gender diversity policy is takeninto account during every candidateselection process. Ultimately, we striveto appoint the person we believe isbest matched to the role in terms ofwhat they have to offer the companyand to make a positive contributionto the board conversation and boarddynamics.With the retirement of Nick Salmon,Mark Clare took over the role of seniorindependent director. When StephenCarter joined the board he replacedMark Clare as a member of the auditcommittee and Mark joined theremuneration committee.Dr John McAdamChair of the nomination committeeWe have maintained a25 per cent gender diversityratio and the board genderdiversity policy is takeninto account during everycandidate selection process68
UNITED UTILITIES GROUP PLC ANNUAL REPORT AND FINANCIAL STATEMENTS <strong>2015</strong>Stock Code: UU.<strong>united</strong><strong>utilities</strong>.comMain responsibilities ofthe committee• Lead the process for boardappointments and makerecommendations to the boardabout filling vacancies on theboard, including the companysecretary• Consider the succession planningof directors and members of theexecutive team• Make recommendations tothe board on refreshing themembership of the board’sprincipal committees• Review directors’ conflictauthorisations• Consider the request fromexecutive directors for electionto the boards of other companiesand make a recommendation tothe board• Consider requests from nonexecutivedirectors for theelection to the boards of othercompanies; this role has beendelegated to the Chairman(other than in respect of his ownposition)Skills matrix of board directorsWhat has been on the committee’sagenda during the year1. Board successionThe committee:• considered the successionrequirements of the board;Finance/accounting Utilities Regulation• appointed executive searchconsultants Russell ReynoldsAssociates (Russell Reynolds) tobegin the process of the recruitmentof a non-executive director andprovided a brief to Russell Reynoldssetting out the attributes of apreferred candidate;• considered and reviewed the long listof candidates and identified those tobe shortlisted for interview initiallywith the Chairman, CEO and thebusiness services director. A numberof candidates were then invited tomeet with the other non-executivedirectors and the CFO; and• discussed the candidates and the‘best fit’ with the skills matrix (asshown below); took into accountthe board diversity policy andthe specification provided to theexecutive search consultants;and duly made a recommendationto the board to appoint StephenCarter as the successful candidate.Stephen brings to the board tablea strong career in government andregulation, having held a numberof public sector roles includingserving a term as the founding chiefexecutive of Ofcom. He is currentlygroup chief executive at Informa plc,a FTSE 250 listed company.Government andcivil serviceRussell Reynolds is a signatory to thevoluntary code of conduct on genderdiversity for executive search firms; it hasno other connection with the group otherthan being used on previous occasions forexecutive search purposes.2. Refreshing the membership ofthe principal committeesNick Salmon’s departure from theboard left a vacancy on each of theboard’s principal committees.The conclusion was reached that thisprovided us with an opportunity toswitch Mark Clare to the remunerationcommittee and to appoint StephenCarter to the audit committee givenhis familiarity with the role of theaudit committee from his time as anon-executive director at Informaplc. Stephen was also appointed as amember of the corporate responsibilitycommittee.3. Board diversityWe have retained the 25 per centgender diversity ratio on our board, inaccordance with our board diversitypolicy, and the recruitment process fora new non-executive director was inline with the policy in terms of genderdiversity. Of the 10 candidates in thelong list, two were female, and of theshortlist of four, one was female.Construction/engineering/industrialCustomerfacingFTSEcompaniesJohn McAdam 4 4 4 4Steve Mogford 4 4 4 4Russ Houlden 4 4 4 4 4 4Catherine Bell 4 4 4Stephen Carter 4 4 4 4 4Mark Clare 4 4 4 4 4 4Brian May 4 4 4 4Sara Weller 4 4 4 4SHAREHOLDER INFORMATION FINANCIAL STATEMENTS GOVERNANCESTRATEGIC REPORT69
UNITED UTILITIES GROUP PLC ANNUAL REPORT AND FINANCIAL STATEMENTS <strong>2015</strong>Stock Code: UU.<strong>united</strong><strong>utilities</strong>.comCorporate governance <strong>report</strong>Nomination committeeQ&A - Stephen CarterGaining an insight into theculture of the companyHow has your induction processso far been insightful?My induction has provided areassuring window into thecompany’s culture. It has beenthorough, detailed, professionaland enjoyable. At all levels withinthe business, I have been met withindividuals committed to deliveringfor their customers, open to change,and excited about the future of thisindustry.Have your perceptions of UnitedUtilities changed since youjoined the board?Like many people, I associatewater and wastewater serviceswith a simple turn of the tap orflush of the loo! The deeper Idelve into the business, gaining agreater understanding of what liesbehind the service delivery, thecommitment to the environment,and the large capital demandsplaced on a business like UnitedUtilities, the more I recognise theimportance of a clear strategy,effective leadership and a coherentboard providing oversight andconstructive challenge.In what way do you think youcan best share your previousexperience with United Utilities?My experiences in technologyindustries and in regulationare directly relevant to UnitedUtilities, today and even more soin the future. We are seeing theever-increasing deployment ofmonitoring technology, increasinglydemanding customers, bothin business and residentially,and critically, a new regulatorylandscape emerging across thewater industry.Having seen and participatedin major regulatory change inanother industry that was broadlysuccessful and helped deliver,in both telecommunications andmedia, real investment, innovationand significant price reductions,I recognise the importance ofensuring that the incentives andthe level of return are right for bothconsumers and the industry.Finally, as CEO of a business that isfacing a different set of challenges,but many the same, I hope to be ableto contribute another perspectiveon leadership and strategy to theexecutive team.Whilst the committee was mindful ofthe benefits of gender diversity, it wasfelt that Stephen was the strongestcandidate and had the most relevantexperience.We are keen to develop our femalesenior managers so that, over time,they can be considered for boardappointments at United Utilities or aspotential candidates for non-executivedirectorships in other companies. Webelieve a non-executive appointmentprovides an excellent opportunity forboth personal and career developmentand is a way of gaining valuableexperience that may be applied atUnited Utilities.As is the case in many UK companies,certain activities remain more widelypopulated by men (e.g. in operationaland engineering activities) or women(e.g. customer contact centre roles andsupport services). United Utilities isno exception, but we are continuing ouractivities to try and address genderimbalances at all levels and in all areasof our business.Summary of boarddiversity policyEnsure the selection process forboard candidates provides accessto a range of candidates, althoughany appointments will be made onthe basis of equal merit but with dueregard for the benefits of diversityon the board, including genderdiversityEnsure that the policies adopted bythe group will, over time, promotegender diversity among seniormanagers who will in turn aspire to aboard positionIn selecting candidates for boardpositions, only use the services ofexecutive search firms who havesigned up to the voluntary code ofconduct for executive search firmsas recommended by Lord DaviesAdopt measurable objectives fromtime to time for achieving genderdiversity at board level – which shallcurrently be to maintain at least 25per cent female representation70
UNITED UTILITIES GROUP PLC ANNUAL REPORT AND FINANCIAL STATEMENTS <strong>2015</strong>Stock Code: UU.<strong>united</strong><strong>utilities</strong>.comWhat have we done in 2014/15?Improving gender diversity across the talent poolOur graduate scheme continues to be successful inattracting female applicants. This year the number offemale graduates offered roles with United Utilitiesincreased to 42 per cent. The overall number of femalegraduates on the scheme has also increased from 35 percent to 39 per cent.In 2014, there was a 34 per cent increase in femaleapplications to our apprentice scheme and an overallincrease in the number of female apprentices joining thecompany. The 2014 intake was 25 per cent female and ouroverall apprentice population is now 14 per cent female.This is above the national industry average of seven percent. Research from the Sector Skills Council for Science,Engineering and Manufacturing Technologies shows theaverage number of women in apprenticeships is betweenfive and seven per cent.In our executive team of nine (including the CEO andCFO), three are women, namely Sue Amies-King (businessretail director), Sally Cabrini (business services director)and Gaynor Kenyon (corporate affairs director). We areactively working with these individuals on their personaldevelopment plans, which include building their externalportfolio.Women hold 23 per cent of senior leadership positions.For this group, we actively support their individualpersonal development plans, which include encouragingthem to broaden their external network. We have runa number of successful events for our female talentpopulation, including an Army leadership day. GaryDixon, our domestic retail director and a member of ourexecutive team, is the executive sponsor of our diversityactivities.This year we have launched our women’s network and anumber of our senior managers have hosted events andexplained how they have developed their own careersand overcome barriers. In addition, we have invited guestspeakers from external organisations to share theircareer experiences. This has inspired the group to set up aself-managed women’s network group.We have an active partnership with the Energy andEfficiency Industrial Partnership (EEIP) which has enabledus to leverage initiatives which align and support ourdiversity plans.A great example of this is Charlotte Cottam, one of ourfemale apprentices who we have nominated to support anEEIP skills social media campaign to promote employmentopportunities in the utility sector to girls.This campaign was launched at the opening of our Boltontraining and technology centre by the then EmploymentMinister, Esther McVey. Charlotte was interviewed bymedia sources who then promoted her story in NationalApprentice Week. All of our apprentices are supported by asenior manager as part of their career development with us.“What appealed to me about UnitedUtilities is that it’s such an importantcompany. We’re always going to needwater – it’s a vital commodity. I lovebeing employed in a sector that I knowhas a long-term future.”Charlotte Cottam, apprentice engineer, workingwith the team looking after our sewer networkon MerseysideWe have widened our diversity focus and we havejoined Race for Opportunity (RfO), part of Business inthe Community and the leading organisation for ethnicdiversity and inclusion.In 2014, we participated in the RfO benchmarking surveywhich assesses the effectiveness of our policies andprocesses across recruitment, development, leadership,pay, and customer and supplier management. We achieveda bronze award. Our aspiration to improve our score in<strong>2015</strong> is underpinned by an action plan.The employee-run lesbian, gay, bisexual and transgendernetwork has recently been relaunched, and a number ofemployee events are being planned for <strong>2015</strong>.STRATEGIC REPORTGOVERNANCESHAREHOLDER INFORMATION FINANCIAL STATEMENTS71
UNITED UTILITIES GROUP PLC ANNUAL REPORT AND FINANCIAL STATEMENTS <strong>2015</strong>Stock Code: UU.<strong>united</strong><strong>utilities</strong>.comCorporate governance <strong>report</strong>Nomination committeeCase study – Jo Matzen , Area Business ManagerJo Matzen, who has a degree inBiomedical Science, has worked forUnited Utilities for 20 years.She started her career as a businessanalyst and has successfullyprogressed through a range ofoperational and technical roles.Three years ago she was selectedfor one of the newly created areabusiness manager (ABM) roles whichform a key part of our operatingmodel.As an ABM, Jo is accountable for theeffective and efficient delivery ofthe wastewater operations and assetplanning across the Merseysidearea. Within Jo’s patch is Liverpoolwastewater treatment workssituated on the banks of the RiverMersey. The facility has recentlybeen refurbished and is in theprocess of being extended at a costof around £200 million. Constructionwork is well underway; treatedwater leaving the new plant will becleaner and greener, helping thecontinuing rejuvenation of the RiverMersey and ensuring that it meetsstrict European standards for waterquality.Jo has actively mentored manycolleagues at United Utilitiesthroughout her time at the companyand she continues to be committedto supporting others in developingtheir careers.Jo says: “I thoroughly enjoyworking for United Utilities and amextremely proud to work in such avital service industry.”4. Conflicts of interestThe company’s articles of associationcontain provisions which permitunconflicted directors to authoriseconflict situations. Each director isrequired to notify the Chairman of anypotential conflict, and the board reviewsthe position of each director <strong>annual</strong>ly.No changes were recorded which wouldimpact the independence of any of thedirectors.5. Wider succession and talentmanagementAs part of succession planning a numberof changes were made to the membershipof the executive team. The membershipas a whole was reduced to nine (2014:12)including the CEO and CFO, with a ratio ofsix males to three females.Board compositionExecutive25%Male75%Non-Executive75%Female25%Age profile50–5537.5%56–6037.5%61–6512.5%66–7012.5%Pictured: Members of our female leadershiptalent pool taking part in a team buildingday with the Army at Fulwood Barracks inPreston. The day was designed to developa range of leadership, communication andproblem solving skills, all of which will beinvaluable in their roles as future leaders ofour business.72
UNITED UTILITIES GROUP PLC ANNUAL REPORT AND FINANCIAL STATEMENTS <strong>2015</strong>Stock Code: UU.<strong>united</strong><strong>utilities</strong>.comCorporate governance <strong>report</strong>Code principle:Relations with shareholdersThe board as a whole accepts itsresponsibility for engaging withshareholders and is kept fully informedabout information in the marketplaceincluding:• Makinson Cowell produces an <strong>annual</strong>survey of investors’ views andperceptions about United Utilities,the results of which are presentedand discussed by the board;• the board receives regular updatesand feedback on activities withininvestor relations and <strong>report</strong>s fromsector analysts to ensure that theboard maintains an understandingof investors’ priorities; and• the board welcomes engagementwith institutional investors. Theexecutive and non-executivedirectors are available to meet withmajor shareholders; in fact, thisis one of the specific roles of thesenior independent director.Institutional investorsWe are always keen to hear the viewsof and engage with our shareholdersand investors and we have an activeinvestor relations programme. Theactivities of the programme include:• the CEO and CFO have a regularschedule of meetings withrepresentatives from majorshareholders. This is supplementedwith meetings hosted by ourinvestor relations team. During theyear, the programme covered over100 institutions based in the UK,Europe, North America and AsiaPacific region;• the CEO and CFO undertakepresentations to groups ofinstitutional shareholders andinvestors, both on an ad hoc basisand linked to our half and full yearresults announcements;• the board receives regular feedbackon the views of its institutionalinvestors following on from the CEOand CFO’s meetings;• close contact is also maintainedbetween the investor relations teamand a range of City analysts thatresearch United Utilities; and• in total, we met or offered tomeet with 39 per cent by valueof the overall shareholder base,which represents 72 per centof the targetable institutionalshareholder base (when adjustingfor shareholders who do nottypically meet with companies, suchas indexed funds).In meetings with investors, frequentareas of common interest includeoperational and environmentalperformance, customer service, capitalinvestment, efficiency initiativesand regulatory outperformance.Investors are always keen to observefinancial stability, and investors areinterested in the level of gearingversus regulatory assumptions, costof finance, debt portfolio and maturityprofile, future financing requirementsand dividends. The outcome of theprice review, covering the <strong>2015</strong>–20period, was also a key area of interestfor them. Looking ahead, investorswill be keen to understand how thecompany is performing relative to theprice review allowances and targets.Retail shareholdersDespite the privatisation process beingover 25 years ago, we have retaineda large number of shareholders withregistered addresses in the North Westof England – in fact around 41 per cent.We have historically always held ourAGM in Manchester, which enables ourmore local shareholders to attend themeeting. These shareholders are alsoour customers.There is a considerable amountof information on our website,including our online <strong>report</strong> whichprovides information on our keysocial and environmental impacts andperformance during the year. Togetherwith the <strong>annual</strong> and half-yearly resultsannouncements, our <strong>annual</strong> <strong>report</strong> andfinancial statements are available onour website; these are the principalways in which we communicate with ourshareholders. Our company secretariatand investor relations teams, alongwith our registrar, Equiniti, are also onhand to help our retail shareholderswith any queries. Information forshareholders can also be found on theinside back cover of this document,with a number of useful websiteaddresses.Relations with other providersof capitalRunning a water and wastewaterbusiness, by its very nature, requiresa long-term outlook. Our regulatorycycle is based on five-year periods,and we raise associated funding inorder to build and improve our waterand wastewater treatment works andassociated network of pipes for eachfive-year cycle. We are heavily relianton successfully acquiring long-termfunding from banks and debt capitalmarkets to fund our capital investmentprogramme.This requires a long-term commitmentand involvement from our creditinvestors who lend us the funds withthe company paying them a return fordoing so. We arrange term debt financein the bond markets (with maturitiestypically ranging from seven years toup to 50 years at issue). Debt financeis raised via the group’s London listedmulti-issuer Euro Medium Term NoteProgramme, which gives us accessto the sterling and euro public bondmarkets. Committed credit facilitiesare arranged with various relationshipbanks on a bilateral basis. Additionally,the European Investment Bank (EIB),which is the financing arm of theEuropean Union, is our single biggestlender, currently providing circa £1.9billion of term funding (of which circa£1.5 billion has been advanced and£400 million remains available to drawdown) used to support our capitalinvestment programme. The groupcurrently has gross borrowings of£6,645 million.SHAREHOLDER INFORMATION FINANCIAL STATEMENTS GOVERNANCESTRATEGIC REPORT73
UNITED UTILITIES GROUP PLC ANNUAL REPORT AND FINANCIAL STATEMENTS <strong>2015</strong>Stock Code: UU.<strong>united</strong><strong>utilities</strong>.comCorporate governance <strong>report</strong>Given the importance of debt fundingto our group, we have an active creditinvestor programme coordinatedby our group treasury team, whichprovides a first point of contact forcredit investors’ queries and maintainsa dedicated area of the company’swebsite. One-to-one meetings areheld with credit investors througha programme aimed at the majorEuropean fund managers known toinvest in corporate bonds, that may beexisting holders of the group’s debt orpotential holders. Regular mailings ofcompany information are sent in orderto keep credit investors informed ofsignificant events. The treasury teamhas regular dialogue with the group’srelationship banks and the EIB. Moreinformation can be found on ourwebsite at corporate.<strong>united</strong><strong>utilities</strong>.com/93Code principle: AccountabilityBoard’s approach to riskmanagement and internal controlThe board is responsible for determiningthe nature and extent of the risks that itis willing to take to achieve its strategicobjectives. The board is also responsiblefor ensuring that the company’s riskmanagement and internal controlsystems are effectively managed acrossthe business and that they receive anappropriate level of scrutiny and boardtime.The group’s risks are predominantlythose of all regulated water andwastewater companies. One of themost significant is that of failing toachieve our regulatory performancetargets or failing to fulfil ourobligations in any five-year planningcycle, leading potentially to theimposition of fines and penalties.2014/15 has been an importantyear for the company in managingthis risk as this year we submittedour business plan to Ofwat for the<strong>2015</strong>–20 period. The board engagedfully with the process to ensure theplan’s robustness so that, havingreceived the final determination, weare confident that the business can bemanaged within the parameters of thedetermination for the next five-yearcycle.The board, following the review by theaudit committee, concluded that itwas appropriate to adopt the goingconcern basis of accounting. Similarly,and as will be required in futureyears in applying the principles of the2014 version of the UK CorporateGovernance Code (the 2014 Code),the board concluded, following arecommendation from the auditcommittee, that it was appropriate toprovide a long-term viability statement(both statements are set out on page75). Assurance supporting thesestatements was provided by the reviewof: the group’s key financial measures;the key credit financial ratios; thegroup’s liquidity and UUW’s ongoingability to meet its financial covenants;and the contingent liabilities of thegroup.As part of the assurance process,the board also took into account theprincipal risks and uncertainties facingthe company, and the actions taken tomitigate those risks. These principalrisks and uncertainties are detailedon pages 52 and 55, as are the riskmanagement processes and structuresused to monitor and manage them.Bi<strong>annual</strong>ly, the board receives a <strong>report</strong>detailing management’s assessmentof the most significant risks facingthe company. The <strong>report</strong> gives anindication of the level of exposure,subject to the mitigating controls inplace, for the risk profile of the group.The board also receives informationduring the year from the treasurycommittee (to which the board hasdelegated matters of a treasurynature – see the structure diagramon page 64) including such mattersas liquidity policy, the group’s capitalfunding requirements and interest ratemanagement.Review of the effectiveness ofthe risk management and internalcontrol systemsTaking into account the informationon principal risks and uncertaintiesprovided on pages 54 and 55, and theongoing work of the audit committeein monitoring the risk managementand internal control systems onbehalf of the board (and for whom thecommittee provides regular updates,see pages 80 and 81), the board:• is satisfied that it has carriedout a robust assessment of theprincipal risks facing the company,including those that wouldthreaten its business model, futureperformance, solvency or liquidity;and• has reviewed the effectiveness ofthe risk management and internalcontrol systems including allmaterial financial, operational andcompliance controls (including thoserelating to the financial <strong>report</strong>ingprocess) and no significant failingsor weaknesses were identified.In the review of theeffectiveness of riskmanagement and internalcontrols systems theboard also took intoaccount the:• bi<strong>annual</strong> review of significantrisks;• oversight of treasury matters;• reviewing and assessing theactivities of internal audit andthe external assessment of itsactivities;• reviewing management’sinternal control selfassessment;• reviewing <strong>report</strong>s from theGARB;• reviewing the outcome of<strong>annual</strong> business unit riskassessment process; and• reviewing the corporate riskmanagement framework.74
UNITED UTILITIES GROUP PLC ANNUAL REPORT AND FINANCIAL STATEMENTS <strong>2015</strong>Stock Code: UU.<strong>united</strong><strong>utilities</strong>.comGoing concern basis of accountingThe directors have a reasonableexpectation that the group hasadequate resources for a period ofat least 12 months from the date ofapproval of the financial statementsand have therefore assessed that thegoing concern basis of accounting isappropriate in preparing the financialstatements and that there are nomaterial uncertainties to disclose.This conclusion is based on a review ofthe resources available to the group,taking account of the group’s financialprojections together with availablecash and committed borrowingfacilities as well as considerationof the group’s capital adequacy,consideration of the primary legal dutyof UUW’s economic regulator to ensurethat water and wastewater companiescan finance their functions, and anymaterial uncertainties. In reaching thisconclusion, the board has consideredthe magnitude of potential impactsresulting from uncertain future eventsor changes in conditions, the likelihoodof their occurrence and the likelyeffectiveness of mitigating actionsthat the directors would considerundertaking.Long term viability statementThe directors have assessed theviability of the group over a five-yearperiod to March 2020, taking accountof the group’s current position andthe potential impact of the principalrisks documented in the strategic<strong>report</strong>. Based on this assessment,the directors have a reasonableexpectation that the company will beable to continue in operation and meetits liabilities as they fall due over theperiod to March 2020.In making this statement the directorshave considered the resilience of thegroup, taking account of its currentposition, the principal risks facingthe business in severe but reasonablescenarios, and the effectiveness of anymitigating actions. This assessmenthas considered the potential impactsof these risks on the business model,future performance, solvency andliquidity over the period.The directors have determined thatthe five-year period to March 2020is an appropriate period over whichto provide its viability statement. Inmaking their assessment, the directorshave taken account of the group’srobust capital solvency positionwith a debt to RCV ratio of around60 per cent, its ability to raise newfinance in most market conditions,its key potential mitigating action ofrestricting dividend payments andthe protections which exist under theregulatory model that a primary legalduty of UUW’s economic regulator isto ensure that water and wastewatercompanies can finance their functions.Code principle: RemunerationOur remuneration policy has beendesigned in order to promote thelong-term success of the company.Sara Weller’s <strong>report</strong> as chair of thecommittee can be found on pages 84to 103.SHAREHOLDER INFORMATION FINANCIAL STATEMENTS GOVERNANCESTRATEGIC REPORT75
UNITED UTILITIES GROUP PLC ANNUAL REPORT AND FINANCIAL STATEMENTS <strong>2015</strong>Stock Code: UU.<strong>united</strong><strong>utilities</strong>.comCorporate governance <strong>report</strong>Audit committeeAudit committeemembers• Brian May (chair)• Dr Catherine Bell• Stephen CarterRead biographies of the directorson pages 58 and 59Brian MayChair of the auditcommitteeQuick facts• Brian May has chaired thecommittee since July 2013. Heis a serving finance directorof a FTSE 100 company andchartered accountant and isconsidered by the board to haverecent and relevant financialexperience• Other regular attendees atmeetings include the Chairman,the CEO, the CFO, the companysecretary, the head of auditand risk, the group controller,and representatives from theexternal auditor KPMG LLP(KPMG)• KPMG and the head of auditand risk both have time with thecommittee to freely raise anyconcerns they may have withoutmanagement being present• The committee is authorisedto seek independent advice asit sees fit, but has not done soduring the yearQuick linksTerms of reference – corporate.<strong>united</strong><strong>utilities</strong>.com/corporategovernance*The Statutory Audit Services for Large CompaniesMarket Investigation (Mandatory Use of CompetitiveTender Processes and Audit Committee Responsibilities)Order 2014.Dear shareholder,It has been another year of evolution forthe work of audit committees, with thepublication by the FRC of the 2014 versionof the Code and the publication by theCompetition and Markets Authority of theStatutory Audit Services Order 2014*.At the request of the board, the auditcommittee (‘the committee’) has consideredthe new requirements.We are not required to <strong>report</strong> against the2014 Code until our next financial year.However, we decided that it was appropriatefor the board to provide the long-termviability statement (see page 75) applyingthe principles of the 2014 Code, given thelong-term nature of our business. For the<strong>2015</strong>/16 financial year the committee’sterms of reference have been amendedto reflect the 2014 Code requirements,and we are committed to ensuring thatthe committee’s agenda is kept underreview and keeps abreast of relevantdevelopments.There have been a number of changesduring the year to the membership ofthe committee. As planned, Nick Salmonstood down at the AGM in July 2014 andStephen Carter joined the board and thecommittee on 1 September 2014. I ampleased to welcome Stephen as a memberof the committee, his views and previousexperience will add considerable breadthof knowledge to the committee. On Nickleaving, Mark Clare replaced him on theremuneration committee, stepping downfrom the audit committee on 1 September2014. Although Mark’s time on thecommittee was relatively short, I would liketo thank him for his valuable contribution.Although audit committees have specificresponsibilities rooted in reviewing thegroup’s financial statements and reviewingthe internal assurance work and externalaudit of those financial statements, thecommittee also reviews the internalcontrol and risk management processes,leaving the review of the significant risksto be undertaken by the board. A lot ofthe work of the committee is necessarilytargeted at the regulated activities ofUUW, which represents over 98 per cent ofgroup revenues. This is a reflection of ourcommitment to safeguarding the interestsof our customers; all the members of thecommittee are also independent nonexecutivedirectors of UUW. Details of thecommittee’s activities over the past year areset out on the opposite page.We have again worked to enhance this<strong>report</strong> and make it more informative for thereader and we continue to be committedto providing meaningful disclosure of thecommittee’s activities.The following <strong>report</strong> was approved by thecommittee at its meeting held on 14 May<strong>2015</strong>.Brian MayChair of the audit committeeThe committee’s agenda is keptunder review and keeps abreastwith relevant developments76
UNITED UTILITIES GROUP PLC ANNUAL REPORT AND FINANCIAL STATEMENTS <strong>2015</strong>Stock Code: UU.<strong>united</strong><strong>utilities</strong>.comMain responsibilitiesof the committeeThe main responsibilities of thecommittee are:• to make a recommendation tothe board for the appointmentor reappointment of the auditor,and to be responsible for thetender of the audit from time totime and to agree the fees paidto the auditor;• to establish policies for theprovision of any non-auditservices by the auditor;• to review the scope and theresults of the <strong>annual</strong> auditand <strong>report</strong> to the board onthe effectiveness of theaudit process and how theindependence and objectivityof the auditor has beensafeguarded;• to review the half-year and<strong>annual</strong> financial statements andany announcements relating tofinancial performance, including<strong>report</strong>ing to the board on thesignificant issues considered bythe committee in relation to thefinancial statements and howthese were addressed;• to review the scope, remit andeffectiveness of the internalaudit function and the group’sinternal control and riskmanagement systems;• to review the group’sprocedures for whistleblowing,<strong>report</strong>ing fraud and otherinappropriate behaviour and toreceive <strong>report</strong>s relating thereto;and• to <strong>report</strong> to the board onhow it has discharged itsresponsibilities.What has been on the committee’sagenda during the yearIn addition to fulfilling its ongoingduties, the committee has an extensiveagenda of items addressing issuesrelating to the day-to-day activitiesof the business which it deals with inconjunction with senior management,the auditor, the internal audit functionand the financial <strong>report</strong>ing team. Therewere four scheduled meetings of thecommittee during the year. Items onthe agenda included:• considering the issues and findingsbrought to the committee’sattention by the internal auditteam and satisfying itself thatmanagement has resolved or isin the process of resolving anyoutstanding issues or concerns;• reviewing the assurance workundertaken by internal audit relatingto: the content of the regulatorybusiness plan and the processessupporting the preparation of theplan; and the <strong>annual</strong> regulatory<strong>report</strong>s;• reviewing the <strong>report</strong>s from thefinancial <strong>report</strong>ing team on thefinancial statements, including theUUW financial statements and otherregulatory <strong>report</strong>s, and consideringmatters such as the accountingjudgements and policies beingapplied;• reviewing the audit <strong>report</strong>s fromKPMG on the financial statementsand tasking management to resolveany issues relating to internal controlsand risk management systems;• reviewing the going concernand longer term viabilityassessments prior to making itsrecommendations to the board;• <strong>annual</strong> review and approval ofthe policy on non-audit servicesprovided by the auditor includingthe continued use during 2014/15of Makinson Cowell (now owned byKPMG);• monitoring incidents ofwhistleblowing and fraud <strong>report</strong>ing;• bi<strong>annual</strong> oversight and monitoringof the group’s compliance with theBribery Act which the board reviews<strong>annual</strong>ly;• overseeing and approving thestrategic internal audit planningapproach;• an externally facilitated review ofthe quality and effectiveness ofinternal audit; and• reviewing the committee’s termsof reference and the conclusions ofthe committee’s <strong>annual</strong> evaluation.The externally facilitated evaluationwas undertaken as part of theoverall board evaluation (see page66). The review explored: timemanagement and the compositionof the committee; the committee’sprocesses and support; and theagenda and work of the committee.It was concluded that the committeewas effective.How we assessed whether ‘the<strong>annual</strong> <strong>report</strong> and accounts, takenas a whole, is fair, balanced andunderstandable and providesthe information necessaryfor shareholders to assessthe company’s position andperformance, business model andstrategy’The committee, further to the board’srequest, has reviewed the <strong>annual</strong><strong>report</strong> and financial statements withthe intention of providing advice tothe board on whether, as requiredby the Code, ‘the <strong>annual</strong> <strong>report</strong> andaccounts, taken as a whole, is fair,balanced and understandable andprovides the information necessary forshareholders to assess the company’sposition and performance, businessmodel and strategy’.To make this assessment, all membersof the committee received copiesof the <strong>annual</strong> <strong>report</strong> and financialstatements to review early in thedrafting process to ensure that thekey messages being followed in the<strong>annual</strong> <strong>report</strong> were aligned with thecompany’s position, performanceand strategy being pursued; and thatthe narrative sections of the <strong>annual</strong><strong>report</strong> were consistent with thefinancial statements. The significantissues considered by the committeein relation to the financial statementswere consistent with those identifiedby the external auditor in their <strong>report</strong>on pages 114 to 117.SHAREHOLDER INFORMATION FINANCIAL STATEMENTS GOVERNANCESTRATEGIC REPORT77
UNITED UTILITIES GROUP PLC ANNUAL REPORT AND FINANCIAL STATEMENTS <strong>2015</strong>Stock Code: UU.<strong>united</strong><strong>utilities</strong>.comCorporate governance <strong>report</strong>Audit committeeThe presentation of the company’sbusiness model (on pages 14 to 19)has been reformatted to make itmore understandable for the readerand there are clear linkages to thecompany’s strategic objectivesthroughout the document.The committee concluded that the keyperformance indicators (KPIs) includedin the strategic <strong>report</strong> (see pages32 and 33) were, amongst others,those used by management and, forconsistency and comparative purposes,should be retained unamended (otherthan to reflect regulatory <strong>report</strong>ingchanges) up until the 31 March <strong>2015</strong>financial year-end. As is describedon page 51 of the strategic <strong>report</strong>,management have refined the KPIsused for <strong>2015</strong>–20 reflecting the newmeasures to be monitored by Ofwatduring that period.In addition, the committee wassatisfied that all the key events andissues which had been <strong>report</strong>ed tothe board in the CEO’s monthly <strong>report</strong>during the year, both good and bad,had been adequately referenced orreflected within the <strong>annual</strong> <strong>report</strong>.How we assessed the effectivenessof the external audit processThe committee, on behalf of the board,is responsible for the relationship withthe external auditor, and part of thatrole is to examine the effectiveness ofthe audit process.Audit quality is a key requirement.Prior to the statutory audit at the halfyear,KPMG presented the strategyand scope of the audit for the financialyear, highlighting any areas requiringspecial consideration. KPMG then<strong>report</strong>ed against this audit scope atsubsequent committee meetings.On completion of the audit at the fullyear,all members of the committee,as well as key members of the seniormanagement team, were required tocomplete a questionnaire seeking theirviews on how well KPMG performedthe year-end audit. The views of therespondents was sought in respect of:the robustness of the audit process;the quality of the delivery of theaudit; the expertise of the audit teamconducting the audit and that thedegree of professional scepticismapplied by the auditor was appropriate;the quality of the service they gave;and their views on the quality ofthe interaction between the auditpartner and audit manager and thecompany. The feedback was collatedand presented to the committee’smeeting in November 2014, at whichthe conclusions were discussed andany opportunities for improvementbrought to the attention of theexternal auditor.Private meetings are held at eachcommittee meeting between the auditcommittee and the representativesof the external auditor withoutmanagement being present in orderto encourage open and transparentfeedback by both parties. Thecommittee was satisfied that theoverall external audit process andservices provided by KPMG wereeffective.How we assessed theindependence of our externalauditorThere are two aspects to the auditorindependence test that the committeemonitors.First, in accordance with the AuditingPractices Board Ethical Standards,KPMG has to implement rules andrequirements such that none of itsemployees working on our audit canhold any shares in United UtilitiesGroup PLC. KPMG is also requiredto tell us about any significant factsand matters that may reasonably bethought to bear on its independence oron the objectivity of the lead partnerand the audit team. The lead partnermust change every five years and thequality review partner, who reviews thejudgements of the audit team actuallydoing the audit, rotates every sevenyears along with the key audit partner.Secondly, the committee considersand approves all the fees that itpays for audit, audit-related andnon-audit services from KPMG.KPMG is prohibited from providingcertain services to the group, suchas operational consulting, internalaudit services and strategic planningsupport, as it is felt that thesetypes of services could impede theirindependence. Furthermore, auditorindependence is also safeguardedby limiting the value of non-auditservices performed by the externalauditor which should not ordinarilyexceed 100 per cent of the auditfee. The committee has discretion inexceptional circumstances or wherea compelling commercial justificationcan be provided for this cap on nonauditfees to be exceeded. The CFO canpre-approve expenditure in respectof non-audit services, such as taxcompliance work of up to £100,000 (aswas the figure for the year ended 31March <strong>2015</strong>) thereafter, any fees fornon-audit services up to 100 per centof the audit fee cap can be approved bythe committee chair. Any such fees arereviewed and, if appropriate, ratifiedby the committee.For a number of years, the grouphas engaged the consultancy firmMakinson Cowell to provide it withinvestment research and advice. As<strong>report</strong>ed in the 31 March 2014 <strong>annual</strong><strong>report</strong>, Makinson Cowell was acquiredby KPMG in June 2013, therefore thefees paid to Makinson Cowell areincluded in the total of ‘other non-auditservices’ paid to KPMG (see the barchart on page 79). As part of the <strong>annual</strong>review by the committee of the nonauditservices policy the engagementof Makinson Cowell was considered.The committee took into account theboard’s satisfaction with the servicesprovided by Makinson Cowell andconcluded that it was appropriate fortheir services to be retained for theyear ended 31 March <strong>2015</strong>.As part of UUW’s licence conditionsit is required to prepare auditedregulatory accounts, which arederived from the statutory financialstatements. Given the audit of thestatutory financial statements isalready undertaken by KPMG, there areefficiencies and cost savings if KPMGalso audits the regulatory accounts.Fees paid to KPMG also include auditrelated services in relation to UUWregulatory assurance work as shown inthe bar chart opposite.78
UNITED UTILITIES GROUP PLC ANNUAL REPORT AND FINANCIAL STATEMENTS <strong>2015</strong>Stock Code: UU.<strong>united</strong><strong>utilities</strong>.comTaking into account our findings inrelation to the effectiveness of theaudit process and in relation to theindependence of KPMG, the committeewas satisfied that KPMG continuesto be independent, and free fromany conflicting interest with thegroup. As a result, the committeerecommended to the board that KPMGbe proposed for reappointment at theforthcoming AGM in July <strong>2015</strong>. Thereare no contractual obligations thatrestrict the committee’s choice ofexternal auditor and no auditor liabilityagreement has been entered into.Audit tenderThe external audit was lastcompetitively tendered in March2011 when KPMG was appointed andcompleted the audit for the year ended31 March 2012. The committee hasconsidered the final Statutory AuditServices Order 2014 published by theCompetition and Markets Authoritywhich came into effect on1 January <strong>2015</strong>. The committee’s termsof reference already provided for thecompetitive tender of the externalaudit contract every 10 years, and forthe committee to be responsible foroverseeing the tender process andagreeing the scope of the audit, butthey have been amended to reflect thatthe committee shall be responsiblefor agreeing the audit fee and theFees paid to KPMG3002502001501005003820730458439216appointment of the audit engagementpartner. Terms of reference can befound at corporate.<strong>united</strong><strong>utilities</strong>.com/corporate-governance.The committee is also mindful of theEU Audit Directive and Regulation ofthe Audit of Public Interest Entitieson which the FRC has issued aconsultation, the outcome of whichwas awaited at the time of writing this<strong>report</strong>.Significant issues considered bythe committee in relation to thefinancial statements and howthese were addressedIn relation to the group’s financialstatements, the committee reviewedthe following principal areas ofjudgement (as noted in theaccounting policies):Capitalisation of fixed assetsFixed assets represent a subjectivearea, particularly in relation to costspermitted for capitalisation anddepreciation policy.• The committee considered thecapital overhead rate whichmanagement proposed to applyfor the next five-year regulatoryperiod. The capital overhead ratehistorically has been established atthe commencement of each five-yearregulatory period and is applied as a2013 2014 <strong>2015</strong>Statutory audit – group and companyStatutory audit – subsidiariesRegulatory <strong>report</strong>ing and assurance304520343Audit related servicesOther non-audit services2913030250percentage of capital expenditure tocharge certain capital overhead coststo capital projects. Managementexplained the basis upon which theproposed capital overhead rate forthe next five-year regulatory periodhad been determined and why it wasconsidered an appropriate rate toadopt.The committee challengedmanagement over the factors whichhad been considered in determiningthe rate and its consistency againstrates applied previously. In addition,the committee considered theviews of KPMG, particularly thatthe proposed capital overhead ratewas within the range used by otherutility companies of which they wereaware. The committee concludedthat management had takenappropriate steps in determiningthe future rate to be applied.• The committee requested thatmanagement provide it with anupdate on the implementationof a new reactive work orderscheduling and settlement systemand specifically the realisation ofthe financial <strong>report</strong>ing benefits thesystem would bring in automatingthe process and enhancing costallocation accuracy. Management<strong>report</strong>ed to the committee that inMay 2014 functional changes hadbeen successfully implemented. Thecommittee noted the improvementsresulting from the new system.Revenue recognition and allowancefor doubtful receivablesDue to the nature of the group’sbusiness, the extent to which revenueis recognised and doubtful customerdebts are provided against is anarea of considerable judgement andestimation.• The committee considered theappropriateness of the existingrevenue recognition policy whichderecognises revenue for certaincustomers who have not paid theirbills within a particular period oftime. After reviewing cash collectionhistory and practice, the committeeconcluded the revenue recognitionpolicy was appropriate.SHAREHOLDER INFORMATION FINANCIAL STATEMENTS GOVERNANCESTRATEGIC REPORT79
UNITED UTILITIES GROUP PLC ANNUAL REPORT AND FINANCIAL STATEMENTS <strong>2015</strong>Stock Code: UU.<strong>united</strong><strong>utilities</strong>.comCorporate governance <strong>report</strong>Audit committee• The committee also questioned thecurrent levels of doubtful debt andcredit note provisioning (see note15 for more detail). The committeechallenged management over theadequacy of the overall levels ofprovisioning following these reviewsand were satisfied that the resultingnet debtor balance was appropriate.Provisions and contingenciesThe group makes provisions forcontractual and legal claims whichby their nature are subjective andrequire management to arrive at a bestestimate as to the probable outcomesand costs associated with eachindividual case.• The committee received regularupdates on new and existing claimsbeing made against the groupand the extent to which thesehave been provided for (see note20 for details). The committeefocused their attention on the moresignificant items and discussed thejudgements made by management inarriving at appropriate provisions inrelation to these matters.• Based on the facts behind eachprovision and taking account ofany relevant legal advice that mayhave been received as well as thepast experience of managementin making such provisions andchallenging where necessary theviews taken by management andthrough the assurance providedby KPMG who cover these as partof their audit, the committeeconcluded that the provisionsmanagement had made wereappropriate.Retirement benefit obligationsThe group’s defined benefit retirementschemes are an area of considerablejudgement and the performance andposition of which is sensitive to theassumptions made.• The committee sought frommanagement an understandingas to the factors which led to thesignificant improvement in theIAS19 net retirement benefitposition during the period and notedthat the scheme-specific fundingbasis had not been impacted by thisvolatility. Management presentedan explanatory note (see page154) in order to communicatemost effectively what is a complexarea for the benefit of the group’sstakeholders. The committee wassatisfied with the explanationsprovided by managementand following a review of theexplanatory note approved itsinclusion in the financial statements.• The committee reviewed themethodology and assumptionsused in calculating the definedbenefit scheme positions (seenote A4 for more details). Thecommittee employs the servicesof an external actuary to performthese calculations and determinethe appropriate assumptionsto make. The external actuaryprepared a <strong>report</strong> showing how theassumptions applied comparedto their client base and this wassummarised for the committee’sinformation. In addition, KPMGaudit these assumptions andprovide their own <strong>report</strong> showinghow the assumptions appliedcompare against other companies.After considering the above, thecommittee concluded that theapproach taken and assumptionsmade were appropriate and fairlybalanced in determining the netretirement benefit surplus.Derivative financial instrumentsThe group has a significant valueof swap instruments, the valuationof which is based upon modelswhich require certain judgementsand assumptions to be made. Thecommittee requires management toperform periodic checks to ensure thatthe model derived valuations agreeback to third party valuations and thatKPMG check a sample against theirown valuation models. It was confirmedto the committee that such testinghad been undertaken during the yearand there were no significant issuesidentified.TaxationThe committee considered the taxrisks that the group faces and the keyjudgements made by managementunderpinning the provisions forpotential tax liabilities and deferredtax assets. In addition, the committeetook account of KPMG’s assessment ofthese provisions. Based on the above,the committee was satisfied with thejudgements made by management.The main features of thegroup’s internal controls andrisk management systems aresummarised below:a. Internal audit functionThe internal audit function is a keyelement of the group’s corporategovernance framework. Its role is toprovide independent and objectiveassurance advice and insight ongovernance, risk management andinternal control to the audit committee,the board and to senior management.It supports the organisation’s visionand objectives by evaluating andassessing the effectiveness of riskmanagement systems, businessprocesses and internal controls.In addition to reviewing theeffectiveness of these areas and<strong>report</strong>ing on aspects of the group’scompliance with them, internal auditmakes recommendations to addressany key issues and improve processes.Once any recommendations are agreedwith management, it monitors theirimplementation and <strong>report</strong>s to thecommittee on progress made at everymeeting.A five-year strategic audit planningapproach has been developedand adopted during the year. Thisfacilitates a more efficient deploymentof internal audit resource in providingassurance coverage over time acrossthe whole business. Following approvalby the audit committee, this strategicapproach supports the <strong>annual</strong> auditplan, which is then endorsed bymanagement, and which the committeealso approves. The plan focuses theteam’s work on those areas of greatestrisk to the business. Building on thestrategic planning approach, the80
UNITED UTILITIES GROUP PLC ANNUAL REPORT AND FINANCIAL STATEMENTS <strong>2015</strong>Stock Code: UU.<strong>united</strong><strong>utilities</strong>.comdevelopment of the plan considersrisk assessments, issues raised bymanagement, prior audit findingsand a cyclical review programme.The in-house team is expanded asand when required with additionalresource sourced from externalproviders – primarily PwC at present.The committee keeps the relationshipwith PwC under review to ensure theindependence of the internal auditfunction is maintained. In the courseof its work, the internal audit functionalso liaises with the statutory auditor,discussing relevant aspects of theirrespective activities which ultimatelysupports the assurance provided to theaudit committee and board.The effectiveness of the internalaudit function’s work is continuallymonitored using a variety of inputsincluding the ongoing audit <strong>report</strong>sreceived, the audit committee’sinteraction with the head of auditand risk, an <strong>annual</strong> review of thedepartment’s internal qualityassurance <strong>report</strong>, <strong>annual</strong> stakeholdersurveys in which committee membersalso participate as well as any otherperiodic quality <strong>report</strong>ing requested.In addition, during <strong>2015</strong>, the qualityand effectiveness of the internal auditfunction was externally assessed.Following this assessment, thecommittee concluded that the internalaudit function was effective andappropriate resources available asrequired.Internal audit, led by the head ofaudit and risk, covers the whole of thegroup’s activities and <strong>report</strong>s to thecommittee and functionally to the CFO.The head of audit and risk attendsall scheduled meetings of the auditcommittee, and has the opportunity toraise any matters with the membersof the committee at these meetingswithout the presence of management.He is also in regular contact with thechair of the committee outside of thecommittee meetings.b. Risk management systemsThe committee receives updatesand <strong>report</strong>s from the head of auditand risk on activities relating to thecompany’s risk management systemsand processes at every meeting. Theseare then <strong>report</strong>ed to the board, asappropriate. The group designs itsrisk management activities in orderto manage rather than eliminate therisk of failure to achieve its strategicobjectives.The CFO has executive responsibilityfor risk management and is supportedin this role by the head of audit andrisk and the corporate risk managerand his team. The group audit and riskboard (GARB) is a sub-committee ofthe executive team. The GARB meetsquarterly and reviews the governanceprocesses and the effectiveness andperformance of these processes alongwith the identification of emergingtrends and themes within and acrossthe business. The work of the GARBthen feeds into the information andassurance processes of the auditcommittee and into the board’sassessment of risk exposures and thestrategies to manage these risks.The <strong>annual</strong> business unit riskassessment process (BURA) seeks toidentify how well risk management isembedded across the different teamsin the business. The BURA involvesa review of the effectiveness of thecontrols that each business unit hasin place to mitigate risks relating toactivities in their area of the business,to encourage the identification of newand emerging risks and generally tofacilitate improvements in the wayrisks are managed. The outcome ofthe BURA process is communicatedto the executive team and the board.This then forms the basis of thedetermination of the most significantrisks that the company faces which arethen reviewed by the board. During theyear, new risk management softwarewas developed and is in the process ofimplementation across the businesswith a view to enhancing the company’srisk management process.A five-year strategicaudit planning approachhas been developed andadopted to facilitatea more efficientdeployment of internalaudit resource inproviding assurance.c. Internal controlsThe committee reviews the group’sinternal control systems and receivesupdates on the findings of internalaudit’s investigations at every meeting,prior to <strong>report</strong>ing any significantmatters to the board. Internal controlsystems are part of our ‘business asusual’ activities and are documented inthe company’s internal control manualwhich covers financial, operational andcompliance controls and processes.Internal control systems are theresponsibility of the CFO, with thesupport of the GARB, the internal auditteam and the financial control team,although the head of audit and risk andhis team are directly accountable tothe audit committee.Confirmation that the controlsand processes are being adheredto throughout the business is theresponsibility of managers, but iscontinually tested by the work of theinternal audit team as part of its <strong>annual</strong>plan of work which the committeeapproves each year. Compliancewith the internal control system isconfirmed <strong>annual</strong>ly by the completionof a self-assessment checklist bysenior managers in consultation withtheir teams. The results are thenreviewed and audited by the internalaudit team and <strong>report</strong>ed to thecommittee.SHAREHOLDER INFORMATION FINANCIAL STATEMENTS GOVERNANCESTRATEGIC REPORT81
UNITED UTILITIES GROUP PLC ANNUAL REPORT AND FINANCIAL STATEMENTS <strong>2015</strong>Stock Code: UU.<strong>united</strong><strong>utilities</strong>.comCorporate governance <strong>report</strong>Corporate responsibility committeeCorporate responsibilitycommittee members• Dr Catherine Bell (chair)• Stephen Carter• Steve MogfordRead biographies of the directorson pages 58 and 59Dr Catherine BellChair of the corporateresponsibility committeeDear shareholder,I am pleased to <strong>report</strong> on the work ofthe corporate responsibility committee(CRC) over the past 12 months.There have been a number of changesduring the year to the membership ofthe committee. As planned, Nick Salmonstood down at the AGM in July 2014 andStephen Carter joined the board andthe committee on 1 September 2014.I am pleased to welcome Stephen as amember of the committee. His viewsand previous experience on corporateresponsibility issues in other businesseshave added valuable perspective to thework of the committee.The committee examined progressmade by the company in delivering itsobjectives to provide the best serviceto customers, at the lowest sustainablecost and in a responsible manner. Actingresponsibly helps us to be a successfullong-term business for shareholders andcustomers.We measure ourselves againstnational and international benchmarks,independently and externally assessed.We were delighted to retain ‘World Class’status in the Dow Jones SustainabilityIndex for the seventh consecutive yearand, for the first time, we became theleader in the multi-utility and watersector. Given our long-term stewardshiprole in managing water and wastewater,we also assess our effectivenessin the management of the risks andopportunities linked to climate change.In 2014, we achieved our best everresult in the Carbon Disclosure Projectin which over 90 per cent of the FTSE100 participate to describe theirapproach to climate change; we are nowmembers of their Disclosure LeadershipIndex. And very recently we securedthe Carbon Trust Water Standard forour efforts to reduce water use in WestCumbria.In addition to these externalbenchmarks, last year the boardapproved the development andpublication of a detailed corporateresponsibility (CR) performancescorecard, to give greater transparencyto responsible business performancefor those working in the companyand for external stakeholders.Performance against the CR scorecardwas <strong>report</strong>ed in the United Utilities2014 corporate responsibility<strong>report</strong>: corporateresponsibility2014.<strong>united</strong><strong>utilities</strong>.com. This showedstrong performance on most of themeasures. As we begin the next fiveyearinvestment period, this year theCRC will reset the responsible businessmeasures and targets out to 2020,Quick facts• The committee comprises threedirectors appointed by the board,two of whom are independent nonexecutivedirectors• The company secretary attends allmeetings of the committee• The finance director; thecorporate affairs director, whohas responsibility for companyreputation; and the businessservices director, who hasresponsibility for human resources,regularly attend meetingsrecognising the importance of settingtargets for the long term. One particulararea for sustained scrutiny throughthe corporate responsibility lenswill be the impact of the company’sinvestment programme on customerneeds and environmental goals. Furtherprogress on our corporate responsibilityprogramme will be <strong>report</strong>ed periodicallyon our website.The CRC also looked closely at howacting responsibly impacts the waystakeholders, including customers, seethe company. We concluded that our CRprogramme is important in sustainingthe reputation of the company and helpsbuild trust and confidence over the longterm. As we begin the next five-yearinvestment period, the CRC will continueto examine the relevance and value ofour CR programme to United Utilities,its customers and shareholders.Dr Catherine BellChair of the corporate responsibilitycommittee• Senior operational managersattend the committee to <strong>report</strong>on the environmental and socialimpact of major investmentprogrammes and projects• The corporate responsibilitycommittee has existed for overseven yearsQuick linksTerms of reference –corporate.<strong>united</strong><strong>utilities</strong>.com/corporate-governance82
UNITED UTILITIES GROUP PLC ANNUAL REPORT AND FINANCIAL STATEMENTS <strong>2015</strong>Stock Code: UU.<strong>united</strong><strong>utilities</strong>.comMain responsibilities ofthe committeeThe board approved a slightlymodified set of terms of reference(ToR) for the CRC in April <strong>2015</strong>. Themain duties are to:• consider and recommend to theboard the broad CR policy takinginto account the company’sdesired CR positioning;• keep under review the group’sapproach to CR and ensure itis in alignment with the groupstrategy;• review CR issues and objectivesmaterial to the group’sstakeholders and identify andmonitor the extent to which theyare reflected in group strategies,plans and policies;• monitor and review compliancewith the board’s CR policy andscrutinise the effectiveness ofthe delivery of the CR policyrequirements;• develop and recommend tothe board CR targets and keyperformance indicators andreceive and review <strong>report</strong>son progress towards theachievement of such targets andindicators;• review all approved specificgiving where the aggregatefinancial contribution exceeds£100,000 over the period of theproposed funding and to reviewall community giving expenditure<strong>annual</strong>ly; and• review the profile of thecharitable donations directed bythe United Utilities Trust Fund.One of the small changes to theCRC ToR approved by the boardrelated to approval of the company’sCR <strong>report</strong>. This has been changedfrom production of an <strong>annual</strong><strong>report</strong> to a yearly performancestatement, supported by year-roundregular <strong>report</strong>ing of the company’sresponsible business activities inenhanced CR pages on the UnitedUtilities website.What has been on the committee’sagenda during the yearIn carrying out its duties, in the past12 months the CRC has paid particularattention to the following:• governance – the flow ofinformation to the board wasfurther improved through specific<strong>report</strong>s on responsible businessperformance provided quarterly bythe CEO to the board;• measuring and <strong>report</strong>ing CRperformance – the CRC approvedthe publication of a comprehensiveupdate on how well we aremeeting our responsible businesscommitments in the 2014 CR<strong>annual</strong> <strong>report</strong>. The committee notedstrengthening performance on themajority of measures in the CRscorecard;• trust and reputation – how thecompany is addressing thechallenges of governance, trust andtransparency. The company’s keyreputation indicators for brand andmedia were discussed and goodprogress was noted; and• preparing for the <strong>2015</strong>-20 period– the committee discussed howthe CR agenda and United Utilities’strategic intentions for the next fiveyears should be aligned.Specific topics included:• CR benchmarks – the committeereviewed the challenge and value ofexternal CR benchmarking indicesas a measure of United Utilities’responsible business performance;• delivering sustainability benefitsthrough investment and efficiencyprogrammes – the CRC consideredhow the company’s investment intransforming its wholesale businessactivities will bring customer andenvironmental benefits, whilst atthe same time reducing operationalcost;• affordability – given the impact ofcontinuing challenging economicconditions in the North West, theCRC examined what this means fordebt, affordability and the paymentassistance schemes offered by thecompany;• retail competition – the CRC lookedat building trust with businesscustomers, and how the UnitedUtilities’ brand, underpinned bystrong CR credentials, is helpingdeliver value in the competitivemarket; and• trends in corporate <strong>report</strong>ing – theCRC supported the recommendationthat the <strong>2015</strong> <strong>annual</strong> <strong>report</strong>should present the CR themes ina way which is integrated with thecompany’s strategic aims.Looking to the next year, as the waterindustry begins its next five-yearinvestment programme, the CRC will:• agree the responsible businessmeasures and targets set out to2020, aligned with the group’s<strong>2015</strong>–20 business plan;• review a number of key CRstrategies including:——carbon reduction and wastestrategy;——debt and affordability;——talent and young people;——diversity and inclusion; and——how community spend istargeted.• continue its focus on the interactionbetween CR, communications andreputation.SHAREHOLDER INFORMATION FINANCIAL STATEMENTS GOVERNANCESTRATEGIC REPORT83
UNITED UTILITIES GROUP PLC ANNUAL REPORT AND FINANCIAL STATEMENTS <strong>2015</strong>Stock Code: UU.<strong>united</strong><strong>utilities</strong>.comCorporate governance <strong>report</strong>Annual statement from the remuneration committee chairRemuneration committeemembers• Sara Weller (chair)• Dr Catherine Bell• Mark ClareRead biographies of the directorson pages 58 and 59Sara WellerChair of the remunerationcommitteeQuick facts• The Code requires that ‘theboard should establish aremuneration committee of atleast three independent nonexecutivedirectors’• The role of the committee isto set remuneration terms forall executive directors, othersenior executives and theChairman• By invitation of the committee,meetings are also attendedby the Chairman, the CEO,the company secretary, thebusiness services director, thehead of reward and the externaladvisor to the committeeQuick linksTerms of reference -corporate.<strong>united</strong><strong>utilities</strong>.com/corporate-governanceDirectors’ remuneration policy –<strong>annual</strong><strong>report</strong>2014.<strong>united</strong><strong>utilities</strong>.com/site-essentials/downloads/<strong>annual</strong>-<strong>report</strong>-2014IndexPage no.At a glance summary 85Aligning remunerationto business strategy 86Directors’ remunerationpolicy (abridged) 87Annual <strong>report</strong> onremuneration 92Dear shareholder,I am pleased to introduce the directors’remuneration <strong>report</strong> for the yearended 31 March <strong>2015</strong>, which includesmy statement, an abridged versionof the directors’ remuneration policywhich took effect from the date of our2014 AGM, and the <strong>annual</strong> <strong>report</strong> onremuneration for the year ended31 March <strong>2015</strong>.A successful five-year regulatoryperiod from 2010–15 has beenreflected both in total shareholderreturn (TSR) of around 115 per centand in executive pay outcomes. Overthis period the company has deliveredits regulatory outperformancetargets alongside significant progressin operational performance and astep change in customer service(reducing customer complaintsby approximately 75 per cent andbeing the most improved water andwastewater company as measuredunder Ofwat’s three-year serviceincentive mechanism (SIM) assessmentfrom 2011/12 to 2013/14). At thesame time, customers have benefitedfrom below inflation growth in averagehousehold bills.As we enter a new regulatory period,the committee is committed tocontinuing to align executive pay withthe company’s strategy of deliveringvalue by providing the best service tocustomers, at the lowest sustainablecost and in a responsible manner. Weseek to achieve this by strongly linkingpay with performance, at both anindividual and company level, and byencouraging a significant investmentin company shares. We also recognisethat a long-term focus is essential tocreating value and therefore requireexecutives to defer a significantproportion of their incentives.A successful five-yearregulatory period from 2010–15 has been reflected bothin total shareholder return ofaround 115 per cent, and inexecutive pay outcomes84
UNITED UTILITIES GROUP PLC ANNUAL REPORT AND FINANCIAL STATEMENTS <strong>2015</strong>Stock Code: UU.<strong>united</strong><strong>utilities</strong>.comStrong alignment of performanceand pay in 2014/15During the year, performance was strongoverall with underlying operating profitgrowing by five per cent, continuedimprovement in customer serviceand successful delivery of the capitalinvestment programme. The company’sasset serviceability performance hasalso been good and we were pleased thatthe company retained its ‘World Class’status in the Dow Jones SustainabilityIndex for the seventh successive year.The company did not, however, meetits bad debt recovery targets with debtcollection continuing to be challenging,particularly as our region suffers fromhigh levels of income deprivation.This level of financial and operationalperformance, together with theachievement of a number of stretchingpersonal objectives, has resulted inbonus payments of around 77 per centof maximum for the executive directors.As the same bonus measures are usedthroughout the company, employees atall levels have also benefited from thissuccess, receiving bonuses totalling£15 million for the year.The long-term incentive awards whichwere granted in 2012, and whoseperformance was measured over thethree years to 31 March <strong>2015</strong>, vestedat 97.5 per cent. This followed a periodof strong share price growth which,together with the dividend policy togrow dividends each year by RPI plus twoper cent, resulted in a total shareholderreturn of around 80 per cent over thethree years. The company also deliveredexcellent results against its operationaland capital expenditure targets over thesame period.Key changes for <strong>2015</strong>/16In accordance with our continuedconservative approach to overallAt a glance summary: Executive directors’ remuneration• Salary increase of 2.5 per cent from1 September 2014 in line with thewider workforce (see page 93)• 2014/15 <strong>annual</strong> bonus outcome of77.4 per cent of maximum (see page93)• 50 per cent of 2014/15 <strong>annual</strong>bonus deferred in shares for threeyears (see page 93)remuneration, there will be no changesto the quantum of incentive plans for<strong>2015</strong>/16, nor to the structure of theLong Term Plan (LTP), last reviewed in2013, and it is expected that executivesalary increases will continue to be inline with those applied across the widerworkforce.Following the company’s acceptancein January <strong>2015</strong> of Ofwat’s finaldetermination for <strong>2015</strong>–20, thecommittee reviewed the <strong>annual</strong> bonusmeasures to ensure that they fullyincentivise delivery of our businessstrategy and <strong>annual</strong> plan, and reflect theimportance and challenge of regulatorycommitments for the next regulatoryperiod. These new bonus measures willapply not only to the executive directors,but also to all managers and employeesthroughout the company, to ensurealignment to delivery of the businessplan at all levels.The changes to the bonus measuresare:• the introduction of a measurebased on newly introduced outcomedelivery incentives (ODIs, see page86);• changes to the time, cost and quality(TCQi) measure, which measures theextent to which we deliver our capitalprojects on time, to budget and tothe required standard, to reflect themove to a new totex model and tomake it more stretching with respectto large capital projects; and• the removal of three measures(regulatory capital expenditure,serviceability and bad debt) which donot form part of the new regulatoryregime or the delivery of whichare considered to be adequatelyincentivised via the other bonusmeasures.• Long-term incentive payout of97.5 per cent, supported by TSR ofaround 80 per cent over the period1 April 2012 to 31 March <strong>2015</strong> (seepage 96)• Shareholding guideline increased to200 per cent of salary and personalshareholdings remain above thislevel (see page 98)Further details of the bonus measuresfor <strong>2015</strong>/16 are given in the <strong>annual</strong><strong>report</strong> on remuneration on page 94 andtheir alignment to the business strategyis shown on page 86.The performance targets for the <strong>2015</strong>LTP are expected to be as for the2014 awards, with the exception ofthe sustainable dividend performancemeasure. Following the announcementby the board in January <strong>2015</strong> of ourdividend policy for the <strong>2015</strong>–20 period,the measure will switch focus to dividendcover, with the delivery of our dividendpolicy as an underpin.And finally, to provide further alignmentwith shareholder interests, the boardagreed in May <strong>2015</strong> to increase theshareholding guideline for executivedirectors from 100 per cent to 200per cent of base salary. Both executivedirectors have a shareholding in excessof this level.The committee concluded that nochanges to the policy approved at lastyear’s AGM were necessary and so therewill not be a separate vote on it at thisyear’s AGM.Agenda for <strong>2015</strong>/16During <strong>2015</strong>/16 the committee willcontinue to keep executive remunerationarrangements under review, althoughno substantial changes are expected.As always, we continue to welcomefeedback from shareholders.I hope we will receive your support forthe resolution relating to remunerationat the <strong>2015</strong> AGM.Sara WellerChair of the remuneration committee• Annual bonus measures changedfor <strong>2015</strong>/16 to align with newregulatory period <strong>2015</strong>-20 (seepage 94)• Long Term Plan sustainabledividends measure for <strong>2015</strong> grantsto focus on dividend cover, with thedelivery of dividend policy as anunderpin (see page 98)85SHAREHOLDER INFORMATION FINANCIAL STATEMENTS GOVERNANCESTRATEGIC REPORT
UNITED UTILITIES GROUP PLC ANNUAL REPORT AND FINANCIAL STATEMENTS <strong>2015</strong>Stock Code: UU.<strong>united</strong><strong>utilities</strong>.comAligning remuneration to business strategyOur remuneration policy has been designed in order to promote the long-term success of the company.The following table provides a summary of how our incentive framework aligns with our business strategy and the resultsthat it delivers:Annual bonusA long-termapproach tocreating valueThe bestservice tocustomersAt the lowestsustainablecostUnderlying operating profit 4 4Customer service in year 4 4• Service incentivemechanism – qualitativeIn aresponsiblemanner• Service incentivemechanism – quantitativeMaintaining and enhancingservices for customers 4 4 4 4• Wholesale outcomedelivery incentive (ODI)composite• Time, cost and quality ofthe capital programme(TCQi)Corporate responsibility 4 4• Dow JonesSustainability IndexPersonal 4 4 4 4Compulsory deferralof bonus 4 4Long Term Plan (LTP)Relative totalshareholder return (TSR) 4Sustainable dividends 4 4 4Customer serviceexcellence 4 4 4Additional two-yearholding period 4 4Shareholding guidelines 4Wholesale outcomedelivery incentive (ODI)composite:New bonus measureAs part of the development ofour business plan for <strong>2015</strong>–20,we spoke to more than 30,000customers across the North Westto ask them what they valuedmost about our service, and whatthey wanted to see improved. Thisfeedback helped to inform fivecustomer promises, which are atthe heart of our strategy for thenext five years and beyond.We have established a set ofperformance commitments tomake sure that we are on trackto meet our customer promises.There are 26 performancecommitments in total – 18 ofwhich relate to our wholesalebusiness and carry a financialincentive or penalty (known as an‘outcome delivery incentive’) whichwere agreed as part of Ofwat’sfinal determination. Rewards andpenalties will be accumulatedthroughout <strong>2015</strong>–20, and appliedby Ofwat in the following five-yearperiod from 2020. The size of thereward or penalty is weightedaccording to the value thatcustomers place on each measure.A significant proportion of executive directors’ pay is performance-linked and deferred:– fixed vs performance-linked (%) (1)– short-term vs deferred (%) (1)Fixed 33%Performance-linked 67%Short-term 50%Deferred 50%(1) Based on maximum payout scenario for executive directors (see page 90). Fixed consists of base salary, benefits andpension. Performance-linked consists of the Long Term Plan (LTP) and <strong>annual</strong> bonus. Short-term consists of fixedremuneration plus <strong>annual</strong> bonus paid as cash. Deferred consists of LTP plus <strong>annual</strong> bonus deferred into shares under theDeferred Bonus Plan (DBP).86
UNITED UTILITIES GROUP PLC ANNUAL REPORT AND FINANCIAL STATEMENTS <strong>2015</strong>Stock Code: UU.<strong>united</strong><strong>utilities</strong>.comDirectors’ remuneration pol icy (abridged)This part of the directors’ remuneration <strong>report</strong> sets out an abridged version of the remuneration policy which was approved byshareholders at the AGM on 25 July 2014. The policy took formal effect from the date of approval and is intended to apply untilthe 2017 AGM.A full version of the policy can be found in the Annual Report and Financial Statements for the year ended 31 March 2014<strong>annual</strong><strong>report</strong>2014.<strong>united</strong><strong>utilities</strong>.com/site-essentials/downloads/<strong>annual</strong>-<strong>report</strong>-2014Overview of remuneration policyThe company’s remuneration arrangements are designed so that the overall level of remuneration (including salary andbenefits, together with the short and long-term incentive opportunities) is sufficient to attract, retain and motivate executivesof the quality required to run the company successfully. The company does not pay more than is necessary for this purpose.The committee recognises that the company operates in the North West of England in a regulated environment and thereforeneeds to ensure that the structure of executive remuneration reflects both the practices of the markets in which its executivesoperate, and stakeholder expectations of how the company should be run.A significant proportion of senior executives’ remuneration is performance related. Senior executives are incentivised toachieve stretching results which are delivered with an acceptable level of risk. There is a strong direct link between incentivesand the company’s strategy and if the strategy is delivered, senior executives will be rewarded through the <strong>annual</strong> bonus andlong-term incentives. If it is not delivered, then a significant part of their potential remuneration will not be paid.Policy table for directorsBase salaryPurpose and link to strategy: To attract and retain executives of the experience and quality required to deliver thecompany’s strategy.OperationReviewed <strong>annual</strong>ly, effective 1 September.Significant increases in salary should only take placeinfrequently, for example where there has been a materialincrease in:• the size of the individual’s role;• the size of the company (through mergers andacquisitions); or• the pay market for directly comparable companies (forexample, companies of a similar size and complexity).On recruitment or promotion to executive director, thecommittee will take into account previous remunerationand pay levels for comparable companies when settingsalary levels. This may lead to salary being set at a loweror higher level than for the previous incumbent.BenefitsMaximum opportunityCurrent salary levels are shown in the <strong>annual</strong> <strong>report</strong> onremuneration.Executive directors will normally receive a salary increasebroadly in line with the increase awarded to the generalworkforce, unless one or more of the conditions outlined under‘operation’ is met.Where the committee has set the salary of a new hire at adiscount to the market level initially, a series of plannedincreases can be implemented over the following few years tobring the salary to the appropriate market position, subject toindividual performance.Performance measuresNone.Purpose and link to strategy: To provide market competitive benefits to help recruit and retain high calibre executives.OperationProvision of benefits such as:Read more on Base salary on page 93Read more on Benefits on pages 92 and 93• health benefits;• car or car allowance;• relocation assistance;• life assurance;• group income protection;• all employee share schemes (e.g. opportunity to jointhe ShareBuy scheme);• travel; and• communication costs.Additional benefits might be provided from time to timeif the committee decides payment of such benefits isappropriate and in line with emerging market practice.Maximum opportunityAs it is not possible to calculate in advance the cost of allbenefits, a maximum is not pre-determined.Performance measuresNone.SHAREHOLDER INFORMATION FINANCIAL STATEMENTS GOVERNANCESTRATEGIC REPORT87
UNITED UTILITIES GROUP PLC ANNUAL REPORT AND FINANCIAL STATEMENTS <strong>2015</strong>Stock Code: UU.<strong>united</strong><strong>utilities</strong>.comDirectors’ remuneration pol icy (abridged)Policy table for directors continuedPensionRead more on Pensions on pages 92 and 93Purpose and link to strategy: To provide a broadly mid-market level of retirement benefits.OperationExecutive directors are offered the choice of:• a company contribution into a defined contributionpension scheme; or• a cash allowance in lieu of pension; or• a combination of a company contribution into a definedcontribution pension scheme and a cash allowance.External hires will not be eligible to join a defined benefitpension scheme.Internal promotees who are active members of a UnitedUtilities defined benefit scheme will be offered the choiceof staying in that scheme or of choosing one of the aboveoptions (1) .Maximum opportunity• 25 per cent of salary into a defined contribution scheme; or• cash allowance of 22 per cent of base salary; or• a combination of both such that the cost to the company isbroadly the same.Under the defined benefit schemes, a maximum future accrualof 1/80th pension plus 3/80ths lump sum of final pensionablesalary for each year of service (1) .Performance measuresNone.Annual bonusPurpose and link to strategy: To incentivise performance against personal objectives and selected financial and operationalKPIs which are directly linked to business strategy. Deferral of part of bonus into shares aligns the interests of executivedirectors and shareholders.Operation50 per cent paid as cash.50 per cent deferred into company shares under theDeferred Bonus Plan (DBP) for three years.DBP shares accrue dividend equivalents.Not pensionable.Read more on Annual bonus on pages 93 and 94Bonuses are subject to clawback or malus in the event of amaterial overstatement in the financial statements of thecompany because of fraud or error.Deferred shares under the DBP are subject to malus insuch negative circumstances as the committee considersis appropriate. For example: material misstatementof audited financial results, serious failure of riskmanagement or serious reputational damage.Maximum opportunityMaximum 130 per cent of salary bonus potential, for theachievement of stretching performance objectives.Performance measuresPayments predominantly based on financial and operationalperformance, with a minority based on achievement of personalobjectives.Targets set by reference to the company’s financial andoperating plans.Target bonus of 50 per cent of maximum bonus potential andbonus of 25 per cent of maximum for threshold performance.(1) In 2010 the company made a number of changes to defined benefit pension provision including a restriction on salary increases which count for pensionpurposes. Since that time salary increases above inflation (RPI), including those relating to any promotions, are no longer pensionable.88
UNITED UTILITIES GROUP PLC ANNUAL REPORT AND FINANCIAL STATEMENTS <strong>2015</strong>Stock Code: UU.<strong>united</strong><strong>utilities</strong>.comPolicy table for directors continuedLong Term Plan (LTP)Purpose and link to strategy: To incentivise long-term value creation and alignment with longer term returns toshareholders.OperationAwards under the Long Term Plan are rights to receivecompany shares, subject to certain performanceconditions.Each award is measured over a three-year performanceperiod starting at the beginning of the financial year inwhich awards are granted.An additional two-year holding period applies after theend of the three-year performance period.Vested shares accrue dividend equivalents.Shares under the LTP are subject to malus in suchnegative circumstances as the committee considersare appropriate. For example: material misstatementof audited financial results, serious failure of riskmanagement or serious reputational damage.Non-executive directors’ fees and benefitsRead more on Long Term Plan on pages 95 to 98Maximum opportunity130 per cent of salary per annum.In exceptional circumstances the committee retains thediscretion to grant awards up to plan limits of 200 per cent ofsalary.Performance measuresOne-third of awards vest based on relative total shareholderreturn (TSR), one-third based on customer service excellenceand one–third based on a sustainable dividends performancecondition.Any vesting is also subject to the committee being satisfiedthat the company’s performance on these measures isconsistent with underlying business performance.100 per cent of awards vest for stretch performance,25 per cent of an award vests for threshold performance andno awards vest for below threshold performance.Purpose and link to strategy: To attract non-executive directors with a broad range of experience and skills to oversee thedevelopment and implementation of our strategy.OperationThe remuneration policy for the non-executive directors(with the exception of the Chairman) is set by a separatecommittee of the board. The policy for the Chairman isdetermined by the remuneration committee (of whichthe Chairman is not a member).Fees are reviewed <strong>annual</strong>ly taking into account the levelsof fees paid by companies of a similar size and complexity.Any changes are effective from 1 September.Additional fees are paid to the chairs of certain boardsub-committees and for the senior independent nonexecutivedirector.No eligibility for bonuses, long-term incentive plans,pension schemes, healthcare arrangements or employeeshare schemes.The company repays any reasonable expenses that a nonexecutivedirector incurs in carrying out their duties as adirector. In addition, travel, hospitality-related and othermodest benefits will be payable on occasion.Read more on Non-executive directors’ fees and benefits on page 101Maximum opportunityCurrent fee levels are shown in the <strong>annual</strong> <strong>report</strong> onremuneration.The value of benefits may vary from year to year according tothe cost to the company.Performance measuresNon-executive directors are not eligible to participate in anyperformance-related arrangements.SHAREHOLDER INFORMATION FINANCIAL STATEMENTS GOVERNANCESTRATEGIC REPORT89
UNITED UTILITIES GROUP PLC ANNUAL REPORT AND FINANCIAL STATEMENTS <strong>2015</strong>Stock Code: UU.<strong>united</strong><strong>utilities</strong>.comDirectors’ remuneration policy (abridged)Notes to the policy tableSelection of performance measures and targetsPerformance measures for the <strong>annual</strong> bonus are selected <strong>annual</strong>ly to align with the company’s key strategic goals for theyear and reflect financial, operational and personal objectives. ‘Target’ performance is typically set in line with the businessplan for the year, following rigorous debate and approval of the plan by the board. Threshold to stretch targets are thenset based on a sliding scale on the basis of relevant commercial factors. Only modest rewards are available for deliveringthreshold performance levels, with rewards at stretch requiring substantial outperformance of the business plan. Details ofthe measures used for the <strong>annual</strong> bonus are given in the <strong>annual</strong> <strong>report</strong> on remuneration.LTP targets are set taking into account a number of factors, including reference to market practice, the company businessplan and analysts’ forecasts where relevant. The LTP will only vest in full if stretching business performance is achieved.Annual bonus and long-term incentives – flexibility, discretion and judgementThe committee will operate the company’s incentive plans according to their respective rules and consistent with normalmarket practice, the Listing Rules and HMRC rules where relevant, including flexibility in a number of regards.Any discretion exercised (and the rationale) will be disclosed in the <strong>annual</strong> remuneration <strong>report</strong>.Scenarios for total remunerationThe charts below show the payout under the remuneration policy for each executive director under three differentscenarios. Please note that the charts have been updated from those in the policy approved at the AGM on 25 July 2014 toreflect updated fixed pay figures.CEO£’000sCFO£’000sFixed 100%879Long Term PlanAnnual BonusFixedFixed 100%561Long Term PlanAnnual BonusFixedTarget49%25%25%1,787Target49%25%25%1,135Maximum 33%34%34%2,696Maximum33%34%34%1,7090 5001,000 1,500 2,000 2,500 3,0000 500 1,000 1,500 2,000In developing the scenarios the following assumptions have been made:Fixed Consists of base salary, benefits and pension (£’000)Base salary is latest known salaryBenefits measured at benefits figure shown in single figure table on page 92Pension measured by applying cash in lieu rate against latest known salaryBase salary Benefits Pension Total fixedCEO 699 26 154 879CFO 441 23 97 561Target Annual bonus element pays out at 50% of maximumLong Term Plan element vests at 50% of maximumMaximum Based on what a director would receive if the maximum level of performance was achieved:Annual bonus element pays out in full (at 100% of maximum)Long Term Plan element vests in full (at 100% of maximum)Annual bonus includes amounts compulsorily deferred into shares.Long Term Plan is measured at face value i.e. no assumption for changes in share price or dividends.90
UNITED UTILITIES GROUP PLC ANNUAL REPORT AND FINANCIAL STATEMENTS <strong>2015</strong>Stock Code: UU.<strong>united</strong><strong>utilities</strong>.comService contracts and letters of appointmentExecutive directors’ service contracts are subject to up to one year’s notice period when terminated by the company and atleast six months’ notice when terminated by the director. A company notice period longer than one year may be provided ifnecessary for recruitment, but reducing to a rolling one-year period after the initial period has expired.The policy on payments for loss of office is set out in the next section.The Chairman and other non-executive directors have letters of appointment rather than service contracts. Theirappointments may be terminated without compensation at any time. All non-executive directors are subject to re-electionat the AGM.Copies of executive directors’ service contracts and non-executive directors’ letters of appointment are available forinspection at the company’s registered office during normal hours of business and will be available at the company’s AGM.Copies of non-executive directors’ letters of appointment can also be viewed on the company’s website.Shareholding guidelinesThe committee believes that it is important for a significant investment to be made by each executive director in the sharesof the company to provide alignment with shareholder interests. Executive directors are encouraged to build up and retaina targeted shareholding of at least 100 per cent of base salary, normally within five years of appointment. There is anexpectation that executive directors will continue to build a shareholding throughout their period of employment with thecompany, after the target shareholding is reached.Approach to recruitment remunerationThe remuneration package for a new executive director would be set in accordance with the terms of the company’sapproved remuneration policy in force at the time of appointment.Buy-out awardsIn addition, the committee may offer additional cash and/or share-based elements (on a one-time basis or ongoing) whenit considers these to be in the best interests of the company (and therefore shareholders). Any such payments would belimited to a reasonable estimate of value of remuneration lost when leaving the former employer and would reflect thedelivery mechanism (i.e. cash and/or share-based), time horizons and whether performance requirements are attached tothat remuneration. Shareholders will be informed of any such payments at the time of appointment.Maximum level of variable payThe maximum initial level of long-term incentives which may be awarded to a new executive director will be limited to themaximum Long Term Plan limit of 200 per cent of salary. Therefore, the maximum initial level of overall variable pay thatmay be offered will be 330 per cent of salary (i.e. 130 per cent <strong>annual</strong> bonus plus 200 per cent Long Term Plan). These limitsare in addition to the value of any buy-out arrangements which are governed by the policy above.In the case of an internal appointment, any variable pay element awarded in respect of the prior role would be allowed topay out according to its terms, adjusted as relevant to take into account the appointment. In addition, any other previouslyawarded entitlements would continue and be disclosed in the next <strong>annual</strong> <strong>report</strong> on remuneration.Base salary and relocation expensesThe committee has the flexibility to set the salary of a new appointment at a discount to the market level initially, witha series of planned increases implemented over the following few years to bring the salary to the appropriate marketposition, subject to individual performance in the role.For external and internal appointments, the committee may agree that the company will meet certain relocation expensesas appropriate.Appointment of non-executive directorsFor the appointment of a new Chairman or non-executive director, the fee arrangement would be set in accordance with theapproved remuneration policy in force at that time. Non-executive directors’ fees are set by a separate committee of theboard; the Chairman’s fees are set by the remuneration committee.Payment for loss of officeThe circumstances of the termination (taking into account the individual’s performance) and an individual’s duty andopportunity to mitigate losses are taken into account in every case. Our policy is to stop or reduce compensatorypayments to former executive directors to the extent that they receive remuneration from other employment during thecompensation period. A robust line on reducing compensation is applied and payments to departing employees may bephased in order to mitigate loss. A full version of the policy can be found in the Annual Report and Financial Statements forthe year ended 31 March 2014 <strong>annual</strong><strong>report</strong>2014.<strong>united</strong><strong>utilities</strong>.com/site-essentials/downloads/<strong>annual</strong>-<strong>report</strong>-2014SHAREHOLDER INFORMATION FINANCIAL STATEMENTS GOVERNANCESTRATEGIC REPORT91
UNITED UTILITIES GROUP PLC ANNUAL REPORT AND FINANCIAL STATEMENTS <strong>2015</strong>Stock Code: UU.<strong>united</strong><strong>utilities</strong>.comAnnual <strong>report</strong> on remunerationExecutive directors’ remuneration for the year ended 31 March <strong>2015</strong>Single total figure of remuneration for executive directors (audited information)Base salary£’000Benefits (1)£’000Annualbonus (2)£’000Long-termincentives£’000Pension (5)£’000Year ended 31 March <strong>2015</strong> 2014 <strong>2015</strong> 2014 <strong>2015</strong> 2014 <strong>2015</strong> (3) 2014 (4) <strong>2015</strong> 2014 <strong>2015</strong> 2014 <strong>2015</strong> 2014Steve Mogford (7) 692 675 26 24 696 687 1,287 843 152 149 31 0 2,884 2,378Russ Houlden (7) 437 426 23 23 440 433 804 621 96 94 23 0 1,823 1,597Other (6)£’000Total£’000(1) For executive directors, benefits include: a car allowance of £14,000; health, life and income protection insurance; travel costs and communication costs.The 2014 benefits for Steve Mogford were understated by £3,000 in last year’s <strong>report</strong>.(2) 50 per cent of bonus was deferred into shares for three years under the Deferred Bonus Plan (DBP). See page 93 for further details of bonus outcomes.(3) The performance period for the 2012 Performance Share Plan (PSP) and Matching Share Award Plan (MSAP) awards ended on 31 March <strong>2015</strong> and theawards vested on 19 May <strong>2015</strong>. The final vesting of those awards was 97.5 per cent resulting in 128,191 shares vesting for Steve Mogford and 80,087shares vesting for Russ Houlden. The value of these shares shown in the table above has been calculated using the closing share price on date of vesting,which was 1004 pence per share. See page 96 for further details.(4) The performance period for the 2011 PSP and MSAP awards ended on 31 March 2014 and the awards vested on 20 May 2014. The final vesting of thoseawards was 93.5 per cent, resulting in 98,686 shares vesting for Steve Mogford and 72,724 shares vesting for Russ Houlden. The value of these sharesshown in the table above has been calculated using the closing share price on date of vesting, which was 854 pence per share.(5) Cash allowance of 22 per cent of base salary paid in lieu of pension.(6) During the year there were extended restrictions in place on buying and selling shares due to the regulatory price review which meant that executivedirectors were unable to exercise their vested 2011 PSP and MSAP awards before the record date for the August 2014 dividend. In line with theshareholder approved policy (see page 90), the committee considered it appropriate not to penalise employees (including executive directors) for this lostdividend and exercised its discretion to pay a cash payment in lieu of these dividends forgone (on a net-of-tax equivalence basis). The figures in this columnalso include the value of matching shares under the ShareBuy scheme which vested in the year, valued using the closing share price on the day they vested(the company offers a one-for-five match on partnership shares bought by employees under ShareBuy which cease to become forfeitable one year afterthey are awarded).(7) The company recognises that its executive directors may be invited to become non-executive directors of companies outside the company and exposureto such non-executive duties can broaden experience and knowledge, which would be of benefit to the company. Any external appointments are subject toboard approval (which would not be given if the proposed appointment was with a competing company, would lead to a material conflict of interest or couldhave a detrimental effect on a director’s performance). Steve Mogford is the senior independent director of Carillion PLC for which he receives and retainsan <strong>annual</strong> fee of £60,200. Russ Houlden is an independent member of the supervisory board, and audit committee chairman of Orange Polska SA for whichhe receives and retains fees estimated <strong>annual</strong>ly at around PLN 323,000 (around £60,000).Pay and performanceA significant proportion of the executive directors’ pay is performance related. Over the last three years, strong operationalperformance has supported our dividend growth of RPI plus two per cent and driven significant share price growth (our marketcapitalisation increased from £4.1 billion to £6.4 billion over this period). The committee considers that the remunerationreceived for the year ended 31 March <strong>2015</strong> fairly recognises the executive directors’ contribution in delivering thisperformance.The chart below shows that around 70 per cent of executive directors’ total remuneration for the year ended 31 March <strong>2015</strong>was delivered in variable pay and 19 per cent related to share price growth and dividends on their vested long-term incentiveawards.Composition of executive directors’ remuneration£’000sSteve Mogford 30% 24% 27% 19% 2,884Russ Houlden 31% 24% 26% 19% 1,8230 500 1,000 1,500 2,000 2,500 3,000Fixed(1)Annual bonusLong-term incentives – performance elementLong-term incentives – share price growth and dividends(1) Fixed consists of base salary, benefits and pension.92
UNITED UTILITIES GROUP PLC ANNUAL REPORT AND FINANCIAL STATEMENTS <strong>2015</strong>Stock Code: UU.<strong>united</strong><strong>utilities</strong>.comBase salaryExecutive director salaries were increased by 2.5 per cent with effect from 1 September 2014 as shown below. This was inline with the headline increase applied across the wider workforce.Executive directorBase salary£’0001 Sept 2014 1 Sept 2013Steve Mogford 699.0 682.0Russ Houlden 441.3 430.5Any base salary increases in the year commencing 1 April <strong>2015</strong> will be in line with policy (see page 87 in the policy <strong>report</strong>).Benefits and pensionsNo changes are expected to benefits or pensions during the year commencing 1 April <strong>2015</strong> (see pages 87 and 88 in the policy <strong>report</strong>).Annual bonusAnnual bonus in respect of financial year ended 31 March <strong>2015</strong> (audited information)As highlighted earlier in the <strong>report</strong>, the company has had another very successful year and this has again been reflected inthe level of bonus awards. The overall bonus outcome for the executive directors for the year ended 31 March <strong>2015</strong> was77.4 per cent of maximum. This compares to the prior year outcome of 78.2 per cent.The performance measures, targets and outcomes are set out below:MeasureTargetsThreshold–StretchOutcome% of Steve Mogford Russ Houldenachieved (1) % % % %maximum Max Actual Max ActualUnderlying operating profit (2) £775.6m–£817.3m £811.4m 88 30.0 26.5 30.0 26.5Customer service in yearService incentive mechanism –4.36–4.43 4.24 0 10.0 0.0 10.0 0.0qualitative (3)Service incentive mechanism –quantitative107–100 99 100 10.0 10.0 10.0 10.0Maintaining and enhancing services for customersRegulatory capital expenditure (4)£822.7m +/- 6% to£822.7m +/- 2%£822.7m+2.4%91 8.0 7.3 8.0 7.3Time, cost and quality of95%–99% 97.3% 58 8.0 4.6 8.0 4.6capital programme (TCQi) (5)Sustainability of service and corporate responsibilityServiceability (four measures)Requirement: Stable or ImprovingThreshold: 3 xstable or improving5 outof 5 100 20.0 20.0 20.0 20.0Dow Jones Sustainability Index rating(one measure)Requirement: World ClassBad debt recoveryStretch: 5 out of 52.2%–1.8% 3.1% 0 4.0 0.0 4.0 0.0Personal objectives 10.0 9.0 10.0 9.0Total as % bonus maximum 100.0 77.4 100.0 77.4Total as % base salary 130.0 100.6 130.0 100.6Total £’000 (6) 696 440(1) 25 per cent for threshold performance; 50 per cent for target performance; 100 per cent for stretch performance. Straight-line vesting applies betweenthese points.(2) Underlying operating profit is subject to a number of adjustments, principally in regard to infrastructure renewals expenditure.(3) 2014/15 was a pilot year for changes to the service incentive mechanism (SIM) methodology, and so performance in the final year of the 2010-15 periodwas assessed in line with the revised methodology. The committee set targets using an externally validated benchmark.(4) Regulatory capital expenditure targets reflect changes in the Construction Output Price Index up to April 2014.(5) TCQi is an internal measure which measures the extent to which we deliver our capital projects on time, to budget and to the required standard. It isexpressed as a percentage, with a higher percentage representing better performance.(6) Under the Deferred Bonus Plan, 50 per cent of the <strong>annual</strong> bonus will be deferred in shares for three years.SHAREHOLDER INFORMATION FINANCIAL STATEMENTS GOVERNANCESTRATEGIC REPORT93
UNITED UTILITIES GROUP PLC ANNUAL REPORT AND FINANCIAL STATEMENTS <strong>2015</strong>Stock Code: UU.<strong>united</strong><strong>utilities</strong>.comAnnual <strong>report</strong> on remunerationAnnual bonus in respect of financial year commencing 1 April <strong>2015</strong>The maximum bonus opportunity for <strong>2015</strong>/16 will remain unchanged at 130 per cent of base salary.As referred to in the remuneration committee chair’s <strong>annual</strong> statement (see pages 84 and 85), during the year thecommittee reviewed the <strong>annual</strong> bonus measures to ensure that they are aligned to the delivery of the business strategy forthe next regulatory period <strong>2015</strong>–20 (Ofwat’s final determination having been accepted by the company in January <strong>2015</strong>).The performance measures, weightings and targets for the executive directors’ <strong>annual</strong> bonus for the year commencing1 April <strong>2015</strong> are set out in the table below, along with a description of why the committee considers the measures to beappropriate. Please note that certain targets are considered commercially sensitive, and consequently these will only bedisclosed after the end of the <strong>2015</strong>/16 financial year in the <strong>2015</strong>/16 <strong>annual</strong> <strong>report</strong> on remuneration.MeasureAlignment to strategyTargets<strong>2015</strong>/16Weighting(%)Underlying operating profit (1) Key measure of shareholder value. Commercially sensitive 30.0Customer service in year (2)Service incentive mechanism –qualitativeDelivering the best service to customersis a strategic objective.Commercially sensitive 12.0Service incentive mechanism –quantitativeOfwat can apply financial incentives orpenalties depending on our customerservice performance.Maintaining and enhancing services for customersWholesale outcome delivery Delivering the best service to customersincentive composite (3)is a strategic objective.Time, cost and quality of capitalprogramme (TCQi) (4)There is a direct financial impact on thecompany of Ofwat incentives and penaltiesfor delivery/non-delivery of customerpromises (see page 86).Keeping tight control of our capitalprogramme ensures we can provide areliable service to our customers at thelowest sustainable cost.Commercially sensitive 4.0Commercially sensitive 20.073%–98% 20.0Corporate responsibilityDow Jones SustainabilityEnsures that we manage our business in a World Class 4.0Index ratingresponsible manner.Personal objectives Commercially sensitive 10.0Total as % bonus maximum 100.0(1) Underlying operating profit is subject to a number of adjustments, principally in regard to infrastructure renewals expenditure.(2) This measures our customer service performance over the bonus year, as <strong>report</strong>ed by Ofwat through their measure of customer service.(3) A measure of the total net incentive or penalty to be applied by Ofwat for delivery/non-delivery of performance commitments related to our wholesalebusiness during the year.(4) TCQi is an internal audited calculation which measures the extent to which we deliver our capital projects on time (time), to budget (cost) and to the requiredstandard (quality). It is expressed as a percentage, with a higher percentage representing better performance. For <strong>2015</strong>/16 changes have been made toTCQi , including extending coverage to relevant non-regulatory commitments, measuring cost in terms of total expenditure (totex) and giving a greaterweighting in the cost element to our biggest capital projects. This resulted in a recalibration of the index. The committee is satisfied that the range of TCQitargets for the <strong>2015</strong>/16 <strong>annual</strong> bonus is appropriate and sufficiently stretching.94
UNITED UTILITIES GROUP PLC ANNUAL REPORT AND FINANCIAL STATEMENTS <strong>2015</strong>Stock Code: UU.<strong>united</strong><strong>utilities</strong>.comLong-term incentivesSummary of long-term incentives for executive directorsThe Long Term Plan (LTP) was introduced in 2013 following an extensive review and shareholder consultation. The LTPreplaced two long-term incentive plans – the Performance Share Plan (PSP) and the Matching Share Award Plan (MSAP).The structure of the LTP awards to be granted in <strong>2015</strong> will remain the same as for the 2014 awards, with the exception of aswitch to dividend cover as the differentiator of performance under the sustainable dividends performance measure.A summary of the long-term incentives referred to in this <strong>report</strong> is set out in the table below:Year of grantFuture awards<strong>2015</strong>(to be granted inJune <strong>2015</strong>)SchemeLevel ofawardLTP 130%of basesalaryOngoing awards2014 LTP As for<strong>2015</strong>2013 LTP As for<strong>2015</strong>Vested awards2012 PSP 70%of basesalary2012 MSAP 54% of<strong>annual</strong>bonus(up to 1:1match)Performance(and holding)period3 years(plus 2years)As for<strong>2015</strong>As for<strong>2015</strong>Performanceperiod end31 MarchPerformancemeasures2018 • Relative TSR• Sustainabledividends• CustomerserviceexcellenceWeighting ofperformancemeasures33.3%33.3%33.3%2017 As for <strong>2015</strong> As for<strong>2015</strong>2016 As for <strong>2015</strong> As for<strong>2015</strong>3 years <strong>2015</strong> • Relative TSR• Opex37.5%outperformance• Capex50%12.5%3 years <strong>2015</strong> As for 2012 PSP As for2012 PSPTSR comparatorgroup (1)FTSE 100(excluding financialservices, oil andgas, and miningcompanies)See page98As for <strong>2015</strong> 97As for <strong>2015</strong>Weighted index (2) :96Severn Trent (100),Pennon Group (75),National Grid (25),Scottish andSouthern Energy (25),Centrica (25)As for 2012 PSP 96(1) For the purposes of calculating TSR, the TSR index is averaged over the three months prior to the start and end of the performance period. TSR isindependently calculated by New Bridge Street.(2) Weightings in brackets.SHAREHOLDER INFORMATION FINANCIAL STATEMENTS GOVERNANCESTRATEGIC REPORT95
UNITED UTILITIES GROUP PLC ANNUAL REPORT AND FINANCIAL STATEMENTS <strong>2015</strong>Stock Code: UU.<strong>united</strong><strong>utilities</strong>.comAnnual <strong>report</strong> on remunerationPerformance for vested awards2012 awards with a performance period ending 31 March <strong>2015</strong> (audited information)The long-term incentive amount included in the single total figure of remuneration on page 92 is in respect of the 2012Performance Share Plan (PSP) and Matching Share Award Plan (MSAP) awards which vested on 19 May <strong>2015</strong>. The overallvesting outcome was 97.5 per cent of maximum which reflects strong total shareholder return (TSR) of 80 per cent over thethree-year performance period and excellent operational and capital expenditure performance.The targets and achievement against those targets are set out in the table below.Performance measures and relativeweightingRelative total shareholderreturn (TSR)(50%)Opex outperformance versusOfwat’s allowed operating costs(37.5%)Capex versus Ofwat’s allowedcapital expenditure allowancemeasured over the period2010–15(12.5%)Targets and performance achieved(measured over the period 1 April 2012 to 31 March <strong>2015</strong>,except where indicated)Targets (1) : Stretch: 100% vesting for outperforming theindex (2) by 6.3% or more on a multiplicative basisThreshold: 25% vesting for TSR performance equal to theindexAchievement: Company TSR of 80.2% was significantlyabove the stretch target of 54.8% (index performance was45.6%).Targets (1) : Stretch: 100% vesting for outperformance of£64.9m or moreIntermediate: 50% vesting for outperformance of £49.7mThreshold: 25% vesting for outperformance of £0 (i.e. inline with allowed operating costs)Achievement: Opex outperformance was greater than thestretch target.Targets (1) : Stretch: 100% vesting for capex within +/-1% ofOfwat’s allowed capital expenditure allowanceIntermediate: 50% vesting for capex of +/-2% of Ofwat’sallowed capital expenditure allowanceThreshold: 25% vesting for capex of +/-3% of Ofwat’sallowed capital expenditure allowanceAchievement: Capex was 1.4% less than Ofwat’s allowedcapital expenditure allowance, which was between theintermediate and stretch targets.Vesting% maximum % of award100% 50%100% 37.5%80% 10%Total vesting 97.5%(1) Straight line vesting applies between these points, with nil vesting below threshold performance.(2) For details of the index companies see page 95.2011 awards with a performance period ending 31 March 2014In last year’s <strong>report</strong> the vesting outcome was disclosed for the 2011 Performance Share Plan (PSP) and Matching ShareAward Plan (MSAP) awards which vested on 20 May 2014. At that time the directors considered it commercially sensitiveto disclose targets for the opex outperformance and capex outperformance conditions and committed to disclosing thetargets in this year’s <strong>report</strong>, after the end of the 2010-15 period.For the opex outperformance measure (measuring opex outperformance versus Ofwat’s allowed operating costs for theperiod 1 April 2011 to 31 March 2014), outperformance was £77.7 million which was just below the stretch target of £81.3million (resulting in 88 per cent vesting for this element).For the capex outperformance measure (measuring capex outperformance versus Ofwat’s allowed operating costs for theperiod 1 April 2011 to 31 March 2014), outperformance was greater than the stretch target of £41.0 million (resulting in100 per cent vesting for this element).96
UNITED UTILITIES GROUP PLC ANNUAL REPORT AND FINANCIAL STATEMENTS <strong>2015</strong>Stock Code: UU.<strong>united</strong><strong>utilities</strong>.comPerformance targets for awards granted in the year2014 awards with a performance period ending 31 March 2017 (audited information)Details about the 2014 LTP performance measures and targets are shown in the following table, together with anexplanation of how the measures align with the company’s strategy:Performance measures andrelative weightingRelative total shareholderreturn (TSR)(33.3%)Sustainable dividends(33.3%)Customer serviceexcellence (3)(33.3%)Alignment to strategy Targets (1)Direct measure of delivery of shareholderreturns, rewarding management for theoutperformance of a comparator groupof companiesDirect measure of return to shareholdersthrough dividend payments, whilstfocusing on the creation of strongearnings that ensure the sustainabilityof dividendsIt is a key strategic objective to providethe best service to customers. This isfundamental to delivering our vision ofbecoming a leading North West serviceprovider and one of the UK’s bestwater and wastewater companies. Thismeasure has a direct financial impacton the company as our regulator canapply financial incentives or penaltiesdepending on our customer serviceperformance(measured over the period 1 April 2014 to 31 March 2017)• Stretch: 100% vesting for TSR ofmedian (2)x 1.15 or more• Threshold: 25% vesting for median TSR• Comprises two elements – dividend growth anddividend cover• For the 2014 LTP where the performance periodstraddles two regulatory periods, dividendcover will operate as an underpin, with dividendgrowth (over the three-year period) providing thepayout range based on threshold (25% vesting),intermediate (75% vesting), and stretch (100%vesting) targets• The targets are considered commerciallysensitive and so are not disclosed in this<strong>report</strong>. However, actual targets, performanceachieved and awards made will be publishedretrospectively so that shareholders can fullyunderstand the basis for any payouts• Stretch vesting (100%) for upper decile position• Intermediate vesting (80%) for upper quartileposition• Threshold vesting (25%) for median position(1) Straight line vesting applies between these points, with nil vesting below threshold performance.(2) For details of the comparator companies see page 95.(3) Based on Ofwat’s customer service measure (currently the service incentive mechanism). Vesting is based on ranking position in the final year compared tothe other water and wastewater companies (currently 18 companies including United Utilities).The committee will have the flexibility to make appropriate adjustments to the performance targets in exceptionalcircumstances, to ensure that the award achieves its original purpose.Any vesting is also subject to the committee being satisfied that the company’s performance on these measures isconsistent with underlying business performance.SHAREHOLDER INFORMATION FINANCIAL STATEMENTS GOVERNANCESTRATEGIC REPORT97
UNITED UTILITIES GROUP PLC ANNUAL REPORT AND FINANCIAL STATEMENTS <strong>2015</strong>Stock Code: UU.<strong>united</strong><strong>utilities</strong>.comAnnual <strong>report</strong> on remunerationPerformance targets for future awards<strong>2015</strong> awards with a performance period ending 31 March 2018The performance targets for the <strong>2015</strong> Long Term Plan (LTP) are expected to be as for the 2014 awards outlined above,with the exception of the sustainable dividend performance measure. Following the announcement by the board in January<strong>2015</strong> of our dividend policy for the regulatory period <strong>2015</strong>–20, the measure will switch focus from dividend growth asthe differentiator of performance with dividend cover as an underpin, to dividend cover being the differentiator with thedelivery of our dividend policy as an underpin.Executive directors’ interests in sharesExecutive directors’ shareholding (audited information)To provide further alignment with shareholder interests, in May <strong>2015</strong> the board agreed to increase the shareholdingguidelines for executive directors from 100 per cent to 200 per cent of base salary. Executive directors are normallyexpected to reach this shareholding within five years of appointment. There is also an expectation that they will continue tobuild a shareholding throughout their period of employment with the company after the guideline is reached.Details of beneficial interests in the company’s ordinary shares as at 31 March <strong>2015</strong> held by each of the executive directorsand their connected persons are set out in the table below along with progress against the target shareholding guidelinelevel. The table shows that both Steve Mogford and Russ Houlden have already exceeded the target shareholding.DirectorNumber ofshares requiredto meetshareholdingguideline (1)Shares counting towards shareholding guidelines at31 March <strong>2015</strong>Number ofshares ownedoutright(includingconnectedpersons)Unvestedshares notsubject toperformanceconditions (2)Total sharescountingtowardsshareholdingguidelines (3)Shareholding Shareholdingas % of baseguidelinesalary atmet at31 March 31 March<strong>2015</strong> (1) <strong>2015</strong>Unvestedshares subjectto performanceconditions (4)Steve Mogford (5) 146,772 171,294 199,103 276,838 377% Yes 368,108Russ Houlden (5) 92,661 72,895 104,770 128,442 277% Yes 231,491(1) Share price used is the average share price over the three months from 1 January <strong>2015</strong> to 31 March <strong>2015</strong> (952.5 pence per share).(2) Unvested shares subject to no further performance conditions such as matching shares under the ‘ShareBuy’ scheme and the matched share investmentschemes. Includes shares only subject to malus provisions such as the Deferred Bonus Plan shares in the three-year deferral period and Long Term Planshares in the two-year holding period.(3) Includes unvested shares not subject to performance conditions (on a net of tax and national insurance basis), plus the number of shares owned outright.(4) Includes unvested shares under the Performance Share Plan, Matching Share Award Plan and Long Term Plan.(5) In the period 1 April <strong>2015</strong> to 20 May <strong>2015</strong>, additional shares were acquired by Steve Mogford (36 ordinary shares) and Russ Houlden (36 ordinary shares) inrespect of their regular monthly contributions to the ‘ShareBuy’ scheme. These will be matched by the company on a one-for-five basis. Under the scheme,matching shares vest provided the employee remains employed by the company one year after grant.98
UNITED UTILITIES GROUP PLC ANNUAL REPORT AND FINANCIAL STATEMENTS <strong>2015</strong>Stock Code: UU.<strong>united</strong><strong>utilities</strong>.comExecutive directors’ share plan interests 1 April 2014 to 31 March <strong>2015</strong> (audited information)Award dateAwards heldat 1 April2014Granted inyearNotionaldividendsaccrued inyear (1)Exercised/vested inyearLapsed/forfeited inyearAwards heldat 31 March<strong>2015</strong>Face valueof awardsgranted inyear (£’000)Value ofshares ondate vested(£’000)Steve MogfordDBP 17.6.13 51,987 – 2,129 – – 54,116 – –DBP (2) 30.6.14 – 38,998 1,597 – – 40,595 343 (3) –PSP (4) 8.7.11 86,698 – – 81,062 5,636 0 – 692 (5)PSP 15.6.12 73,427 – 3,008 – – 76,435 – –MSAP (4) 8.7.11 18,850 – – 17,624 1,226 0 – 151 (5)MSAP 15.6.12 52,878 – 2,166 – – 55,044 – –LTP 29.7.13 126,626 – 5,187 – – 131,813 – –LTP 30.6.14 – 100,692 4,124 – – 104,816 886 (6) –MSIS (7) 27.5.11 100,244 – 4,107 – – 104,351 – –ShareBuy matchingshares (8)1.4.14 to31.3.15 42 41 – 42 – 41 0 0Russ HouldenDBP 17.6.13 32,801 – 1,343 – – 34,144 – –DBP (2) 30.6.14 – 24,615 1,008 – – 25,623 217 (3) –PSP (4) 8.7.11 53,351 – – 49,883 3,468 0 – 426 (5)PSP 15.6.12 46,314 – 1,897 – – 48,211 – –MSAP (4) 8.7.11 24,429 – – 22,841 1,588 0 – 195 (5)MSAP 15.6.12 32,596 – 1,335 – – 33,931 – –LTP 29.7.13 79,913 – 3,273 – – 83,186 – –LTP 30.6.14 – 63,560 2,603 – – 66,163 560 (6) –MSIS (9) 1.10.10 43,193 – 1,769 – – 44,962 – –ShareBuy matchingshares (8)1.4.14 to31.3.15 41 41 – 41 – 41 0 0(1) Note that these are also subject to performance conditions where applicable.(2) Executive directors were required to defer 50 per cent of their 2013/14 bonus into shares for three years under the DBP. The deferral period will end on30 June 2017. There were no service or performance conditions attached, however deferred bonuses are subject to malus provisions (see page 88 forfurther information).(3) The face value of the DBP awards made in 2014 have been calculated using the closing share price on 27 June 2014 (the dealing day prior to date of grant)which was 880.5 pence per share.(4) 93.5 per cent of the 2011 PSP and MSAP awards vested. See page 96 for further detail.(5) Calculated using the closing share price on date of vesting (20 May 2014) of 854 pence per share.(6) The face value of the LTP awards made in 2014 has been calculated using the closing share price on 27 June 2014 (the dealing day prior to date of grant)which was 880.5 pence per share. 25 per cent of the award vests for threshold performance and performance is measured over the period 1 April 2014 to31 March 2017. Details of the performance measures and targets are given on page 97.(7) Full details of the one-off matched share investment scheme award for Steve Mogford, introduced as a necessary part of his terms of appointment, weredisclosed in the 2010/11 <strong>report</strong>. Shares under this scheme will vest on 5 January 2016, subject to him still being employed by the group at that date.(8) Under ShareBuy, matching shares vest provided the employee remains employed by the company one year after grant. During the year Steve Mogfordpurchased 204 partnership shares and was awarded 41 matching shares (at an average share price of 870 pence per share). Russ Houlden purchased 205partnership shares and was awarded 41 matching shares (at an average share price of 870 pence per share).(9) Full details of the one-off matched share investment scheme award for Russ Houlden, introduced as a necessary part of his terms of appointment, weredisclosed in the 2010/11 <strong>report</strong>. Shares under this scheme will vest on 1 October <strong>2015</strong>, subject to him still being employed by the group at that date.Dates of service contractsExecutive directorsDate of service contractSteve Mogford 5.1.11Russ Houlden 1.10.10SHAREHOLDER INFORMATION FINANCIAL STATEMENTS GOVERNANCESTRATEGIC REPORT99
UNITED UTILITIES GROUP PLC ANNUAL REPORT AND FINANCIAL STATEMENTS <strong>2015</strong>Stock Code: UU.<strong>united</strong><strong>utilities</strong>.comAnnual <strong>report</strong> on remunerationOther informationValue (£)280260240220200180160150162164189183215201265214Performance graphThe chart on the left shows the company’s six-yeartotal shareholder return (TSR) performance againstthe FTSE 100 index. The index was selected becausethe company is a member of the FTSE 100 and it isconsidered to be the most suitable widely publishedbenchmark for this purpose.1401201001001231382009 2010 2011 2012 2013 2014 <strong>2015</strong>United Utilities Group PLC148Year ending 31 MarchFTSE 100 IndexSix-year history of CEO’s payThe table below shows the CEO’s pay over the same six-year period as the TSR chart above.Year ended 31 MarchCEOCEO single figure of totalremuneration (£’000)Annual bonus as % ofmaximumLong-term incentivevesting as % ofmaximum (1)<strong>2015</strong> Steve Mogford 2,884 77.4 97.52014 Steve Mogford 2,378 78.2 93.52013 Steve Mogford 1,549 84.4 n/a (2)2012 Steve Mogford 1,421 72.0 n/a (2)2011 Steve Mogford 377 90.6 n/a (2)2011 Philip Green 3,073 90.8 28.1 (3)100.0 (4)2010 Philip Green 1,992 89.2 0 (5)(1)For performance periods ending 31 March, unless otherwise stated.(2)Steve Mogford was not a participant in any long-term incentive plans that had performance periods ending during 2011 to 2013. For those who didparticipate in those plans, the vesting as a percentage of maximum was 37.5 per cent for those vesting in 2012 and 35.3 per cent for those vesting in 2013.(3)2008 PSP and MSAP.(4)The retention period applicable to Philip Green’s matched share investment scheme ended on 12 February 2011.(5)2007 Performance Share Plan (PSP).(6)2007 Matching Share Award Plan (MSAP) .12.5 (6)Percentage change in CEO’s remuneration versus the wider workforceThe table below shows how the percentage change in the CEO’s salary, benefits and bonus earned in 2013/14 and 2014/15compares with the percentage change in the average of each of those components for a group of employees.Item Year-on-year change CEO (%) (1) Year-on-year change employees (%) (2)Base salary (3) (4) 2.5 3.0Taxable benefits 8.3 5.2Bonus 0.1 -2.9(1) See single total figure of remuneration table on page 92 for more information.(2) To aid comparison, the group of employees selected by the committee are those who were employed over the complete two-year period.(3) On 1 September 2014 Steve Mogford received a base salary increase of 2.5 per cent.(4) Includes promotional increases.Relative importance of spend on payThe table below shows the relative importance of spend on pay compared to distributions to shareholders.2014/<strong>2015</strong> 2013/2014 % changeEmployee costs £m (1) 260 252 3.0%Dividends paid to shareholders £m 249 238 4.8%(1) Employee costs includes wages and salaries, social security costs, and post-employment benefits. The 2013/14 figures have been restated to reflect therequirements of IFRS 11 ‘Joint Arrangements’. See accounting policies page 124 for details.100
UNITED UTILITIES GROUP PLC ANNUAL REPORT AND FINANCIAL STATEMENTS <strong>2015</strong>Stock Code: UU.<strong>united</strong><strong>utilities</strong>.comNon-executive directorsSingle total figure of remuneration for non-executive directors (audited information)Year ended 31 MarchFees£’000Benefits£’000Total£’000<strong>2015</strong> 2014 <strong>2015</strong> 2014 <strong>2015</strong> 2014Dr John McAdam 281 274 1 1 282 275Dr Catherine Bell 69 66 1 1 70 67Stephen Carter (1) 36 n/a 1 n/a 37 n/aMark Clare (2) 69 25 1 1 70 26Paul Heiden (3) n/a 24 n/a 1 n/a 25Brian May 76 69 1 1 77 70Nick Salmon (4) 22 69 2 0 24 69Sara Weller 72 69 0 0 72 69(1) Stephen Carter joined the board on 1 September 2014.(2) Mark Clare joined the board on 1 November 2013.(3) Paul Heiden retired from the board on 26 July 2013.(4) Nick Salmon retired from the board on 25 July 2014.FeesNon-executive director <strong>annual</strong> fee rates were reviewed and increased with effect from 1 September 2014 as shown below:RoleFees£’0001 Sept 2014 1 Sept 2013Base fees: Chairman (1) 284.0 277.0Base fees: other non-executive directors (2) 61.35 59.85Senior independent non-executive director (2) 12.5 10.0Chair of audit committee (2) 15.0 15.0Chair of remuneration committee (2) 12.5 10.0Chair of corporate responsibility committee (2) 8.0 8.0(1) Approved by the remuneration committee.(2) Approved by a separate committee of the board .Any fee increases in the year commencing 1 April <strong>2015</strong> will be in line with policy (see page 89 in the policy <strong>report</strong>).Non-executive directors’ shareholding (audited information)Details of beneficial interests in the company’s ordinary shares as at 31 March <strong>2015</strong> held by each of the non-executivedirectors and their connected persons are set out in the table below.Number of shares owned outright(including connected persons) at 31 March <strong>2015</strong>Dr John McAdam 1,837Dr Catherine Bell 7,000Stephen Carter 3,000Mark Clare 7,628Brian May 3,000Sara Weller 10,531Dates first appointed to the boardNon-executive directorsDate first appointed to the boardDr John McAdam 4.2.08Dr Catherine Bell 19.3.07Stephen Carter 1.9.14Mark Clare 1.11.13Brian May 1.9.12Sara Weller 1.3.12SHAREHOLDER INFORMATION FINANCIAL STATEMENTS GOVERNANCESTRATEGIC REPORT101
UNITED UTILITIES GROUP PLC ANNUAL REPORT AND FINANCIAL STATEMENTS <strong>2015</strong>Stock Code: UU.<strong>united</strong><strong>utilities</strong>.comAnnual <strong>report</strong> on remunerationThe remuneration committeeSummary terms of referenceThe committee’s terms of reference were last updated in April <strong>2015</strong> and are available on our website:corporate.<strong>united</strong><strong>utilities</strong>.com/corporate-governanceThe committee’s main responsibilities include:• making recommendations to the board on thecompany’s framework of executive remuneration andits cost;• approving the individual employment and remunerationterms for executive directors and other seniorexecutives, including: recruitment and severanceterms, bonus plans and targets, and the achievement ofperformance against targets;• approving the general employment and remunerationterms for selected senior employees;• approving the remuneration of the Chairman;• proposing all new long-term incentive schemes forapproval of the board, and for recommendation by theboard to shareholders; and• assisting the board in <strong>report</strong>ing to shareholders andundertaking appropriate discussions as necessarywith institutional investors on aspects of executiveremuneration.Composition of the remuneration committeeMember Member since Member toSara Weller (chair since 27.7.12) 1.3.12 To dateDr Catherine Bell 1.3.11 To dateMark Clare 1.9.14 To dateNick Salmon (1) 4.4.05 25.7.14(1) Nick Salmon retired from the board on 25 July 2014.The committee’s members have no personal financial interest in the company other than as shareholders and the fees paidto them as non-executive directors.Advisors to the remuneration committeeBy invitation of the committee, meetings are also attended by the Chairman of the company (John McAdam), the CEO (SteveMogford), the company secretary (Simon Gardiner, who acts as secretary to the committee), the business services director(Sally Cabrini) and the head of reward (Ruth Henshaw), who are consulted on matters discussed by the committee, unlessthose matters relate to their own remuneration. Advice or information is also sought directly from other employees wherethe committee feels that such additional contributions will assist the decision-making process.The committee is authorised to take such internal and external advice as it considers appropriate in connection withcarrying out its duties, including the appointment of its own external remuneration advisors.During the year, the committee was assisted in its work by the following external advisor:Advisor Appointed by How appointedNew Bridge Street Committee Reappointed followingcommittee review in2013Other services provided to the company• Benchmarking of roles not under the committee’s remitServices provided to thecommittee in year ended31 March <strong>2015</strong>General advice onremunerationmattersFees paid by company forthese services in respect ofyear and basis of charge£81,000Time/cost basisThe independent consultants New Bridge Street (a trading name of Aon Hewitt Limited, an Aon PLC company) are membersof the Remuneration Consultants Group and, as such, voluntarily operate under the Code of Conduct in relation to executiveremuneration consulting in the UK. The committee is satisfied that the advice they received from external advisors isobjective and independent.In addition, during the year the law firms Eversheds and Addleshaw Goddard provided advice on the company’s shareschemes to the company.102
UNITED UTILITIES GROUP PLC ANNUAL REPORT AND FINANCIAL STATEMENTS <strong>2015</strong>Stock Code: UU.<strong>united</strong><strong>utilities</strong>.comKey activities of the remuneration committee over the past yearThe committee met five times in the year ended31 March <strong>2015</strong>.Regular activities• Approved the 2013/14 directors’ remuneration <strong>report</strong>• Reviewed the base salaries of executive directors andother members of the executive team• Reviewed the base fee for the Chairman• Assessed the achievement of targets for the 2013/14<strong>annual</strong> bonus scheme, reviewed progress against thetargets for the 2014/15 <strong>annual</strong> bonus scheme, and setthe targets for the <strong>2015</strong>/16 <strong>annual</strong> bonus scheme• Assessed the measurement of performance conditionsfor the long-term incentive awards vesting in 2014,including both Performance Share Plan (PSP) awardsand matching shares vesting under the Matching ShareAward Plan (MSAP), and set the targets for Long TermPlan (LTP) awards made in 2014• Reviewed and approved awards made under the <strong>annual</strong>bonus scheme, Deferred Bonus Plan (DBP) and LTP• Monitored progress against shareholding guidelines forexecutive directors and other members of the executiveteam• Reviewed the committee’s performance during theperiod• Reviewed the committee’s terms of reference• Considered market trends in executive remuneration,including in the wider <strong>utilities</strong> sectorOther activities• Completed a review of the <strong>annual</strong> bonus structure andmeasures for the <strong>2015</strong>-20 period• Engaged with shareholders regarding the review of the<strong>annual</strong> bonus scheme2014 AGM: Statement of votingAt the last Annual General Meeting on 25 July 2014, votes on the directors’ remuneration <strong>report</strong> were cast as follows:For Against AbstainResolution% Number % Number NumberApproval of the 2013/14 directors’ remuneration<strong>report</strong> (other than the part containing the directors’remuneration policy) 99.39 397,476,289 0.61 2,421,968 2,701,560Approval of the directors’ remuneration policyeffective 25 July 2014 98.48 394,128,786 1.52 6,065,537 2,404,464The directors’ remuneration <strong>report</strong> was approved by the board of directors on 20 May <strong>2015</strong> and signed on its behalf by:Sara WellerChair of the remuneration committeeSHAREHOLDER INFORMATION FINANCIAL STATEMENTS GOVERNANCESTRATEGIC REPORT103
UNITED UTILITIES GROUP PLC ANNUAL REPORT AND FINANCIAL STATEMENTS <strong>2015</strong>Stock Code: UU.<strong>united</strong><strong>utilities</strong>.comDirectors’ <strong>report</strong>:other statutory informationCarbon emissions for2014/15473,708tonnes CO 2equivalent19 per cent below our 2005/06baselineRenewable energy144GWhof renewable generationOur highest ever renewable energygeneration, equivalent to 19 percent of our electricity consumptionOur directors present their management <strong>report</strong> and the audited financialstatements of United Utilities Group PLC (the company) and its subsidiaries(together referred to as the group) for the year ended 31 March <strong>2015</strong>.Business modelA description of the company’sbusiness model can be found within thestrategic <strong>report</strong> on pages 14 to 18.Greenhouse gas emissionsWe measure our emissions over thefinancial <strong>report</strong>ing year against afootprint covering the operationalactivities of the water and propertyservices businesses in the UK. Allfigures stated are in line with the latestUK Government carbon <strong>report</strong>ingguidance. Our <strong>report</strong>ing is compliantwith the international carbon <strong>report</strong>ingstandard ISO 14064, Part 1 andassured to a reasonable standard bythe Certified Emissions Measurementand Reduction Scheme certification.In 2010 we stated our short-termtarget to reduce our emissions by 21per cent by <strong>2015</strong>, against a 2005/06baseline. As stated in the performance<strong>report</strong>, last year our emissions were473,708 tonnes of carbon dioxideequivalent (tCO 2e), 19 per cent belowour 2005/06 baseline, so narrowlymissing our short-term target. Missingthis target is extremely disappointingas we purchased less electricitythan in any of the last 10 years andgenerated our highest ever amount ofrenewable energy. However, we couldnot counteract the impact of the 11 percent increase in the carbon content ofthe UK’s electricity supply.Our carbon footprint over the last 10 yearsTonnes of carbon dioxide equivalent (tCO2e)650,000600,000550,000500,000450,000400,000350,000300,00005-06 06-07 07-08 08-09 09-10 10-11 12-13 13-14 14-15Gross carbon footprintTarget carbon footprint in <strong>2015</strong>Overall emissions trendThe trend in our overall emissions continues to be downwards even though theyhave fluctuated over the past few years – as they can be affected by weather,operational conditions and the carbon content of the UK’s electricity supply. Weare currently assessing what our next carbon targets should be, covering ouremissions up to 2020 and beyond, taking both our plans and the impact of UKenergy and carbon policy into account.We expect the trend in our emissions to remain downwards reflecting our effortsto use less energy and increase renewable energy generation, alongside projecteddecreases in the carbon content of the UK’s energy supply. It is likely there will besome fluctuation as a result of operational responses to weather conditions andwider trends in the energy market affecting the carbon content of UK electricity.104
UNITED UTILITIES GROUP PLC ANNUAL REPORT AND FINANCIAL STATEMENTS <strong>2015</strong>Stock Code: UU.<strong>united</strong><strong>utilities</strong>.comBoundary of our carbon footprintSCOPE 1((Direct)The following table gives a breakdown of our carbon emissions by scope and sourceCHG ScopeScope 1emissionsScope 2emissionsScope 3emissionsCO CH 4N 2O SF HFCs PFCs• Process emissionsincludingrefrigerants• Fossil fuel use• Company vehiclesSourceSCOPE 2( Indirect)• Purchasedelectricity(generation)SCOPE 3(Indirect)• Purchasedelectricity(transmission anddistribution)• Sludge and processwaste disposal• Public transportand mileageOutside of boundary:contractor emissions, supplier emissions, customer emissionsOur carbon footprintThe boundary of our carbon footprint includes both direct and indirectemissions as a result of our operations. Direct emissions include those fromour treatment processes, company vehicles and burning of fossil fuels forheating or incineration of sewage sludge. Indirect emissions include those fromthe electricity we use to power our treatment plants, emissions from travel oncompany business and sludge and treatment waste disposal emissions. Ouremissions account for all of the Kyoto Protocol gases – converted to carbondioxide equivalents. There are no material omissions.2012 – 2013(tCO 2 e)Emissionsnnnnnnn2013 – 2014(tCO 2 e)Total grid electricityused by company: generationProcess and emissions from our treatmentplants – including refrigerantsEmissions from sludge/processwaste disposalDirect emissions from burning offossil fuelsTransport: Company owned orleased vehiclesBusiness travel on public transportand private vehicles used forcompany businessTotal grid electricity used by company:transmission and distribution1%2%2%17%4%6%2014 – <strong>2015</strong>(tCO 2 e)Direct emissions from burning of fossil14,435fuels9,5259,575Process emissions from our treatment101,99290,509 115,250 82,421plants – including refrigerants83,762 104,041Transport: company owned or leasedvehicles10,306 10,046 10,704Total grid electricity purchased by thecompany: generation333,774 333,774 298,768 298,768 321,185 321,185Total grid electricity purchasedby the company: transmission and 26,36725,54628,086distributionBusiness travel on public transport54,20348,281and private vehicles used for company 2,613 2,860 2,97148,482businessEmissions from sludge and processwaste disposal25,223 19,875 17,425Gross carbon footprint total 503,226 449,042 473,708Emissions per £million turnover 307.60 263.44 275.4468%SHAREHOLDER INFORMATION FINANCIAL STATEMENTS GOVERNANCESTRATEGIC REPORTEmission reductions from exportedrenewable electricity(3,993) (6,676) (6,155)Net carbon footprint total 499,233 442,366 467,553105
UNITED UTILITIES GROUP PLC ANNUAL REPORT AND FINANCIAL STATEMENTS <strong>2015</strong>Stock Code: UU.<strong>united</strong><strong>utilities</strong>.comDirectors’ <strong>report</strong>:other statutory informationDividendsOur directors are recommending a final dividend of 25.14 pence per ordinary share forthe year ended 31 March <strong>2015</strong>, which, together with the interim dividend of 12.56 pence,gives a total dividend for the year of 37.70 pence per ordinary share (the interim and finaldividends we paid in respect of the 2013/14 financial year were 12.01 pence and 24.03pence per ordinary share respectively). Subject to approval by our shareholders at ourAGM, our final dividend will be paid on 3 August <strong>2015</strong> to shareholders on the register atthe close of business on 26 June <strong>2015</strong>.DirectorsThe biographical details, together with the skills and experience of our directors whoserved during the financial year ended 31 March <strong>2015</strong>, can be found on pages 58 and 59.During the year, Nick Salmon retired from the board at our AGM on 25 July 2014 and weappointed Stephen Carter to the board on 1 September 2014.ReappointmentOur articles of association provide that our directors must retire at the third <strong>annual</strong>general meeting following their last election or reappointment by our shareholders.However, our board, being mindful of the recommendation contained within the UKCorporate Governance Code published in 2012 (‘the 2012 Code’) that all directors shouldbe subject to <strong>annual</strong> election by shareholders, has decided that all of our directors willretire at the <strong>2015</strong> AGM and offer themselves for election/reappointment, as happened atthe AGMs in 2011, 2012, 2013 and 2014. Information regarding the appointment of ourdirectors is included in our corporate governance <strong>report</strong> on pages 68 to 72.InterestsDetails of the interests in the company’s shares held by our directors and personsconnected with them are set out in our directors’ remuneration <strong>report</strong> on pages 84 to 103which is hereby incorporated by reference into this directors’ <strong>report</strong>.Corporate governancestatementThe corporate governance <strong>report</strong> on pages 57 to 103 is hereby incorporated by referenceinto this directors’ <strong>report</strong>. Further details of our compliance with the 2012 Code is given onpages 57 to 103. Our statement includes a description of the main features of our internalcontrol and risk management systems in relation to the financial <strong>report</strong>ing process andforms part of this directors’ <strong>report</strong>. A copy of the 2012 Code, as applicable to the companyfor the year ended 31 March <strong>2015</strong>, can be found at the Financial Reporting Council’s websitefrc.org.uk. Copies of the matters reserved to the board and the terms of reference for eachof the main board committees can be found on our website: corporate.<strong>united</strong><strong>utilities</strong>.comOur corporate governance statement also includes the consideration given by ourdirectors to the factors relevant to the adoption of the going concern basis of accountingand a long term viability statement. We can confirm that during the financial year2014/<strong>2015</strong> there have been no breaches of our anti-bribery and competition policies andno investigations or enforcement activity against us in respect of these matters.106
UNITED UTILITIES GROUP PLC ANNUAL REPORT AND FINANCIAL STATEMENTS <strong>2015</strong>Stock Code: UU.<strong>united</strong><strong>utilities</strong>.comShare capitalVotingTransfersMajor shareholdingsAt 31 March <strong>2015</strong>, the issued share capital of the company was £499,819,926 dividedinto 681,888,418 ordinary shares of five pence each and 273,956,180 deferred sharesof 170 pence each. Details of our share capital and movements in our issued share capitalare shown in note 22 to the financial statements on page 142. The ordinary sharesrepresented 71.3 per cent and the deferred shares represented 28.7 per cent respectivelyof the shares in issue as at 31 March <strong>2015</strong>.All our ordinary shares have the same rights, including the rights to one vote at any of ourgeneral meetings, to an equal proportion of any dividends we declare and pay, and to anequal amount of any surplus assets which are distributed in the event of a winding-up.Our deferred shares convey no right to income, no right to vote and no appreciable right toparticipate in any surplus capital in the event of a winding-up. The rights attaching to ourshares in the company are provided by our articles of association, which may be amended orreplaced by means of a special resolution of the company in general meeting. The companyrenews <strong>annual</strong>ly its power to issue and buy back shares at our AGM and such resolutionswill be proposed at our <strong>2015</strong> AGM. Our directors’ powers are conferred on them by UKlegislation and by the company’s articles. At the AGM of the company on 25 July 2014, thedirectors were authorised to issue relevant securities up to an aggregate nominal amount of£11,364,806 and were empowered to allot equity securities for cash on a non pre-emptivebasis to an aggregate nominal amount of £1,704,721.Electronic and paper proxy appointment and voting instructions must be received by ourregistrars (Equiniti) not less than 48 hours before a general meeting and when calculatingthis period, the directors can decide not to take account of any part of a day that is not aworking day.There are no restrictions on the transfer of our ordinary shares in the company, nor anylimitations on the holding of our shares in the company, save (i) where the company hasexercised its right to suspend their voting rights or to prohibit their transfer following theomission of their holder or any person interested in them to provide the company withinformation requested by it in accordance with Part 22 of the Companies Act 2006; or(ii) where their holder is precluded from exercising voting rights by the Financial ConductAuthority’s Listing Rules or the City Code on Takeovers and Mergers.There are no agreements known to us between holders of securities that may result inrestrictions on the transfer of securities or on voting rights. All our issued shares are fully paid.At 20 May <strong>2015</strong>, our directors had been notified of the following interests in thecompany’s issued ordinary share capital in accordance with the Disclosure andTransparency Rules of the Financial Conduct Authority:Per cent ofissued sharecapitalDirect or indirectnature of holdingBlackRock Inc 5.13 indirectSHAREHOLDER INFORMATION FINANCIAL STATEMENTS GOVERNANCESTRATEGIC REPORT107
UNITED UTILITIES GROUP PLC ANNUAL REPORT AND FINANCIAL STATEMENTS <strong>2015</strong>Stock Code: UU.<strong>united</strong><strong>utilities</strong>.comDirectors’ <strong>report</strong>:other statutory informationPurchase of own sharesAt our last AGM held on 25 July 2014, our shareholders authorised the company topurchase, in the market, up to 68,188,841 of our ordinary shares of five pence each. Wedid not purchase any shares under this authority during the year. We normally seek such anauthority from our shareholders <strong>annual</strong>ly. At our <strong>2015</strong> AGM, we will seek authority fromour shareholders to purchase up to 68,188,841 of our ordinary shares of five pence eachwith such authority expiring at the end of our AGM held in 2016.Change of controlAs at 31 March <strong>2015</strong>, Equiniti Trust (Jersey) Limited was the trustee that administeredour executive share plans and had the ability to exercise voting rights at its discretionwhich related to shares that it held under the trust deed constituting the trust. In the eventof a takeover offer which could lead to a change of control of the company, the trusteemust consult with the company before accepting the offer or voting in favour of theoffer. Subject to that requirement, the trustee may take into account a prescribed list ofinterests and considerations prior to making a decision in relation to the offer, includingthe interests of the beneficiaries under the trust.In the event of a change of control, the participants in our share incentive plan (ShareBuy)would be able to direct the trustee of the share incentive plan, Equiniti Share Plan TrusteesLimited, how to act on their behalf.Information required by UKlisting rule 9.8.4Directors’ indemnitiesand insuranceDetails of the amount of interest capitalised by the group during the financial year canbe found in note 5 to the financial statements on page 130. In line with current UK taxlegislation, the amount is fully deductible against the group’s corporation tax liabilityresulting in tax relief of £4.4 million.There are no other disclosures to be made under listing rule 9.8.4.We have in place contractual entitlements for the directors of the company and of itssubsidiaries to claim indemnification by the company in respect of certain liabilities whichmight be incurred by them in the course of their duties as directors. These arrangements,which constitute qualifying third party indemnity provision and qualifying pension schemeindemnity provision, have been established in compliance with the relevant provisions ofthe Companies Act 2006 and have been in force throughout the financial year. They includeprovision for the company to fund the costs incurred by directors in defending certain claimsagainst them in relation to their duties as directors of the company or its subsidiaries. Thecompany also maintains an appropriate level of directors’ and officers’ liability insurance.Political donationsWe do not support any political party and do not make what are commonly regardedas donations to any political party or other political organisations. However, the widedefinition of donations in the Political Parties, Elections and Referendums Act 2000 coversactivities which form part of the necessary relationship between the group and our politicalstakeholders. This includes promoting United Utilities’ activities at the main political parties’<strong>annual</strong> conferences, and occasional stakeholder engagement in Westminster.The period 2014/15 saw us engage with our stakeholders along a number of policy themesas the Water Bill made its way through Parliament and Market Reform planning continued.The group incurred expenditure of £21,600 (2014: £12,235) as part of this process. At the2014 AGM, an authority was taken to cover such expenditure. A similar resolution will beput to our shareholders at the <strong>2015</strong> AGM to authorise the company and its subsidiaries tomake such expenditure.108
UNITED UTILITIES GROUP PLC ANNUAL REPORT AND FINANCIAL STATEMENTS <strong>2015</strong>Stock Code: UU.<strong>united</strong><strong>utilities</strong>.comEmployeesEnvironmental, socialand community mattersEssential contractualrelationshipsApproach to technologydevelopmentFinancial instrumentsProperty, plant andequipmentEvents occurring afterthe <strong>report</strong>ing periodOur policies on employee consultation and on equal opportunities for our disabled employeescan be found in the ‘Our responsible approach to doing business’ section on page 20. Thecompany’s business principles make clear how it and all our employees must seek to act withintegrity and fairness and observe legal requirements. Anyone with serious concerns thatthe company may not be adhering to these principles is encouraged to speak up via their linemanager or through a confidential telephone line.Importance is placed on strengthening employees’ engagement, measuring their views <strong>annual</strong>ly, thentaking action to improve how they feel about the company and understand its direction. Employees areprovided with regular information to enable them to understand the financial and economic factorsaffecting the company’s performance. The board encourages employees to own shares in the companythrough the all employee share incentive plan (ShareBuy). For further information on our averagenumber of employees during the year, go to page 128.Details of our approach to corporate responsibility, relating to the environment and social andcommunity issues, can be found in the ‘Our responsible approach to doing business’ sectionon page 20.Certain suppliers we use contribute key goods or services, the loss of which could causedisruption to our services. However, none are so vital that their loss would affect our viability asa group as a whole nor are we overly dependent on any one individual customer.We are committed to using innovative, cost-effective and practical solutions for providing highquality services and we recognise the importance of ensuring that we focus our investmenton the development of technology and that we have the right skills to apply technology toachieve sustainable competitive advantage and also that we continue to be alert to emergingtechnological opportunities.Our risk management objectives and policies in relation to the use of financial instruments canbe found in note A3 to the financial statements.The group holds significant land assets; however, the vast majority of these are water catchmentassets which are an integral and essential part of the operation of the group’s regulatedbusiness. The nature of these assets, which are primarily moorland areas and which could not besold by the group, means that it is impracticable to obtain meaningful market values for the land.Other land owned by the group, the majority of which relates to operational sites, does not havea market value materially different from historic cost.Details of events after the <strong>report</strong>ing period are included in note 25 to the consolidated financialstatements on page 143.SHAREHOLDER INFORMATION FINANCIAL STATEMENTS GOVERNANCESTRATEGIC REPORT109
UNITED UTILITIES GROUP PLC ANNUAL REPORT AND FINANCIAL STATEMENTS <strong>2015</strong>Stock Code: UU.<strong>united</strong><strong>utilities</strong>.comDirectors’ <strong>report</strong>:other statutory informationTotal dividend per share37.70pfor 2014/15(2013/14: 36.04p per share)Annual general meetingOur <strong>2015</strong> <strong>annual</strong> generalmeeting (AGM) will beheld on 24 July <strong>2015</strong>Full details of the resolutions to be proposed to our shareholders, andexplanatory notes in respect of these resolutions, can be found in our noticeof AGM. A copy can be found on our website corporate.<strong>united</strong><strong>utilities</strong>.com/<strong>annual</strong>-general-meeting-<strong>2015</strong>At our <strong>2015</strong> AGM, resolutions will beproposed, amongst other matters:• to receive the <strong>annual</strong> <strong>report</strong> andfinancial statements; to approvethe directors’ remuneration <strong>report</strong>;to declare a final dividend; and toreappoint KPMG LLP as auditor.• In addition, resolutions will beproposed: to approve our directors’general authority to allot shares; togrant the authority to issue shareswithout first applying statutoryrights of pre-emption; to authorisethe company to make marketpurchases of its own shares; toauthorise the making of limitedpolitical donations by the companyand its subsidiaries; and to enablethe company to continue to holdgeneral meetings on not less than14 working days’ noticeInformation given to the auditorEach of the persons who is a directorat the date of approval of this <strong>report</strong>confirms that:• so far as he or she is aware, thereis no relevant audit informationof which the company’s auditor isunaware; and• he or she has taken all the stepsthat he/she ought to have taken asa director in order to make himself/herself aware of any relevant auditinformation and to establish thatthe company’s auditor is aware ofthat information. This confirmationis given, and should be interpreted,in accordance with the provisions ofs418 of the Companies Act 2006.Reappointment of the auditorOur board is proposing that ourshareholders reappoint KPMG LLP asour auditor at the forthcoming AGMand authorises the audit committeeof the board to set the auditor’sremuneration.Approved by the board on 20 May <strong>2015</strong>and signed on its behalf by:Simon GardinerCompany Secretary110
UNITED UTILITIES GROUP PLC ANNUAL REPORT AND FINANCIAL STATEMENTS <strong>2015</strong>Stock Code: UU.<strong>united</strong><strong>utilities</strong>.comStatement of directors’ responsibilitiesin respect of the <strong>annual</strong> <strong>report</strong> and thefinancial statementsThe directors are responsible forpreparing the <strong>annual</strong> <strong>report</strong> and thegroup and parent company financialstatements in accordance withapplicable laws and regulations.Company law requires the directorsto prepare group and parent companyfinancial statements for eachfinancial year. Under that law theyare required to prepare the groupfinancial statements in accordancewith International Financial ReportingStandards (IFRSs) as adopted by theEuropean Union (EU) and applicablelaw and have elected to prepare theparent company financial statementson the same basis.Under company law the directors mustnot approve the financial statementsunless they are satisfied that theygive a true and fair view of the stateof affairs of the group and parentcompany and of their profit or loss forthat period. In preparing each of thegroup and parent company financialstatements, the directors are requiredto:• select suitable accounting policiesand then apply them consistently;• make judgements and estimatesthat are reasonable and prudent;• state whether they have beenprepared in accordance with IFRSsas adopted by the EU; and• prepare the financial statements onthe going concern basis unless it isinappropriate to presume that thegroup and the parent company willcontinue in business.The directors are responsible forkeeping adequate accounting recordsthat are sufficient to show and explainthe parent company’s transactions anddisclose with reasonable accuracy atany time the financial position of theparent company and enable them toensure that its financial statementscomply with the Companies Act 2006.They have general responsibility fortaking such steps as are reasonablyopen to them to safeguard the assetsof the group and to prevent and detectfraud and other irregularities.Under applicable law and regulations,the directors are also responsible forpreparing a strategic <strong>report</strong>, directors’<strong>report</strong>, directors’ remuneration <strong>report</strong>and corporate governance statementthat complies with that law and thoseregulations.The directors are responsible forthe maintenance and integrity of thecorporate and financial informationincluded on the company’s website.Legislation in the UK governing thepreparation and dissemination offinancial statements may differ fromlegislation in other jurisdictions.Responsibility statement of thedirectors in respect of the <strong>annual</strong>financial <strong>report</strong>We confirm that to the best of ourknowledge:• the financial statements, preparedin accordance with the applicableset of accounting standards, givea true and fair view of the assets,liabilities, financial position andprofit or loss of the company andthe undertakings included in theconsolidation taken as a whole;• the strategic <strong>report</strong> (containedon pages 4 to 55) includes a fairreview of the development andperformance of the business andthe position of the issuer andthe undertakings included in theconsolidation taken as a whole,together with a description of theprincipal risks and uncertaintiesthat they face; and• the directors consider the <strong>annual</strong><strong>report</strong>, taken as a whole, is fair,balanced and understandable andprovides the information necessaryfor shareholders to assess thegroup’s position, performance,business model and strategy.Approved by the board on 20 May<strong>2015</strong> and signed on its behalf by:Dr John McAdamChairmanRuss HouldenChief Financial OfficerSHAREHOLDER INFORMATION FINANCIAL STATEMENTS GOVERNANCESTRATEGIC REPORT111
OutstandingWe live and work in a beautiful part of the world.And we’re proud to have the responsibility tohelp keep it that way
FINANCIALSTATEMENTSThe full audited financial results for the yearare presented here.Independent auditor’s <strong>report</strong> 114Consolidated income statement 118Consolidated statement ofcomprehensive income 119Consolidated and companystatements of financial position 120Consolidated statement of changes in equity 121Company statement of changes in equity 122Consolidated and companystatements of cash flows 123Accounting policies 124Notes to the financial statements 127
UNITED UTILITIES GROUP PLC ANNUAL REPORT AND FINANCIAL STATEMENTS <strong>2015</strong>Stock Code: UU.<strong>united</strong><strong>utilities</strong>.comIndependent auditor’s <strong>report</strong>to the members of United Utilities Group PLC onlyOpinions and conclusions arising from our audit1. Our opinion on the financial statements is unmodifiedWe have audited the financial statements of United Utilities Group PLC for the year ended 31 March <strong>2015</strong> set out on pages118 to 162. In our opinion:• the financial statements give a true and fair view of the state of the group’s and of the parent company’s affairs as at31 March <strong>2015</strong> and of the group’s profit for the year then ended;• the group financial statements have been properly prepared in accordance with International Financial ReportingStandards as adopted by the European Union (IFRSs as adopted by the EU);• the parent company financial statements have been properly prepared in accordance with IFRSs as adopted by the EU andas applied in accordance with the provisions of the Companies Act 2006; and• the financial statements have been prepared in accordance with the requirements of the Companies Act 2006 and, asregards the group financial statements, Article 4 of the IAS Regulation.2. Our assessment of risks of material misstatementIn arriving at our audit opinion above on the financial statements, the risks of material misstatement that had the greatesteffect on our audit were as follows:Capitalisation of costs relating to the capital programme (£728.5 million)Refer to page 79 audit committee <strong>report</strong>, page 125 accounting policies and note 10 financial disclosures.The riskThe group has a substantial capital programme which hasbeen agreed with the Water Services Regulation Authority(Ofwat) and therefore incurs significant <strong>annual</strong> expenditurein relation to the development and maintenance of bothinfrastructure and non-infrastructure assets. Expenditurein relation to increasing the capacity or enhancing thenetwork is treated as capital expenditure. Expenditureincurred in maintaining the operating capability of thenetwork is expensed in the year in which it is incurred. Capitalprojects often contain a combination of enhancement andmaintenance activity which are not distinct and thereforethe allocation of costs between capital and operatingexpenditure is inherently judgemental. Within the costs ofthe capital programme is an allocation of overhead relatingto the proportion of time that the group’s support functionsspend which relates directly to the capital programme. Thisallocation is also inherently judgemental. For these reasonsthere remains a risk that capital and operating expendituremay be significantly misstated and so the group’s capitalprogramme is an area of focus for our work.Our responseIn this area our principal audit procedures included thefollowing:• we assessed the group’s capitalisation policy forcompliance with relevant accounting standards;• we tested controls over the application of the policy tospend incurred on projects within the capital programmein the period including attending capital approvalmeetings to observe the judgements made; for asample of capital projects we assessed the appropriateapplication of the capitalisation policy to actual spendincurred;• we assessed, also for a sample of projects, variances inactual expenditure to budgeted capital and operatingexpenditure and where significant variances wereidentified we tested the proportionate allocation of costsbetween capital and operating expenditure;• we agreed overhead costs incurred to supportingdocumentation on a sample basis and performedcomparative analysis of overheads absorbed into capitalprojects by category to assess consistency with the policyand with prior years; and• we tested a sample of capital accruals to assess theexistence and accuracy of the costs being capitalised.We also assessed the adequacy of the group’s disclosures ofits capitalisation policy and other related disclosures.114
UNITED UTILITIES GROUP PLC ANNUAL REPORT AND FINANCIAL STATEMENTS <strong>2015</strong>Stock Code: UU.<strong>united</strong><strong>utilities</strong>.comRevenue recognition (£1,720.2 million) and provision for customer debts (£100.5 million)Refer to page 79 audit committee <strong>report</strong>, page 125 accounting policies, and note 15 financial disclosures.The riskRevenue recognition remains one of the key judgementalareas for the audit, particularly in relation to:• the estimate of the revenue value of water supplied tometered customers between the last meter reading and theperiod end; and• supplies to properties where there is little prospect ofrevenue being realised through the occupier not being ableto be identified or due to a past history of non-payment ofbills relating to that property.A proportion of the group’s customers do not or cannot paytheir bills which results in the need for provisions to be madefor non-payment of the customer balance. Due to the levelof judgement and the complexity of the calculation whichcould lead to revenue and provision for customer debt beingmisstated, this is considered a key audit risk.Our responseIn this area our principal audit procedures included thefollowing:• we assessed whether appropriate revenue recognitionpolicies are applied through comparison with relevantaccounting standards and industry practice, includingthe policy of not recognising revenue where there is littleprospect of revenue being realised;• we tested the group’s controls over revenue recognition,including reconciliations between sales and cash receiptssystems and the general ledger;• we recalculated the metered accrued income calculationwith the support of our own modelling specialists;• we assessed the appropriateness of the customer debtprovisioning policy based on historical cash collections,credits, re-bills and write off information which weassessed through testing the data in the billing systemand analysed by comparing the data to that which wecollect independently across the industry;• we assessed the extent to which historical trends aretaken into account and applied in the customer debtprovision calculation; and• we remodelled the customer debt provision calculation toassess the mathematical accuracy with the support of ourown modelling specialists.We also assessed the adequacy of the group’s disclosuresof its revenue recognition, customer debt provisioningpolicy, disclosures in relation to the estimation uncertaintyinvolved in calculating the provision and other relateddisclosures.Retirement benefit surplus (£79.2 million)Refer to page 80 audit committee <strong>report</strong>, page 126 accounting policies and notes 18 and A4 financial disclosures.The riskSignificant estimates are made in valuing the group’sretirement benefit surplus. Small changes in assumptionsand estimates used to value the group’s net pension surplus(2014: deficit) would have a significant effect on the group’sfinancial position.Our responseOur principal audit procedures included the following: wetested the controls over the maintenance of the schemes’membership data and we challenged the key assumptionssupporting the group’s retirement benefit surplus valuationwith input from our own actuarial specialists, comparing thediscount rate, inflation rate, salary, pension increase ratesand life expectancy assumptions used against externallyderived data. We also assessed the group’s disclosure inrespect of the sensitivity of the surplus to changes in thekey assumptions.STRATEGIC REPORTSHAREHOLDER INFORMATION FINANCIAL STATEMENTSGOVERNANCE115
UNITED UTILITIES GROUP PLC ANNUAL REPORT AND FINANCIAL STATEMENTS <strong>2015</strong>Stock Code: UU.<strong>united</strong><strong>utilities</strong>.comIndependent auditor’s <strong>report</strong>to the members of United Utilities Group PLC onlyDerivative financial instrument valuations (£477.4 million)Refer to page 80 audit committee <strong>report</strong>, page 126 accounting policies, and note A3 financial disclosures.The riskThe group has significant derivative financial instruments,the valuation of which is determined through the applicationof valuation techniques which often involve the exercise ofjudgement and the use of assumptions and estimates. Dueto the significance of financial instruments and the relatedestimation uncertainty, this is considered a key audit risk.Our responseOur audit procedures included the following:• we assessed controls over the identification,measurement and management of derivative financialinstruments and assessed the methodologies, inputs andassumptions used by the group in determining fair values;• we compared observable inputs into valuation modelssuch as quoted prices to externally available market data;and• we recalculated valuations utilising our own valuationspecialists.Additionally, we assessed whether the financial statementdisclosures of fair value risks and sensitivities appropriatelyreflect the group’s exposure to valuation risk.3. Our application of materiality and an overview of the scope of our auditIn establishing the overall audit strategy and performing the audit, materiality for the group financial statements as a wholewas set at £25.0 million, determined with reference to a benchmark of group profit before taxation, normalised to excludenet fair value losses on debt and derivative instruments, of £104.7 million, of which it represents 5.6 per cent.We <strong>report</strong> to the audit committee any corrected or uncorrected identified misstatements exceeding £0.5 million, in additionto other identified misstatements that warranted <strong>report</strong>ing on qualitative grounds.The group consists of five <strong>report</strong>ing components, of which the most significant is United Utilities Water Limited whichmakes up the vast majority of the assets, liabilities, income and expense of the group. Audits for group <strong>report</strong>ing purposeswere performed by the group audit team of four of the five components, using component materialities which ranged from£1.8 million for the smallest component to £24.0 million for United Utilities Water Limited, determined having regard to themix of size and risk profile of the group across the components. These audits covered 99 per cent of group revenue,100 per cent of group profit before taxation and 99 per cent of group total assets.4. Our opinion on the other matter prescribed by the Companies Act 2006 is unmodifiedIn our opinion:• the part of the directors’ remuneration <strong>report</strong> to be audited has been properly prepared in accordance with the CompaniesAct 2006;• the information given in the strategic <strong>report</strong> and the directors’ <strong>report</strong> for the financial year for which the financialstatements are prepared is consistent with the financial statements; and• information given in the corporate governance statement set out on pages 58 to 103 with respect to internal control andrisk management systems in relation to financial <strong>report</strong>ing processes and about share capital structures is consistentwith the financial statements.116
UNITED UTILITIES GROUP PLC ANNUAL REPORT AND FINANCIAL STATEMENTS <strong>2015</strong>Stock Code: UU.<strong>united</strong><strong>utilities</strong>.com5. We have nothing to <strong>report</strong> in respect of the matters on which we are required to <strong>report</strong> by exceptionUnder International Standards on Auditing (UK and Ireland) (ISAs) we are required to <strong>report</strong> to you if, based on theknowledge we acquired during our audit, we have identified other information in the <strong>annual</strong> <strong>report</strong> that contains a materialinconsistency with either that knowledge or the financial statements, a material misstatement of fact, or that is otherwisemisleading.In particular, we are required to <strong>report</strong> to you if:• we have identified material inconsistencies between the knowledge we acquired during our audit and the directors’statement that they consider that the <strong>annual</strong> <strong>report</strong> and financial statements taken as a whole is fair, balanced andunderstandable and provides the information necessary for shareholders to assess the group’s performance, businessmodel and strategy; or• the audit committee section of the corporate governance <strong>report</strong> does not appropriately address matters communicatedby us to the audit committee.Under the Companies Act 2006 we are required to <strong>report</strong> to you if, in our opinion:• adequate accounting records have not been kept by the parent company, or returns adequate for our audit have not beenreceived from branches not visited by us; or• the parent company financial statements and the part of the directors’ remuneration <strong>report</strong> to be audited are not inagreement with the accounting records and returns; or• certain disclosures of directors’ remuneration specified by law are not made; or• we have not received all the information and explanations we require for our audit; or• a corporate governance statement has not been prepared by the company.Under the Listing Rules we are required to review:• the directors’ statement, set out on page 75, in relation to going concern; and• the part of the corporate governance statement on pages 58 to 103 relating to the company’s compliance with the 10provisions of the 2012 UK Corporate Governance Code specified for our review.We have nothing to <strong>report</strong> in respect of the above responsibilities.Scope of responsibilitiesAs explained more fully in the directors’ responsibilities statement set out on page 111, the directors are responsiblefor the preparation of the financial statements and for being satisfied that they give a true and fair view. A descriptionof the scope of an audit of financial statements is provided on the Financial Reporting Council’s website at www.frc.org.uk/auditscopeukprivate. This <strong>report</strong> is made solely to the company’s members as a body and is subject toimportant explanations and disclaimers regarding our responsibilities, published on our website at www.kpmg.com/uk/auditscopeukco2014a, which are incorporated into this <strong>report</strong> as if set out in full and should be read to provide anunderstanding of the purpose of this <strong>report</strong>, the work we have undertaken and the basis of our opinions.John Luke (Senior Statutory Auditor)for and on behalf of KPMG LLPStatutory AuditorChartered AccountantsOne St Peter’s SquareManchesterM2 3AE20 May <strong>2015</strong>STRATEGIC REPORTSHAREHOLDER INFORMATION FINANCIAL STATEMENTSGOVERNANCE117
UNITED UTILITIES GROUP PLC ANNUAL REPORT AND FINANCIAL STATEMENTS <strong>2015</strong>Stock Code: UU.<strong>united</strong><strong>utilities</strong>.comConsolidated income statementfor the year ended 31 MarchNote<strong>2015</strong>£mRestated*2014£mContinuing operationsRevenue 1 1,720.2 1,688.8Employee benefits expense:excluding restructuring costs 2 (134.1) (129.3)restructuring costs 2 (11.0) (4.4)Total employee benefits expense 2 (145.1) (133.7)Other operating costs 3 (424.3) (425.6)Other income 3 3.3 2.7Depreciation and amortisation expense 3 (352.6) (336.9)Infrastructure renewals expenditure (148.2) (165.1)Total operating expenses (1,066.9) (1,058.6)Operating profit 653.3 630.2Investment income 4 1.0 6.8Finance expense 5 (317.8) (98.7)Investment income and finance expense (316.8) (91.9)Share of profits of joint ventures 5.1 5.0Profit before taxation 341.6 543.3Current taxation (charge)/credit 6 (47.1) 65.7Deferred taxation charge 6 (23.3) (27.2)Deferred taxation credit – change in taxation rate 6 – 156.8Taxation 6 (70.4) 195.3Profit after taxation from continuing operations 271.2 738.6Discontinued operationsProfit after taxation from discontinued operations 7 – 0.8Profit after taxation 271.2 739.4Earnings per sharefrom continuing and discontinued operationsBasic 8 39.8p 108.4pDiluted 8 39.7p 108.2pEarnings per sharefrom continuing operationsBasic 8 39.8p 108.3pDiluted 8 39.7p 108.1pDividend per ordinary share 9 37.70p 36.04p* The comparatives have been restated to reflect the requirements of IFRS 11 ‘Joint Arrangements’. See accounting policies page 124 for details.118
UNITED UTILITIES GROUP PLC ANNUAL REPORT AND FINANCIAL STATEMENTS <strong>2015</strong>Stock Code: UU.<strong>united</strong><strong>utilities</strong>.comConsolidated statement of comprehensive incomefor the year ended 31 MarchProfit after taxation 271.2 739.4Other comprehensive incomeRemeasurement gains/(losses) on defined benefit pension schemes 18 250.5 (200.8)Taxation on items taken directly to equity 6 (50.1) 40.9Foreign exchange adjustments (3.1) (1.2)Total comprehensive income 468.5 578.3Note<strong>2015</strong>£m2014£mSTRATEGIC REPORTWith the exception of foreign exchange adjustments, none of the items in the table above will be prospectively reclassifiedto profit or loss.SHAREHOLDER INFORMATION FINANCIAL STATEMENTSGOVERNANCE119
UNITED UTILITIES GROUP PLC ANNUAL REPORT AND FINANCIAL STATEMENTS <strong>2015</strong>Stock Code: UU.<strong>united</strong><strong>utilities</strong>.comConsolidated and company statementsof financial positionat 31 March<strong>2015</strong>£mRestated*Group2014£m<strong>2015</strong>£mCompanyNoteASSETSNon-current assetsProperty, plant and equipment 10 9,716.3 9,318.5 – –Intangible assets 11 144.9 110.2 – –Interests in joint ventures 12 31.7 35.6 – –Investments 13 8.6 6.9 6,326.8 5,600.0Trade and other receivables 15 2.5 2.4 – –Retirement benefit surplus 18 79.2 – – –Derivative financial instruments A3 681.6 456.0 – –10,664.8 9,929.6 6,326.8 5,600.0Current assetsInventories 14 40.5 39.8 – –Trade and other receivables 15 353.3 330.4 61.2 56.3Cash and short-term deposits 16 244.0 115.8 – –Derivative financial instruments A3 1.0 56.9 – –638.8 542.9 61.2 56.3Total assets 11,303.6 10,472.5 6,388.0 5,656.3LIABILITIESNon-current liabilitiesTrade and other payables 21 (480.0) (451.0) – –Borrowings 17 (6,067.3) (5,929.2) (1,609.4) –Retirement benefit obligations 18 – (177.4) – –Deferred tax liabilities 19 (1,123.8) (1,050.4) – –Derivative financial instruments A3 (196.6) (52.3) – –(7,867.7) (7,660.3) (1,609.4) –Current liabilitiesTrade and other payables 21 (381.2) (382.1) (10.8) (10.1)Borrowings 17 (578.1) (112.3) (0.4) (1,584.3)Current tax liabilities (21.1) (34.8) – –Provisions 20 (12.5) (16.3) – –Derivative financial instruments A3 (8.6) (50.8) – –(1,001.5) (596.3) (11.2) (1,594.4)Total liabilities (8,869.2) (8,256.6) (1,620.6) (1,594.4)Total net assets 2,434.4 2,215.9 4,767.4 4,061.9EQUITYCapital and reserves attributable to equity holders of the companyShare capital 22 499.8 499.8 499.8 499.8Share premium account 2.9 2.9 2.9 2.9Other reserve – 158.8 – –Cumulative exchange reserve (8.7) (5.6) – –Capital redemption reserve – – 1,033.3 1,033.3Merger reserve 329.7 329.7 – –Retained earnings 1,610.7 1,230.3 3,231.4 2,525.9Shareholders’ equity 2,434.4 2,215.9 4,767.4 4,061.9* The comparatives have been restated to reflect the requirements of IFRS 11 ‘Joint Arrangements’. See accounting policies page 124 for details.These financial statements for the group and United Utilities Group PLC (company number: 6559020) were approved by theboard of directors on 20 May <strong>2015</strong> and signed on its behalf by:2014£mSteve MogfordChief Executive OfficerRuss HouldenChief Financial Officer120
UNITED UTILITIES GROUP PLC ANNUAL REPORT AND FINANCIAL STATEMENTS <strong>2015</strong>Stock Code: UU.<strong>united</strong><strong>utilities</strong>.comConsolidated statement of changes in equityfor the year ended 31 MarchSharecapital£mSharepremiumaccount£mOtherreserve£mCumulativeexchangereserve£mMergerreserve£mRetainedearnings£mAt 1 April 2014 499.8 2.9 158.8 (5.6) 329.7 1,230.3 2,215.9Profit after taxation – – – – – 271.2 271.2Other comprehensive (expense)/incomeRemeasurement gains on defined benefit pensionschemes (see note 18) – – – – – 250.5 250.5Taxation on items taken directly to equity(see note 6) – – – – – (50.1) (50.1)Foreign exchange adjustments – – – (3.1) – – (3.1)Total comprehensive (expense)/income – – – (3.1) – 471.6 468.5Dividends (see note 9) – – – – – (249.4) (249.4)Transfer of other reserve – – (158.8) – – 158.8 –Equity-settled share-based payments (see note 2) – – – – – 2.9 2.9Exercise of share options – purchase of shares – – – – – (3.5) (3.5)At 31 March <strong>2015</strong> 499.8 2.9 – (8.7) 329.7 1,610.7 2,434.4Sharecapital£mSharepremiumaccount£mOtherreserve£mCumulativeexchangereserve£mMergerreserve£mRetainedearnings£mAt 1 April 2013 499.8 2.9 158.8 (4.4) 329.7 885.1 1,871.9Profit after taxation – – – – – 739.4 739.4Other comprehensive (expense)/incomeRemeasurement losses on defined benefit pensionschemes (see note 18) – – – – – (200.8) (200.8)Taxation on items taken directly to equity(see note 6) – – – – – 40.9 40.9Foreign exchange adjustments – – – (1.2) – – (1.2)Total comprehensive (expense)/income – – – (1.2) – 579.5 578.3Dividends (see note 9) – – – – – (237.9) (237.9)Equity-settled share-based payments (see note 2) – – – – – 4.4 4.4Exercise of share options – purchase of shares – – – – – (0.8) (0.8)At 31 March 2014 499.8 2.9 158.8 (5.6) 329.7 1,230.3 2,215.9On the group’s transition to IFRS in the year ended 31 March 2006, the other reserve arose from the uplift to fair value ofthe infrastructure assets. This reserve is a component of retained earnings and, as such, has been transferred and presentedwithin retained earnings during the year.The merger reserve arose in the year ended 31 March 2009 on consolidation and represents the capital adjustment toreserves required to effect the reverse acquisition of United Utilities PLC by United Utilities Group PLC.Total£mTotal£mSTRATEGIC REPORTSHAREHOLDER INFORMATION FINANCIAL STATEMENTSGOVERNANCE121
UNITED UTILITIES GROUP PLC ANNUAL REPORT AND FINANCIAL STATEMENTS <strong>2015</strong>Stock Code: UU.<strong>united</strong><strong>utilities</strong>.comCompany statement of changes in equityfor the year ended 31 MarchSharecapital£mSharepremiumaccount£mCapitalredemptionreserve£mRetainedearnings£mAt 1 April 2014 499.8 2.9 1,033.3 2,525.9 4,061.9Profit after taxation – – – 955.5 955.5Total comprehensive income – – – 955.5 955.5Dividends (see note 9) – – – (249.4) (249.4)Equity-settled share-based payments (see note 2) – – – 2.9 2.9Exercise of share options – purchase of shares – – – (3.5) (3.5)At 31 March <strong>2015</strong> 499.8 2.9 1,033.3 3,231.4 4,767.4Total£mSharecapital£mSharepremiumaccount£mCapitalredemptionreserve£mRetainedearnings£mAt 1 April 2013 499.8 2.9 1,033.3 2,536.9 4,072.9Profit after taxation – – – 223.3 223.3Total comprehensive income – – – 223.3 223.3Dividends (see note 9) – – – (237.9) (237.9)Equity-settled share-based payments (see note 2) – – – 4.4 4.4Exercise of share options – purchase of shares – – – (0.8) (0.8)At 31 March 2014 499.8 2.9 1,033.3 2,525.9 4,061.9Total£mAs permitted by section 408 of the Companies Act 2006, the company has not presented its own income statement. Theresults of the company for the financial year was a profit after taxation of £955.5 million (2014: £223.3 million) afteraccounting for a £726.8 million (2014: £nil) reversal of the impairment in the company’s investment in United Utilities PLCand dividends received from subsidiary undertakings of £249.4 million (2014: £237.9 million).122
UNITED UTILITIES GROUP PLC ANNUAL REPORT AND FINANCIAL STATEMENTS <strong>2015</strong>Stock Code: UU.<strong>united</strong><strong>utilities</strong>.comConsolidated and company statements of cash flowsfor the year ended 31 MarchNote<strong>2015</strong>£mRestated*Group2014£m<strong>2015</strong>£mCompanyOperating activitiesCash generated from continuing operations A2 941.7 931.9 256.1 237.7Interest paid (175.6) (168.7) (25.7) (25.6)Interest received and similar income 1.0 2.7 – –Tax paid (61.9) (64.2) – –Tax received 1.3 95.5 7.1 11.8Net cash generated from operating activities (continuingoperations) 706.5 797.2 237.5 223.9Net cash used in operating activities (discontinued operations) – (0.8) – –Investing activitiesPurchase of property, plant and equipment (665.7) (661.7) – –Purchase of intangible assets (63.4) (39.4) – –Proceeds from sale of property, plant and equipment 2.0 2.8 – –Grants and contributions received 21 18.1 16.4 – –Purchase of investments 13 (0.8) (1.9) – –Proceeds from sale of investments – 0.1 – –Dividends received from joint ventures 4.9 5.1 – –Net cash used in investing activities (continuing operations) (704.9) (678.6) – –Financing activitiesProceeds from borrowings 411.2 372.0 15.6 13.6Repayment of borrowings (19.1) (344.8) – –Dividends paid to equity holders of the company 9 (249.4) (237.9) (249.4) (237.9)Exercise of share options – purchase of shares (3.5) (0.8) (3.5) (0.8)Net cash generated from/(used in) financing activities(continuing operations) 139.2 (211.5) (237.3) (225.1)Net increase/(decrease) in cash and cash equivalents(continuing operations) 140.8 (92.9) 0.2 (1.2)Net decrease in cash and cash equivalents(discontinued operations) – (0.8) – –Cash and cash equivalents at beginning of the year 78.9 172.6 (0.6) 0.6Cash and cash equivalents at end of the year 16 219.7 78.9 (0.4) (0.6)* The comparatives have been restated to reflect the requirements of IFRS 11 ‘Joint Arrangements’. See accounting policies page 124 for details.2014£mSTRATEGIC REPORTSHAREHOLDER INFORMATION FINANCIAL STATEMENTSGOVERNANCE123
UNITED UTILITIES GROUP PLC ANNUAL REPORT AND FINANCIAL STATEMENTS <strong>2015</strong>Stock Code: UU.<strong>united</strong><strong>utilities</strong>.comAccounting policiesThe principal accounting policies adopted in the preparationof these financial statements are set out below.Basis of preparationThe financial statements have been prepared in accordancewith International Financial Reporting Standards (IFRSs)as adopted by the European Union (EU). These have beenprepared on the going concern basis and the directorshave set out factors considered in concluding theappropriateness of this presentation in the corporategovernance <strong>report</strong> on page 75.The financial statements have been prepared on thehistorical cost basis, except for the revaluation of financialinstruments, accounting for the transfer of assets fromcustomers and the revaluation of infrastructure assets tofair value on transition to IFRS.The preparation of financial statements, in conformitywith IFRS, requires management to make estimatesand assumptions that affect the amounts of assets andliabilities at the date of the financial statements and theamounts of revenues and expenses during the <strong>report</strong>ingperiods presented. Although these estimates are basedon management’s best knowledge of the amount, event oractions, actual results ultimately may differ from theseestimates.Adoption of new and revised standardsThe adoption of the following standards andinterpretations, at 1 April 2014, has had no material impacton the group’s financial statements. Had the standards notbeen applied in the current year, basic earnings per sharefrom continuing and discontinued operations would haveremained unchanged.IFRS 11 ‘Joint Arrangements’The standard replaces IAS 31 ‘Interests in Joint Ventures’and removes the option previously taken by the group toproportionately consolidate its joint ventures, requiringinstead the application of the equity method. Under theequity method, the group’s interests in the profit aftertaxation and net assets of its joint ventures are presentedas one line in the consolidated income statement and theconsolidated statement of financial position respectively.The application of the standard is retrospective and, hence,requires the restatement of the comparative period ended31 March 2014.The impact on the consolidated income statement, theconsolidated statement of financial position and theconsolidated statement of cash flows is detailed in thefollowing tables.Impact on the consolidated incomestatementYear ended31 March 2014£mDecrease in revenue (15.7)Decrease in total operating expenses 9.0Decrease in operating profit (6.7)Decrease in investment income and financeexpense 0.3Increase in share of profits of joint ventures 5.0Decrease in profit before taxation (1.4)Increase in taxation credit 1.4Net impact on profit after taxation –Impact on the consolidated statement offinancial position31 March 2014£mIncrease in interests in joint ventures* 35.6Decrease in other non-current assets (52.0)Decrease in current assets (19.2)Decrease in non-current liabilities 28.4Decrease in current liabilities 7.2Net impact on net assets –* Includes £4.9 million of goodwill previously <strong>report</strong>ed separately.Impact on the consolidated statement ofcash flowsYear ended31 March 2014£mDecrease in net cash generated fromoperating activities (8.1)Decrease in net cash used in investingactivities 6.5Net decrease in cash and cash equivalents (1.6)IFRS 10 ‘Consolidated Financial Statements’The standard builds on existing principles by identifying theconcept of control as the determining factor in whether anentity should be included within the consolidated accountsof the parent company. The standard provides additionalguidance to assist in the determination of control wherethis is difficult to assess.IFRS 12 ‘Disclosures of Interests in Other Entities’The standard includes disclosure requirements for allforms of interest in other entities, including subsidiaries,associates, joint arrangements and unconsolidatedstructured entities.Amendment to IAS 32 ‘Financial Instruments: Presentation’This amendment provides clarification on the application ofthe offsetting rules affecting financial assets and financialliabilities in the event that relevant offsetting transactionsoccur.IFRIC 21 ‘Levies’The standard clarifies that the obligating event that givesrise to a liability to pay a levy is the activity described in therelevant legislation that triggers the payment of the levy.124
UNITED UTILITIES GROUP PLC ANNUAL REPORT AND FINANCIAL STATEMENTS <strong>2015</strong>Stock Code: UU.<strong>united</strong><strong>utilities</strong>.comCritical accounting judgements and key sources ofestimation uncertaintyIn the process of applying its accounting policies, the groupis required to make certain estimates, judgements andassumptions that it believes are reasonable based on theinformation available. These judgements, estimates andassumptions affect the amounts of assets and liabilitiesat the date of the financial statements and the amountsof revenues and expenses recognised during the <strong>report</strong>ingperiods presented.On an ongoing basis, the group evaluates its estimatesusing historical experience, consultation with experts andother methods considered reasonable in the particularcircumstances. Actual results may differ significantlyfrom the estimates, the effect of which is recognised inthe period in which the facts that give rise to the revisionbecome known.The following paragraphs detail the estimates andjudgements the group believes to have the most significantimpact on the <strong>annual</strong> results under IFRS.Property, plant and equipmentThe group recognises property, plant and equipment (PPE)on its water and wastewater infrastructure assets wheresuch expenditure enhances or increases the capacity of thenetwork, whereas any expenditure classed as maintenanceis expensed in the period it is incurred. Determiningenhancement from maintenance expenditure is a subjectivearea, particularly when projects have both elementswithin them. In addition, management capitalise time andresources incurred by the group’s support functions oncapital programmes.The estimated useful economic lives of PPE are basedon management’s judgement and experience. Whenmanagement identifies that actual useful economic livesdiffer materially from the estimates used to calculatedepreciation, that charge is adjusted prospectively. Due tothe significance of PPE investment to the group, variationsbetween actual and estimated useful economic lives couldimpact operating results both positively and negatively,although historically few changes to estimated usefuleconomic lives have been required.The group is required to evaluate the carrying values ofPPE for impairment whenever circumstances indicate, inmanagement’s judgement, that the carrying value of suchassets may not be recoverable. An impairment reviewrequires management to make subjective judgementsconcerning the cash flows, growth rates and discount ratesof the cash generating units under review.Revenue recognition and allowance for doubtful receivablesThe group recognises revenue generally at the time ofdelivery and when collection of the resulting receivableis reasonably assured. When the group considers thatthe criteria for revenue recognition are not met for atransaction, revenue recognition is delayed until such timeas collectability is reasonably assured. Payments receivedin advance of revenue recognition are recorded as deferredincome.United Utilities Water Limited raises bills in accordancewith its entitlement to receive revenue in line with thelimits established by the periodic regulatory price reviewprocesses. For water and wastewater customers with watermeters, the receivable billed is dependent on the volumesupplied including the sales value of an estimate of theunits supplied between the date of the last meter readingand the billing date. Meters are read on a cyclical basis andthe group recognises revenue for unbilled amounts basedon estimated usage from the last billing through to each<strong>report</strong>ing date. The estimated usage is based on historicaldata, judgement and assumptions; actual results coulddiffer from these estimates, which would result in operatingrevenues being adjusted in the period that the revision tothe estimates is determined. For customers who do nothave a meter, the receivable billed and revenue recognisedis dependent on the rateable value of the property, asassessed by an independent rating officer.At each <strong>report</strong>ing date, the company and each of itssubsidiaries evaluate the recoverability of trade receivablesand record allowances for doubtful receivables based onexperience. These allowances are based on, amongst otherthings, a consideration of actual collection history. Theactual level of receivables collected may differ from theestimated levels of recovery, which could impact operatingresults positively or negatively.Provisions and contingenciesThe group is subject to a number of claims incidental to thenormal conduct of its business, relating to and includingcommercial, contractual and employment matters, which arehandled and defended in the ordinary course of business.The group routinely assesses the likelihood of any adversejudgements or outcomes to these matters as well as rangesof probable and reasonably estimated losses.Reasonable estimates involve judgements made bymanagement after considering information includingnotifications, settlements, estimates performed byindependent parties and legal counsel, available facts,identification of other potentially responsible parties andtheir ability to contribute, and prior experience. A provisionis recognised when it is probable that an obligation existsfor which a reliable estimate can be made after carefulanalysis of the individual matter. The required provisionmay change in the future due to new developments andas additional information becomes available. Mattersthat either are possible obligations or do not meet therecognition criteria for a provision are disclosed ascontingent liabilities in note 24, unless the possibility oftransferring economic benefits is remote.STRATEGIC REPORTSHAREHOLDER INFORMATION FINANCIAL STATEMENTSGOVERNANCE125
UNITED UTILITIES GROUP PLC ANNUAL REPORT AND FINANCIAL STATEMENTS <strong>2015</strong>Stock Code: UU.<strong>united</strong><strong>utilities</strong>.comAccounting policiesRetirement benefitsThe group operates two defined benefit schemes which areindependent of the group’s finances. Actuarial valuations ofthe schemes are carried out as determined by the trusteesat intervals of not more than three years. The pensioncost under IAS 19 ‘Employee Benefits’ is assessed inaccordance with the advice of a firm of actuaries based onthe latest actuarial valuation and assumptions determinedby the actuary. The assumptions are based on informationsupplied to the actuary by the company, supplementedby discussions between the actuary and management.The assumptions are disclosed in note A4. Profit beforetaxation and net assets are affected by the actuarialassumptions used. The key assumptions include: discountrates, pay growth, mortality and increases to pensions inpayment and deferred pensions, and may differ from actualresults due to changing market and economic conditionsand longer or shorter lives of participants.Derivative financial instrumentsThe model used to fair value the group’s derivative financialinstruments requires management to estimate future cashflows based on applicable interest rate curves. Projectedcash flows are then discounted back using discount factorswhich are derived from the applicable interest rate curvesadjusted for management’s estimate of counterparty andown credit risk, where appropriate.TaxationAssessing the outcome of uncertain tax positions requiresjudgements to be made regarding the application of tax lawand the result of negotiations with, and enquiries from, taxauthorities in a number of jurisdictions.For further information on accounting policies see note A6.Recently issued accounting pronouncementsAt the date of authorisation of these financial statements,the following relevant standards and interpretations werein issue but not yet effective. All of the standards in issuebut not yet effective have been endorsed by the EU exceptwhere noted. The directors anticipate that the groupwill adopt these standards and interpretations on theireffective dates.The directors anticipate that the adoption of the followingstandards and interpretations may have a material impacton the group’s financial statements.IFRS 9 ‘Financial Instruments’The standard is effective for periods commencing on orafter 1 January 2018 but has not yet been endorsed by theEU. Under the provisions of this standard, where the grouphas chosen to measure borrowings at fair value throughprofit or loss, the portion of the change in fair value due tochanges in the group’s own credit risk will be recognisedin other comprehensive income rather than within profitor loss. If this standard had been adopted in the currentyear, £4.6 million of losses would have been recognised inother comprehensive income rather than within the incomestatement.The standard also broadens the scope of what can beincluded within a hedge relationship, which may enable thegroup’s regulatory swaps to be designated within cash flowhedge relationships. If the standard had been adopted inthe current year, with all such swaps being designated andall hedges being fully effective, £133.5 million of fair valuelosses would have been recognised in other comprehensiveincome rather than within the income statement.The directors anticipate that the adoption of the followingstandards and interpretations will have no material impacton the group’s financial statements.Amendment to IAS 1 ‘Presentation of Financial Statements’This amendment represents the International AccountingStandard Board’s (IASB) first step in its disclosure initiative,is effective for periods commencing on or after 1 January2016, but has not yet been endorsed by the EU. The narrowfocusamendments clarify, rather than significantly change,existing requirements within the standard.IFRS 15 ‘Revenue from Contracts with Customers’This standard is effective for periods commencing on orafter 1 January 2017, but has not yet been endorsed bythe EU. The standard introduces a new revenue recognitionmodel and replaces IAS 18 ‘Revenue’, IAS 11 ‘ConstructionContracts’, IFRIC 13 ‘Customer Loyalty Programmes’,IFRIC 15 ‘Agreements for the Construction of Real Estate’,IFRIC 18 ‘Transfer of Assets from Customers’ and SIC-31 ‘Revenue - Barter Transactions Involving AdvertisingServices’.Improvements to IFRS 2014This is a collection of amendments to four standards aspart of the IASB’s programme of <strong>annual</strong> improvements.The improvements, issued in September 2014, are yetto be endorsed by the EU and are effective for periodscommencing on or after 1 January 2016.Improvements to IFRS (2012) and IFRS (2013)This is a collection of amendments to 11 standards aspart of the IASB’s programme of <strong>annual</strong> improvements.The improvements were issued in December 2013 and areeffective for periods commencing on or after 1 February<strong>2015</strong> and 1 January <strong>2015</strong> respectively.All other standards and interpretations, which are in issuebut not yet effective, are not considered relevant to theactivities of the group.126
UNITED UTILITIES GROUP PLC ANNUAL REPORT AND FINANCIAL STATEMENTS <strong>2015</strong>Stock Code: UU.<strong>united</strong><strong>utilities</strong>.comNotes to the financial statements1 REVENUE AND SEGMENT REPORTINGThe group’s revenue predominantly arises from the provision of services within the United Kingdom, with less than oneper cent of external revenue and non-current assets being overseas.The group has a large and diverse customer base and there is no significant reliance on any single customer.The board of directors of United Utilities Group PLC (the board) is provided with information on a single segment basis forthe purposes of assessing performance and allocating resources. The board reviews revenue, underlying operating profit(see page 44), operating profit, assets and liabilities, regulatory capital expenditure and regulatory capital value (RCV)gearing at a consolidated level. In light of this, the group has a single segment for financial <strong>report</strong>ing purposes and thereforeno further detailed segmental information is provided in this note.2 DIRECTORS AND EMPLOYEESDirectors’ remunerationFees to non-executive directors 0.6 0.6Salaries 1.1 1.1Benefits 0.3 0.3Bonus 0.6 0.6Share-based payment charge 1.3 1.43.9 4.0Further information about the remuneration of individual directors and details of their pension arrangements are providedin the directors’ remuneration <strong>report</strong> on pages 84 to 103.Remuneration of key management personnelSalaries and short-term employee benefits 5.9 5.6Post-employment benefits 0.2 0.3Share-based payment charge 2.4 2.58.5 8.4Key management personnel comprises all directors and certain senior managers who are members of the executive team.Employee benefits expense (including directors)Group<strong>2015</strong>£m<strong>2015</strong>£m<strong>2015</strong>£m2014£m2014£mRestated*2014£mContinuing operationsWages and salaries 206.5 204.1Social security 18.1 18.6Severance 6.6 4.4Post-employment benefits:Defined benefit pension expense (see note 18) 26.2 21.1Defined contribution pension costs (see note 18) 8.8 8.135.0 29.2Charged to regulatory capital schemes (121.1) (122.6)Employee benefits expense attributable to continuing operations 145.1 133.7* The comparatives have been restated to reflect the requirements of IFRS 11 ‘Joint Arrangements’. See accounting policies page 124 for details.Within employee benefits expense were £11.0 million (2014: £4.4 million) of restructuring costs.STRATEGIC REPORTSHAREHOLDER INFORMATION FINANCIAL STATEMENTSGOVERNANCEThe total expense included within employee benefits expense from continuing operations in respect of equity-settledshare-based payments was £2.9 million (2014: £4.4 million). The company operates several share option schemes, details ofwhich are given on pages 84 to 103 in the directors’ remuneration <strong>report</strong>. Further disclosures have not been included as theyare considered immaterial to the assessment of the share-based payments charge.127
UNITED UTILITIES GROUP PLC ANNUAL REPORT AND FINANCIAL STATEMENTS <strong>2015</strong>Stock Code: UU.<strong>united</strong><strong>utilities</strong>.comNotes to the financial statements2 DIRECTORS AND EMPLOYEES continuedAverage number of employees during the year (full-time equivalent including directors)<strong>2015</strong>number2014numberContinuing operations 5,278 5,329CompanyThe company has no employees.3 OPERATING PROFITThe following items have been charged/(credited) to the income statement in arriving at the group’s operating profit fromcontinuing operations:<strong>2015</strong>£mRestated*2014£mOther operating costsHired and contracted services 87.3 85.8Property rates 80.5 86.2Power 68.2 63.3Materials 58.5 50.4Charge for bad and doubtful receivables (see note 15) 52.9 37.1Regulatory fees 29.2 36.2Accommodation 7.0 6.7Loss on disposal of property, plant and equipment 5.1 6.4Legal and professional 4.2 5.0Operating leases payable:Property 3.7 3.6Plant and equipment 0.7 0.8Research and development 2.1 2.4Cost of properties disposed 0.6 3.9Loss on disposal of intangible assets 0.5 –Movement in other provisions (see note 20) (3.4) 10.9Amortisation of deferred grants and contributions (see note 21) (7.7) (7.4)Other 34.9 34.3424.3 425.6Other incomeOther income (3.3) (2.7)(3.3) (2.7)Depreciation and amortisation expenseDepreciation of property, plant and equipment (see note 10) 323.6 312.9Amortisation of intangible assets (see note 11) 29.0 24.0352.6 336.9* The comparatives have been restated to reflect the requirements of IFRS 11 ‘Joint Arrangements’. See accounting policies page 124 for details.128
UNITED UTILITIES GROUP PLC ANNUAL REPORT AND FINANCIAL STATEMENTS <strong>2015</strong>Stock Code: UU.<strong>united</strong><strong>utilities</strong>.com3 OPERATING PROFIT continuedDuring the year, the group obtained the following services from its auditor:Audit servicesStatutory audit – group and company 43 39Statutory audit – subsidiaries 291 216Regulatory <strong>report</strong>ing 30 30364 285Audit related services 30 45Other non-audit services 250 203644 5334 INVESTMENT INCOME<strong>2015</strong>£’000<strong>2015</strong>£m2014£’000Restated*2014£mInterest receivable on short-term bank deposits held at amortised cost 1.0 1.0Interest receivable on taxation settlement – 4.5Net pension interest income (see note 18) – 1.31.0 6.8* The comparatives have been restated to reflect the requirements of IFRS 11 ‘Joint Arrangements’. See accounting policies page 124 for details.STRATEGIC REPORTSHAREHOLDER INFORMATION FINANCIAL STATEMENTSGOVERNANCE129
UNITED UTILITIES GROUP PLC ANNUAL REPORT AND FINANCIAL STATEMENTS <strong>2015</strong>Stock Code: UU.<strong>united</strong><strong>utilities</strong>.comNotes to the financial statements5 FINANCE EXPENSEContinuing operations<strong>2015</strong>£mRestated*2014£mInterest payableInterest payable on borrowings held at amortised cost 206.1 241.2Release of taxation interest accrual – (13.3)206.1 227.9Fair value losses/(gains) on debt and derivative instruments (1)Fair value hedge relationships:Borrowings 112.8 (193.4)Designated swaps (122.7) 177.3(9.9) (16.1)Financial instruments at fair value through profit or loss:Borrowings designated at fair value through profit or loss (2) 65.0 (32.6)Associated swaps (3) (73.5) 53.6(8.5) 21.02010–15 regulatory swaps (3) (52.6) (61.5)<strong>2015</strong>+ regulatory swaps (3) 186.1 (67.6)Electricity swaps (3) (6.0) 4.2Net receipts on swaps and debt under fair value option (2.5) (8.7)Other swaps (3)(4) 1.1 6.4Other (3.0) (6.9)123.1 (134.1)Net fair value losses/(gains) on debt and derivative instruments (5) 104.7 (129.2)Net pension interest expense (see note 18) 7.0 –317.8 98.7* The comparatives have been restated to reflect the requirements of IFRS 11 ‘Joint Arrangements’. See accounting policies page 124 for details.Notes:(1) ‘Fair value losses/(gains) on debt and derivative instruments’ includes foreign exchange gains of £10.5 million (2014: £60.3 million), excluding those on instruments measured at fairvalue through profit or loss. These gains are largely offset by fair value losses on derivatives.(2) Includes a £4.6 million loss (2014: £11.1 million) on the valuation of debt <strong>report</strong>ed at fair value through profit or loss due to changes in credit spread assumptions.(3) These swap contracts are not designated within an IAS 39 hedge relationship and are, as a result, classed as ‘held for trading’ under the accounting standard. These derivatives formeconomic hedges and, as such, management intend to hold these through to maturity.(4) Includes fair value movements in relation to other economic hedge derivatives relating to debt held at amortised cost.(5) Includes £4.0 million income (2014: £8.1 million) due to interest on swaps and debt under fair value option.Interest payable for the year ended 31 March <strong>2015</strong> is stated net of £20.9 million (2014: £19.4 million) borrowing costscapitalised in the cost of qualifying assets within property, plant and equipment and intangible assets during the year. Thishas been calculated by applying a capitalisation rate of 3.1 per cent (2014: 3.8 per cent) to expenditure on such assets asprescribed by IAS 23 ‘Borrowing Costs’.130
UNITED UTILITIES GROUP PLC ANNUAL REPORT AND FINANCIAL STATEMENTS <strong>2015</strong>Stock Code: UU.<strong>united</strong><strong>utilities</strong>.com6 TAXATIONContinuing operations<strong>2015</strong>£mRestated*2014£mCurrent taxationUK corporation tax 56.8 75.3Adjustments in respect of prior years (9.7) (141.0)Total current taxation charge/(credit) for the year 47.1 (65.7)Deferred taxationCurrent year 14.3 40.5Adjustments in respect of prior years 9.0 (13.3)23.3 27.2Change in taxation rate – (156.8)Total deferred taxation charge/(credit) for the year 23.3 (129.6)Total taxation charge/(credit) for the year 70.4 (195.3)* The comparatives have been restated to reflect the requirements of IFRS 11 ‘Joint Arrangements’. See accounting policies page 124 for details.The current taxation credit for the year ended 31 March 2014 includes a credit of £141.0 million, and an associateddeferred taxation credit of £13.3 million relating to agreed matters in relation to prior years covering a period of over 10years in total. In addition, deferred taxation credits for the year ended 31 March 2014 include a credit of £156.8 million,reflecting the staged reductions in the mainstream rate of corporation tax from 23 per cent in the year ended 31 March2014 to 20 per cent effective from 1 April <strong>2015</strong>.The table below reconciles the notional tax charge at the UK corporation tax rate to the effective tax rate for the year:<strong>2015</strong>£m<strong>2015</strong>%Restated*2014£mRestated*2014%Profit before taxation 341.6 543.3Taxation at the UK corporation tax rate 71.7 21.0 125.0 23.0Adjustments in respect of prior years (0.7) (0.2) (154.3) (28.4)Change in taxation rate – – (156.8) (28.9)Net income not taxable/other (0.6) (0.2) (9.2) (1.7)Total taxation charge/(credit) and effective tax rate for the year 70.4 20.6 (195.3) (35.9)* The comparatives have been restated to reflect the requirements of IFRS 11 ‘Joint Arrangements’. See accounting policies page 124 for details.Taxation on items taken directly to equityContinuing operationsCurrent taxationRelating to other pension movements – (1.9)Deferred taxation (see note 19)On remeasurement gains/(losses) on defined benefit pension schemes 50.1 (40.2)Relating to other pension movements – 1.7Change in taxation rate – (0.5)50.1 (39.0)Total taxation charge/(credit) on items taken directly to equity 50.1 (40.9)<strong>2015</strong>£m2014£mSTRATEGIC REPORTSHAREHOLDER INFORMATION FINANCIAL STATEMENTSGOVERNANCE131
UNITED UTILITIES GROUP PLC ANNUAL REPORT AND FINANCIAL STATEMENTS <strong>2015</strong>Stock Code: UU.<strong>united</strong><strong>utilities</strong>.comNotes to the financial statements7 DISCONTINUED OPERATIONSDiscontinued operations represent the retained obligations of businesses sold in prior years. During the year ended31 March <strong>2015</strong>, the profit after taxation from discontinued operations was £nil (2014: £0.8 million); the prior year balancerelated primarily to the release of accrued costs of disposal in respect of certain elements of the group’s non-regulateddisposal programme.8 EARNINGS PER SHAREProfit after taxation attributable to equity holders of the company – continuing and discontinuedoperations 271.2 739.4Adjustment for profit after taxation from discontinued operations (see note 7) – (0.8)Profit after taxation attributable to equity holders of the company – continuing operations 271.2 738.6Earnings per share from continuing and discontinued operationsBasic 39.8 108.4Diluted 39.7 108.2Earnings per share from continuing operationsBasic 39.8 108.3Diluted 39.7 108.1Earnings per share from discontinued operationsBasic – 0.1Diluted – 0.1Basic earnings per share is calculated by dividing profit after taxation for the financial year attributable to equity holdersof the company by 681.9 million, being the weighted average number of shares in issue during the year (2014: 681.9 million).Diluted earnings per share is calculated by dividing profit after taxation for the financial year attributable to equity holdersof the company by 683.3 million, being the weighted average number of shares in issue during the year including dilutiveshares (2014: 683.2 million).The difference between the weighted average number of shares used in the basic and the diluted earnings per sharecalculations represents those ordinary shares deemed to have been issued for no consideration on the conversion of allpotential dilutive ordinary shares in accordance with IAS 33 ‘Earnings per Share’.The weighted average number of shares can be reconciled to the weighted average number of shares including dilutiveshares as follows:<strong>2015</strong>£m<strong>2015</strong>pence<strong>2015</strong>million2014£m2014pence2014millionAverage number of ordinary shares – basic 681.9 681.9Effect of potential dilutive ordinary shares – share options 1.4 1.3Average number of ordinary shares – diluted 683.3 683.2132
UNITED UTILITIES GROUP PLC ANNUAL REPORT AND FINANCIAL STATEMENTS <strong>2015</strong>Stock Code: UU.<strong>united</strong><strong>utilities</strong>.com9 DIVIDENDSAmounts recognised as distributions to equity holders of the company in the year comprise:Ordinary sharesFinal dividend for the year ended 31 March 2014 at 24.03 pence per share (2013: 22.88 pence) 163.8 156.0Interim dividend for the year ended 31 March <strong>2015</strong> at 12.56 pence per share (2014: 12.01 pence) 85.6 81.9249.4 237.9Proposed final dividend for the year ended 31 March <strong>2015</strong> at 25.14 pence per share(2014: 24.03 pence) 171.4 163.9<strong>2015</strong>£m2014£mSTRATEGIC REPORTThe proposed final dividends for the years ended 31 March <strong>2015</strong> and 31 March 2014 were subject to approval by equityholders of United Utilities Group PLC and hence have not been included as liabilities in the consolidated financialstatements at 31 March <strong>2015</strong> and 31 March 2014 respectively.10 PROPERTY, PLANT AND EQUIPMENTGroupLand andbuildings£mInfrastructureassets£mOperationalassets£mFixtures,fittings,tools andequipment£mAssets incourse ofconstruction£mCostAt 1 April 2013 restated* 242.9 4,329.5 5,497.1 451.8 1,009.3 11,530.6Additions 11.4 87.7 127.6 34.1 431.6 692.4Transfers 20.2 139.9 333.8 20.1 (514.0) –Disposals (2.4) (1.4) (31.3) (23.4) (0.5) (59.0)At 31 March 2014 restated* 272.1 4,555.7 5,927.2 482.6 926.4 12,164.0Additions 8.4 112.8 91.0 19.9 496.4 728.5Transfers 27.2 219.9 273.0 18.3 (538.4) –Disposals (4.1) (0.4) (27.2) (33.6) – (65.3)At 31 March <strong>2015</strong> 303.6 4,888.0 6,264.0 487.2 884.4 12,827.2Accumulated depreciationAt 1 April 2013 restated* 75.2 205.7 2,029.4 272.1 – 2,582.4Charge for the year 10.2 34.7 227.5 40.5 – 312.9Transfers – – (0.5) 0.5 – –Disposals (2.0) (0.6) (25.6) (21.6) – (49.8)At 31 March 2014 restated* 83.4 239.8 2,230.8 291.5 – 2,845.5Charge for the year 15.9 35.4 233.2 39.1 – 323.6Disposals (3.8) – (22.6) (31.8) – (58.2)At 31 March <strong>2015</strong> 95.5 275.2 2,441.4 298.8 – 3,110.9Net book value at 31 March 2014 restated* 188.7 4,315.9 3,696.4 191.1 926.4 9,318.5Net book value at 31 March <strong>2015</strong> 208.1 4,612.8 3,822.6 188.4 884.4 9,716.3* The comparatives have been restated to reflect the requirements of IFRS 11 ‘Joint Arrangements’. See accounting policies page 124 for details.At 31 March <strong>2015</strong>, the group had entered into contractual commitments for the acquisition of property, plant andequipment amounting to £394.5 million (2014: £333.9 million).In addition to these commitments, the group has long-term expenditure plans which include investments to achieveimprovements in performance required by regulators and to provide for future growth.Total£mSHAREHOLDER INFORMATION FINANCIAL STATEMENTSGOVERNANCECompanyThe company had no property, plant and equipment or contractual commitments for the acquisition of property, plant andequipment at 31 March <strong>2015</strong> or 31 March 2014.133
UNITED UTILITIES GROUP PLC ANNUAL REPORT AND FINANCIAL STATEMENTS <strong>2015</strong>Stock Code: UU.<strong>united</strong><strong>utilities</strong>.comNotes to the financial statements11 INTANGIBLE ASSETSCostAt 1 April 2013 restated* 207.3Additions 40.1Disposals (17.6)At 31 March 2014 restated* 229.8Additions 64.2Disposals (29.5)At 31 March <strong>2015</strong> 264.5Total£mAccumulated amortisationAt 1 April 2013 restated* 113.2Charge for the year 24.0Disposals (17.6)At 31 March 2014 restated* 119.6Charge for the year 29.0Disposals (29.0)At 31 March <strong>2015</strong> 119.6Net book value at 31 March 2014 restated* 110.2Net book value at 31 March <strong>2015</strong> 144.9* The comparatives have been restated to reflect the requirements of IFRS 11 ‘Joint Arrangements’. See accounting policies page 124 for details.The group’s intangible assets relate mainly to computer software.At 31 March <strong>2015</strong>, the group had entered into contractual commitments for the acquisition of intangible assets amountingto £2.3 million (2014: £29.4 million).CompanyThe company had no intangible assets or contractual commitments for the acquisition of intangible assets at 31 March<strong>2015</strong> or 31 March 2014.12 JOINT VENTURESAt 31 March <strong>2015</strong>, the group’s interests in joint ventures mainly comprised its interest in AS Tallinna Vesi (Tallinn Water).Joint management of Tallinn Water is based on a shareholders’ agreement.The joint ventures have no significant contingent liabilities to which the group is exposed. The group has issued guaranteesof £4.7 million in support of its joint ventures (2014: £5.2 million) which are included in the contingent liabilities totaldisclosed in note 24.134
UNITED UTILITIES GROUP PLC ANNUAL REPORT AND FINANCIAL STATEMENTS <strong>2015</strong>Stock Code: UU.<strong>united</strong><strong>utilities</strong>.com13 INVESTMENTSGroup £mAt 1 April 2013 5.7Additions 1.9Disposals (0.1)Currency translation differences (0.6)At 31 March 2014 6.9Additions 0.8Currency translation differences 0.9At 31 March <strong>2015</strong> 8.6STRATEGIC REPORTDuring the year, the group increased its investment in Muharraq Holding Company 1 Limited by £0.8 million(2014: £1.9 million).At 31 March <strong>2015</strong>, the group’s investments mainly comprised its investment in Muharraq Holding Company 1 Limited. Theseinvestments are held at fair value.CompanyShares insubsidiaryundertakings£mCostAt 31 March 2013, 31 March 2014 and 31 March <strong>2015</strong> 6,326.8ImpairmentAt 31 March 2013 and 31 March 2014 (726.8)Reversal 726.8At 31 March <strong>2015</strong> –Net book value at 31 March 2014 5,600.0Net book value at 31 March <strong>2015</strong> 6,326.8During the year ended 31 March <strong>2015</strong>, a review has been performed of the carrying value of the company’s investment inUnited Utilities PLC which has resulted in the reversal of the impairment made during the year ended 31 March 2010. Asin the prior year, the review was based on a ‘fair value less costs of disposal’ valuation. The reversal of the £726.8 millionimpairment increases the company’s investment in United Utilities PLC to £6,326.8 million at 31 March <strong>2015</strong>(2014: £5,600.0 million).14 INVENTORIES<strong>2015</strong>£mRestated*2014£mProperties held for resale 31.2 30.4Other inventories 9.3 9.440.5 39.8* The comparatives have been restated to reflect the requirements of IFRS 11 ‘Joint Arrangements’. See accounting policies page 124 for details.CompanyThe company had no inventories at 31 March <strong>2015</strong> or 31 March 2014.SHAREHOLDER INFORMATION FINANCIAL STATEMENTSGOVERNANCE135
UNITED UTILITIES GROUP PLC ANNUAL REPORT AND FINANCIAL STATEMENTS <strong>2015</strong>Stock Code: UU.<strong>united</strong><strong>utilities</strong>.comNotes to the financial statements15 TRADE AND OTHER RECEIVABLES<strong>2015</strong>£mRestated*Group2014£m<strong>2015</strong>£mCompanyTrade receivables 176.6 188.5 – –Amounts owed by subsidiary undertakings – – 61.2 56.3Amounts owed by related parties (see note A5) 2.8 2.7 – –Other debtors 22.6 18.1 – –Prepayments and accrued income 153.8 123.5 – –355.8 332.8 61.2 56.3* The comparatives have been restated to reflect the requirements of IFRS 11 ‘Joint Arrangements’. See accounting policies page 124 for details.At 31 March <strong>2015</strong>, the group had £2.5 million (2014 restated: £2.4 million) of trade and other receivables classified as noncurrent.The carrying amounts of trade and other receivables approximate their fair value.Trade receivables do not carry interest and are stated net of allowances for doubtful receivables, an analysis of which isas follows:GroupAt the start of the year 97.9 87.5Amounts charged to operating expenses (see note 3) 52.9 37.1Trade receivables written off (50.3) (26.7)At the end of the year 100.5 97.9At each <strong>report</strong>ing date, the group evaluates the recoverability of trade receivables and records allowances for doubtfulreceivables based on experience.At 31 March <strong>2015</strong> and 31 March 2014, the group had no trade receivables that were past due and not individually impaired.The following table provides information regarding the ageing of net trade receivables that were past due and individuallyimpaired:Trade receivablesAgedless thanone year£mAgedbetween oneyear andtwo years£m<strong>2015</strong>£mAgedgreaterthan twoyears£m2014£m2014£mCarryingvalue£mAt 31 March <strong>2015</strong> 125.8 43.6 3.2 172.6At 31 March 2014 restated* 112.0 40.0 31.1 183.1* The comparatives have been restated to reflect the requirements of IFRS 11 ‘Joint Arrangements’. See accounting policies page 124 for details.At 31 March <strong>2015</strong>, the group had £4.0 million (2014 restated: £5.4 million) of trade receivables that were not past due.CompanyAt 31 March <strong>2015</strong> and 31 March 2014, the company had no trade receivables that were past due.The directors consider that the carrying amount of trade and other receivables approximates to their fair value at 31 March<strong>2015</strong> and 31 March 2014.136
UNITED UTILITIES GROUP PLC ANNUAL REPORT AND FINANCIAL STATEMENTS <strong>2015</strong>Stock Code: UU.<strong>united</strong><strong>utilities</strong>.com16 CASH AND CASH EQUIVALENTS<strong>2015</strong>£mRestated*Group2014£m<strong>2015</strong>£mCompanyCash at bank and in hand 4.5 5.6 – –Short-term bank deposits 239.5 110.2 – –Cash and short-term deposits 244.0 115.8 – –Bank overdrafts (included in borrowings, see note 17) (24.3) (36.9) (0.4) (0.6)Cash and cash equivalents in the statement of cash flows 219.7 78.9 (0.4) (0.6)2014£mSTRATEGIC REPORT* The comparatives have been restated to reflect the requirements of IFRS 11 ‘Joint Arrangements’. See accounting policies page 124 for details.Cash and short-term deposits include cash at bank and in hand, deposits, and other short-term highly liquid investmentswhich are readily convertible into known amounts of cash and have a maturity of three months or less. The carrying amountsof cash and cash equivalents approximate their fair value.17 BORROWINGSGroupThe following analysis provides information about the contractual terms of the group’s borrowings:<strong>2015</strong>£mRestated*2014£mNon-current liabilitiesBonds 4,239.6 4,465.9Bank and other term borrowings 1,827.7 1,463.36,067.3 5,929.2Current liabilitiesBonds 425.9 –Bank and other term borrowings 127.9 75.4Bank overdrafts (see note 16) 24.3 36.9578.1 112.36,645.4 6,041.5* The comparatives have been restated to reflect the requirements of IFRS 11 ‘Joint Arrangements’. See accounting policies page 124 for details.SHAREHOLDER INFORMATION FINANCIAL STATEMENTSGOVERNANCE137
UNITED UTILITIES GROUP PLC ANNUAL REPORT AND FINANCIAL STATEMENTS <strong>2015</strong>Stock Code: UU.<strong>united</strong><strong>utilities</strong>.comNotes to the financial statements17 BORROWINGS continuedTerms and debt repayment scheduleThe principal economic terms and conditions of outstanding borrowings, along with fair value and carrying value, were as follows:CurrencyYear of finalrepaymentFairvalue<strong>2015</strong>£mCarryingvalue<strong>2015</strong>£mFairvalueRestated*2014£mCarryingvalueRestated*2014£mBorrowings in fair value hedge relationships 2,218.0 2,252.1 2,100.4 2,137.65.375% 150m bond GBP 2018 175.1 167.0 173.7 167.74.55% 250m bond USD 2018 181.3 183.0 161.2 164.95.375% 350m bond USD 2019 259.1 265.8 231.1 239.24.25% 500m bond EUR 2020 427.5 424.1 473.6 476.25.75% 375m bond GBP 2022 457.9 432.4 432.4 409.25.625% 300m bond GBP 2027 391.2 408.1 347.4 363.35.02% JPY 10bn dual currency loan JPY/USD 2029 75.4 86.3 68.1 79.75% 200m bond GBP 2035 250.5 285.4 212.9 237.4Borrowings designated at fair value through profit or loss 333.7 333.7 268.7 268.76.875% 400m bond USD 2028 333.7 333.7 268.7 268.7Borrowings measured at amortised cost 4,798.5 4,059.6 3,939.5 3,635.2Short-term bank borrowings – fixed GBP <strong>2015</strong> 117.5 117.5 75.0 75.06.125% 425m bond GBP <strong>2015</strong> 447.6 425.9 466.2 427.31.97%+RPI 200m IL loan GBP 2016 271.9 264.1 265.1 257.11.30%+LIBOR 5bn bond JPY 2017 29.2 28.8 30.0 29.72.46%+RPI 50m IL loan GBP 2020 67.0 58.5 68.7 57.92.10%+RPI 50m IL loan GBP 2020 65.8 58.5 67.2 57.81.93%+RPI 50m IL loan GBP 2020 65.5 58.6 66.7 58.01.90%+RPI 50m IL loan GBP 2020 65.5 58.7 66.6 58.11.88%+RPI 50m IL loan GBP 2020 65.2 58.6 66.4 57.91.84%+RPI 50m IL loan GBP 2020 65.3 58.8 66.5 58.11.73%+RPI 50m IL loan GBP 2020 65.1 58.8 66.1 58.21.61%+RPI 50m IL loan GBP 2020 64.8 58.9 65.7 58.30.47%+RPI 100m IL loan GBP 2023 105.0 103.8 95.8 102.60.49%+RPI 100m IL loan GBP 2025 101.6 99.9 – –1.29%+RPI 50m (amortising) IL loan GBP 2029 59.3 55.4 55.4 54.81.23%+RPI 50m (amortising) IL loan GBP 2029 59.1 55.8 55.0 55.21.12%+RPI 50m (amortising) IL loan GBP 2029 58.2 55.0 53.6 54.41.10%+RPI 50m (amortising) IL loan GBP 2029 58.0 54.9 53.4 54.30.75%+RPI 50m (amortising) IL loan GBP 2029 55.6 53.7 49.5 53.11.15%+RPI 50m (amortising) IL loan GBP 2030 56.8 53.4 52.0 52.81.11%+RPI 50m (amortising) IL loan GBP 2030 56.8 53.5 50.8 52.90.76%+RPI 50m (amortising) IL loan GBP 2030 55.4 53.6 49.3 53.00.709%+LIBOR 100m (amortising) loan GBP 2032 97.7 100.0 89.2 100.00.691%+LIBOR 150m (amortising) loan GBP 2032 146.2 150.0 – –3.375%+RPI 50m IL bond GBP 2032 110.9 72.0 97.2 70.20.573%+LIBOR 100m (amortising) loan GBP 2033 96.1 100.0 – –1.9799%+RPI 100m IL bond GBP 2035 174.9 135.0 148.8 131.71.66%+RPI 35m IL bond GBP 2037 52.9 43.0 45.5 42.62.40%+RPI 70m IL bond GBP 2039 117.2 83.8 102.3 82.91.7829%+RPI 100m IL bond GBP 2040 177.4 133.6 142.9 130.31.3258%+RPI 50m IL bond GBP 2041 80.7 66.7 65.6 65.0138
UNITED UTILITIES GROUP PLC ANNUAL REPORT AND FINANCIAL STATEMENTS <strong>2015</strong>Stock Code: UU.<strong>united</strong><strong>utilities</strong>.com17 BORROWINGS continuedCurrencyYear of finalrepaymentFairvalue<strong>2015</strong>£mCarryingvalue<strong>2015</strong>£mFairvalueRestated*2014£mCarryingvalueRestated*2014£mBorrowings measured at amortised cost continued1.5802%+RPI 100m IL bond GBP 2042 171.7 133.2 137.0 129.91.5366%+RPI 50m IL bond GBP 2043 85.0 66.5 68.4 64.81.397%+RPI 50m IL bond GBP 2046 85.0 66.6 66.0 65.01.7937%+RPI 50m IL bond GBP 2049 95.0 66.3 73.8 64.7Commission for New Towns (amortising) loan – fixed GBP 2053 55.6 29.3 51.9 29.51.847%+RPI 100m IL bond GBP 2056 186.8 129.9 150.8 128.41.815%+RPI 100m IL bond GBP 2056 185.5 129.3 148.7 127.91.662%+RPI 100m IL bond GBP 2056 178.8 129.1 142.0 127.61.591%+RPI 25m IL bond GBP 2056 43.6 32.2 34.6 31.81.5865%+RPI 50m IL bond GBP 2056 86.9 64.5 69.5 63.81.556%+RPI 50m IL bond GBP 2056 86.9 64.2 68.4 63.51.435%+RPI 50m IL bond GBP 2056 84.2 63.9 65.9 63.21.3805%+RPI 35m IL bond GBP 2056 58.2 44.7 45.3 44.31.702%+RPI 50m IL bond GBP 2057 88.7 62.6 69.9 61.91.585%+RPI 100m IL bond GBP 2057 172.1 124.2 133.9 122.8Bank overdrafts GBP <strong>2015</strong> 24.3 24.3 36.9 36.97,350.2 6,645.4 6,308.6 6,041.5* The comparatives have been restated to reflect the requirements of IFRS 11 ‘Joint Arrangements’. See accounting policies page 124 for details.ILRPIIndex-linked debt – this debt is adjusted for movements in the Retail Prices Index with reference to a base RPIestablished at trade dateThe UK general index of retail prices (for all items) as published by the Office for National Statistics(Jan 1987 = 100)Borrowings are unsecured. Funding raised in currencies other than sterling is swapped to sterling to match funding costs toincome and assets.CompanyThe following analysis provides information about the contractual terms of the company’s borrowings:Non-current liabilitiesAmounts owed to subsidiary undertakings 1,609.4 –1,609.4 –Current liabilitiesBank overdrafts (see note 16) 0.4 0.6Amounts owed to subsidiary undertakings – 1,583.70.4 1,584.31,609.8 1,584.3Borrowings are unsecured and are measured at amortised cost. The carrying amounts of borrowings approximate theirfair value.<strong>2015</strong>£m2014£mSTRATEGIC REPORTSHAREHOLDER INFORMATION FINANCIAL STATEMENTSGOVERNANCE139
UNITED UTILITIES GROUP PLC ANNUAL REPORT AND FINANCIAL STATEMENTS <strong>2015</strong>Stock Code: UU.<strong>united</strong><strong>utilities</strong>.comNotes to the financial statements18 RETIREMENT BENEFIT SURPLUS/(OBLIGATIONS)Defined benefit schemesThe net pension expense before taxation recognised in the income statement in respect of the defined benefit schemes issummarised as follows:Continuing operationsCurrent service cost (18.1) (17.2)Curtailments/settlements (5.5) (1.7)Administrative expenses (2.6) (2.2)Pension expense charged to operating profit (26.2) (21.1)Net pension interest (expense)/income (charged)/credited to finance expense/investment income(see notes 4 and 5) (7.0) 1.3Net pension expense charged before taxation (33.2) (19.8)Defined benefit pension costs excluding curtailments/settlements included within employee benefit expense were£20.7 million (2014: £19.4 million) comprising current service costs and administrative expenses. Total post-employmentbenefits expense excluding curtailments/settlements charged to operating profit of £29.5 million (2014: £27.5 million)comprise the defined benefit costs described above of £20.7 million (2014: £19.4 million) and defined contribution pensioncosts of £8.8 million (2014: £8.1 million) (see note 2).The reconciliation of the opening and closing net pension surplus/(obligations) included in the statement of financialposition is as follows:GroupAt the start of the year (177.4) 15.1Expense recognised in the income statement (33.2) (19.8)Contributions paid 39.3 28.1Remeasurement gains/(losses) gross of taxation 250.5 (200.8)At the end of the year 79.2 (177.4)Included in the contributions paid of £39.3 million (2014: £28.1 million) were pre-paid accelerated deficit repaircontributions of £9.7 million (2014: £nil) and an inflation funding mechanism payment of £5.5 million (2014: £9.9 million).Remeasurement gains and losses are recognised directly in the statement of comprehensive income.The return/(loss) on plan assets, excluding amounts included in interest 705.2 (125.1)Actuarial losses arising from changes in financial assumptions (500.8) (108.3)Actuarial gains arising from changes in demographic assumptions (1) 10.2 34.4Actuarial gains/(losses) arising from experience 35.9 (1.8)Remeasurement gains/(losses) on defined benefit pension schemes 250.5 (200.8)Note:(1) Following investigations carried out as part of the last triennial scheme funding valuation performed in March 2013.<strong>2015</strong>£m<strong>2015</strong>£m<strong>2015</strong>£m2014£m2014£m2014£mFor more information in relation to the group’s defined benefit pension schemes see note A4.Defined contribution schemesDuring the year, the group made £8.8 million (2014: £8.1 million) of contributions (see note 2) to defined contributionschemes relating to continuing operations, which are included in arriving at operating profit.CompanyThe company did not participate in any of the group’s pension schemes during the years ended 31 March <strong>2015</strong> and 31 March2014.140
UNITED UTILITIES GROUP PLC ANNUAL REPORT AND FINANCIAL STATEMENTS <strong>2015</strong>Stock Code: UU.<strong>united</strong><strong>utilities</strong>.com19 DEFERRED TAX LIABILITIESThe following are the major deferred tax liabilities and assets recognised by the group, and the movements thereon, duringthe current and prior year:GroupAcceleratedtaxationdepreciation£mRetirementbenefitobligations£mAt 1 April 2013 1,242.0 3.4 (26.4) 1,219.0(Credited)/charged to the income statement (158.0) 0.1 28.3 (129.6)Credited to equity (see note 6) – (39.0) – (39.0)At 31 March 2014 1,084.0 (35.5) 1.9 1,050.4Charged/(credited) to the income statement 41.0 2.0 (19.7) 23.3Charged to equity (see note 6) – 50.1 – 50.1At 31 March <strong>2015</strong> 1,125.0 16.6 (17.8) 1,123.8Certain deferred tax assets and liabilities have been offset in accordance with IAS 12 ‘Income Taxes’.CompanyThe company had no deferred tax assets or liabilities at 31 March <strong>2015</strong> or 31 March 2014.20 PROVISIONSGroupSeverance£mAt 1 April 2013 1.6 10.6 12.2Charged to the income statement 4.4 10.9 15.3Utilised in the year (3.6) (7.6) (11.2)At 31 March 2014 2.4 13.9 16.3Charged/(credited) to the income statement 6.6 (3.4) 3.2Utilised in the year (4.2) (2.8) (7.0)At 31 March <strong>2015</strong> 4.8 7.7 12.5The group had no provisions classed as non-current at 31 March <strong>2015</strong> or 31 March 2014.The severance provision as at 31 March <strong>2015</strong> and 31 March 2014 relates to severance costs as a result of groupreorganisation.Other provisions principally relate to contractual and legal claims against the group and represent management’s bestestimate of the value of settlement, the timing of which is dependent on the resolution of the relevant legal claims.CompanyThe company had no provisions at 31 March <strong>2015</strong> or 31 March 2014.Other£mOther£mTotal£mTotal£mSTRATEGIC REPORTSHAREHOLDER INFORMATION FINANCIAL STATEMENTSGOVERNANCE141
UNITED UTILITIES GROUP PLC ANNUAL REPORT AND FINANCIAL STATEMENTS <strong>2015</strong>Stock Code: UU.<strong>united</strong><strong>utilities</strong>.comNotes to the financial statements21 TRADE AND OTHER PAYABLESNon-current<strong>2015</strong>£mRestated*Group2014£m<strong>2015</strong>£mCompanyDeferred grants and contributions 476.7 441.8 – –Other creditors 3.3 9.2 – –480.0 451.0 – –2014£mCurrent<strong>2015</strong>£mRestated*Group2014£m<strong>2015</strong>£mCompanyTrade payables 40.1 41.1 – –Amounts owed to subsidiary undertakings – – 9.2 8.6Other taxation and social security 4.7 4.9 – –Deferred grants and contributions 9.1 8.9 – –Other creditors 3.7 3.8 1.6 1.5Accruals and deferred income 323.6 323.4 – –381.2 382.1 10.8 10.1* The comparatives have been restated to reflect the requirements of IFRS 11 ‘Joint Arrangements’. See accounting policies page 124 for details.The average credit period taken for trade purchases is 28 days (2014 restated: 27 days).The carrying amounts of trade and other payables approximate their fair value.Deferred grants and contributionsGroupAt the start of the year 450.7 419.0Cash received during the year 18.1 16.4Transfers of assets from customers 27.0 24.8Credited to the income statement – revenue (2.3) (2.1)Credited to the income statement – other operating expenses (see note 3) (7.7) (7.4)At the end of the year 485.8 450.7<strong>2015</strong>£m2014£m2014£m22 SHARE CAPITALGroup and company<strong>2015</strong>million<strong>2015</strong>£m2014millionIssued, called up and fully paidOrdinary shares of 5.0 pence each 681.9 34.1 681.9 34.1Deferred shares of 170.0 pence each 274.0 465.7 274.0 465.7955.9 499.8 955.9 499.8Refer to the directors’ <strong>report</strong> for details of the voting rights of each category of shares.2014£m142
UNITED UTILITIES GROUP PLC ANNUAL REPORT AND FINANCIAL STATEMENTS <strong>2015</strong>Stock Code: UU.<strong>united</strong><strong>utilities</strong>.com23 OPERATING LEASE COMMITMENTSGroupProperty<strong>2015</strong>£mPlant andequipment<strong>2015</strong>£mProperty2014£mPlant andequipment2014£mCommitments under non-cancellable operating leases dueWithin one year 3.5 0.7 3.3 0.8In the second to fifth years inclusive 11.6 0.5 11.4 0.5After five years 280.4 – 258.2 –295.5 1.2 272.9 1.3In respect of the group’s commitment to significant property leases, there are no contingent rentals payable, or restrictionson dividends, debt or further leasing imposed by these lease arrangements. Wherever possible, the group ensures that it hasthe benefit of security of tenure where this is required by operational and accommodation strategies. Escalation of rents isvia rent reviews at agreed intervals.The company had no operating lease commitments at 31 March <strong>2015</strong> or 31 March 2014.24 CONTINGENT LIABILITIESThe group has entered into performance guarantees as at 31 March <strong>2015</strong> where a financial limit has been specified of£9.7 million (2014: £47.1 million).The company has not entered into performance guarantees as at 31 March <strong>2015</strong> or 31 March 2014.25 EVENTS AFTER THE REPORTING PERIODThere are no events arising after the <strong>report</strong>ing date that require recognition or disclosure in the financial statements for theyear ended 31 March <strong>2015</strong>.STRATEGIC REPORTSHAREHOLDER INFORMATION FINANCIAL STATEMENTSGOVERNANCE143
UNITED UTILITIES GROUP PLC ANNUAL REPORT AND FINANCIAL STATEMENTS <strong>2015</strong>Stock Code: UU.<strong>united</strong><strong>utilities</strong>.comNotes to the financial statements – appendicesA1 SUBSIDIARIES AND OTHER GROUP UNDERTAKINGSDetails of principal operating subsidiary undertakings and joint ventures are set out below. These undertakings are includedwithin the consolidated financial statements. A full list of the group’s subsidiary undertakings is included in the company’s<strong>annual</strong> return.Subsidiary undertakingGreat BritainUnited Utilities Water Limited(formerly United Utilities Water PLC)Class of sharecapital heldProportion ofshare capitalowned/votingrights %*Nature of businessOrdinary 100.0 Water and wastewater services and networkmanagementUnited Utilities Property Services Limited Ordinary 100.0 Property managementJoint venturesEstoniaAS Tallinna Vesi Ordinary 35.3 Contract operations and maintenance services* Shares are held by subsidiary undertakings rather than directly by United Utilities Group PLC.A2 CASH GENERATED FROM OPERATIONSContinuing operations<strong>2015</strong>£mRestated*Group2014£m<strong>2015</strong>£mCompanyProfit before taxation 341.6 543.3 950.0 212.6Adjustment for investment income (see note 4) and finance expense (seenote 5) 316.8 91.9 26.3 25.3Adjustment for share of profits of joint ventures (5.1) (5.0) – –Operating profit 653.3 630.2 976.3 237.9Adjustments for:Depreciation of property, plant and equipment (see note 10) 323.6 312.9 – –Amortisation of intangible assets (see note 11) 29.0 24.0 – –Loss on disposal of property, plant and equipment (see note 3) 5.1 6.4 – –Loss on disposal of intangible assets (see note 3) 0.5 – – –Amortisation of deferred grants and contributions (see note 21) (7.7) (7.4) – –Equity-settled share-based payments charge (see note 2) 2.9 4.4 – –Other non-cash movements** (1.2) (2.0) (726.8) –Changes in working capital:Increase in inventories (0.7) (2.1) – –(Increase)/decrease in trade and other receivables (23.0) (7.4) 6.5 0.4(Decrease)/increase in trade and other payables (23.2) (24.2) 0.1 (0.6)(Decrease)/increase in provisions (see note 20) (3.8) 4.1 – –Pension contributions paid less pension expense charged to operating profit (13.1) (7.0) – –Cash generated from continuing operations 941.7 931.9 256.1 237.7* The comparatives have been restated to reflect the requirements of IFRS 11 ‘Joint Arrangements’. See accounting policies page 124 for details.** Material non-cash transactions during the year include, for the company, the reversal of a past impairment made against the company’s investment in its subsidiary,United Utilities PLC (see note 13).The group has received property, plant and equipment of £27.0 million (2014: £24.8 million) in exchange for the provision offuture goods and services (see notes 21 and A6).2014£m144
UNITED UTILITIES GROUP PLC ANNUAL REPORT AND FINANCIAL STATEMENTS <strong>2015</strong>Stock Code: UU.<strong>united</strong><strong>utilities</strong>.comA3 FINANCIAL RISK MANAGEMENTRisk managementThe board is responsible for treasury strategy and governance, which is reviewed on an <strong>annual</strong> basis. The <strong>annual</strong> treasurystrategy review covers (as applicable) the group’s funding, liquidity, capital management and interest rate managementstrategies, along with the delegation of specific funding and hedging authorities to the treasury committee.The treasury committee, a sub-committee of the board, has responsibility for setting and monitoring the group’s adherenceto treasury policies, along with oversight in relation to the activities of the treasury function.STRATEGIC REPORTTreasury policies cover the key financial risks: liquidity risk, credit risk, market risk (inflation, interest rate, electricity priceand currency) and capital risk. These policies are reviewed by the treasury committee for approval on at least an <strong>annual</strong>basis, or following any major changes in treasury operations and/or financial market conditions.Day-to-day responsibility for operational compliance with the treasury policies rests with the treasurer. An operationalcompliance <strong>report</strong> is provided monthly to the treasury committee, which details the status of the group’s compliance withthe treasury policies and highlights the level of risk against the appropriate risk limits in place.The group’s treasury function does not act as a profit centre and does not undertake any speculative trading activity.Liquidity riskThe group looks to manage its liquidity risk by maintaining liquidity within a board approved duration range. Liquidityis actively monitored by the group’s treasury function and is <strong>report</strong>ed monthly to the treasury committee through theoperational compliance <strong>report</strong>.At 31 March <strong>2015</strong>, the group had £1,244.0 million (2014 restated: £1,015.8 million) of available liquidity, which comprised£244.0 million (2014 restated: £115.8 million) cash and short-term deposits, £600.0 million (2014: £500.0 million) ofundrawn committed borrowing facilities, and £400.0 million (2014: £400.0 million) of undrawn term loan facilities. Shorttermdeposits mature within three months and bank overdrafts are repayable on demand.The group had available committed borrowing facilities as follows:GroupExpiring within one year 50.0 50.0Expiring after one year but in less than two years 150.0 50.0Expiring after more than two years 400.0 400.0Undrawn borrowing facilities 600.0 500.0These facilities are arranged on a bilateral rather than a syndicated basis, which spreads the maturities more evenly overa longer time period, thereby reducing the refinancing risk by providing several renewal points rather than a large singlerefinancing point.CompanyThe company did not have any committed facilities available at 31 March <strong>2015</strong> or 31 March 2014.<strong>2015</strong>£m2014£mSHAREHOLDER INFORMATION FINANCIAL STATEMENTSGOVERNANCE145
UNITED UTILITIES GROUP PLC ANNUAL REPORT AND FINANCIAL STATEMENTS <strong>2015</strong>Stock Code: UU.<strong>united</strong><strong>utilities</strong>.comNotes to the financial statements – appendicesA3 FINANCIAL RISK MANAGEMENT continuedMaturity analysisConcentrations of risk may arise if large cash flows are concentrated within particular time periods. The maturity profilein the following table represents the forecast future contractual principal and interest cash flows in relation to the group’sfinancial liabilities with agreed repayment periods and derivatives on an undiscounted basis. Derivative cash flows havebeen shown net where there is a contractual agreement to settle on a net basis; otherwise the cash flows are shown gross.GroupAt 31 March <strong>2015</strong>Total (1)£mAdjustment(2)£m1 yearor less£m1–2years£m2–3years£m3–4years£m4–5years£mMorethan5 years£mBonds 10,067.1 593.3 143.4 173.3 691.1 502.8 7,963.2Bank and other term borrowings 2,536.9 184.5 348.9 84.2 85.8 86.9 1,746.6Adjustment to carrying value (2) (5,958.6) (5,958.6)Borrowings 6,645.4 (5,958.6) 777.8 492.3 257.5 776.9 589.7 9,709.8Derivatives:Payable 1,039.6 89.3 70.7 101.3 369.9 383.0 25.4Receivable (1,534.2) (124.2) (101.4) (176.9) (626.9) (502.3) (2.5)Adjustment to carrying value (2) 17.2 17.2Derivatives – net assets (477.4) 17.2 (34.9) (30.7) (75.6) (257.0) (119.3) 22.9Restated*At 31 March 2014Total (1)£mAdjustment(2)£m1 yearor less£m1–2years£m2–3years£m3–4years£m4–5years£mMorethan5 years£mBonds 10,314.6 165.9 592.1 142.3 174.7 652.5 8,587.1Bank and other term borrowings 2,136.1 139.6 38.8 343.1 65.1 66.3 1,483.2Adjustment to carrying value (2) (6,409.2) (6,409.2)Borrowings 6,041.5 (6,409.2) 305.5 630.9 485.4 239.8 718.8 10,070.3Derivatives:Payable 1,005.9 108.4 55.9 45.4 80.6 352.0 363.6Receivable (1,464.0) (171.5) (86.2) (83.3) (132.5) (428.4) (562.1)Adjustment to carrying value (2) 48.3 48.3Derivatives – net assets (409.8) 48.3 (63.1) (30.3) (37.9) (51.9) (76.4) (198.5)* The comparatives have been restated to reflect the requirements of IFRS 11 ‘Joint Arrangements’. See accounting policies page 124 for details.Notes:(1) Forecast future cash flows are calculated, where applicable, utilising forward interest rates based on the interest environment at year-end and are therefore susceptible to changesin market conditions. For index-linked debt it has been assumed that RPI will be three per cent over the life of each instrument.(2) The carrying value of debt is calculated following various methods in accordance with IAS 39 ‘Financial Instruments: Recognition and Measurement’ and therefore this adjustmentreconciles the undiscounted forecast future cash flows to the carrying value of debt in the statement of financial position.CompanyThe company has total borrowings of £0.4 million (2014: £1,584.3 million), which are payable within one year, and£1,609.4 million (2014: £nil), which are payable within one to two years.146
UNITED UTILITIES GROUP PLC ANNUAL REPORT AND FINANCIAL STATEMENTS <strong>2015</strong>Stock Code: UU.<strong>united</strong><strong>utilities</strong>.comA3 FINANCIAL RISK MANAGEMENT continuedCredit riskCredit risk arises principally from trading (the supply of services to customers) and treasury activities (the depositing ofcash and holding of derivative and foreign exchange instruments). The group does not believe it is exposed to any materialconcentrations of credit risk.The group manages its risk from trading through the effective management of customer relationships. Concentrations ofcredit risk with respect to trade receivables are limited due to the group’s customer base consisting of a large number ofunrelated households and businesses. The Water Industry Act 1991 (as amended by the Water Industry Act 1999) prohibitsthe disconnection of a water supply and the limiting of supply with the intention of enforcing payment for certain premisesincluding domestic dwellings. However, allowance is made by the water regulator in the price limits at each price review fora proportion of debt deemed to be irrecoverable. Considering the above, the directors believe there is no further credit riskprovision required in excess of the allowance for doubtful receivables (see note 15).The group manages its risk from treasury activities by establishing a total credit limit by counterparty, which comprisesa counterparty credit limit and an additional settlement limit to cover intra-day gross settlement cash flows. In addition,potential derivative exposure limits are also established to take account of potential future exposure which may arise underderivative transactions. These limits are calculated by reference to a measure of capital and credit ratings of the individualcounterparties and are subject to a maximum single counterparty limit. A control mechanism to trigger a review of specificcounterparty limits, irrespective of credit rating action, is in place. This entails daily monitoring of counterparty creditdefault swap levels and/or share price volatility. Credit exposure is monitored daily by the group’s treasury function and is<strong>report</strong>ed monthly to the treasury committee through the operational compliance <strong>report</strong>.At 31 March <strong>2015</strong> and 31 March 2014, the maximum exposure to credit risk for the group and company is represented bythe carrying amount of each financial asset in the statement of financial position:<strong>2015</strong>£mRestated*Group2014£m<strong>2015</strong>£mCompanyCash and short-term deposits (see note 16) 244.0 115.8 – –Trade and other receivables (see note 15) 355.8 332.8 61.2 56.3Investments (see note 13) 8.6 6.9 – –Derivative financial instruments 682.6 512.9 – –1,291.0 968.4 61.2 56.3* The comparatives have been restated to reflect the requirements of IFRS 11 ‘Joint Arrangements’. See accounting policies page 124 for details .The credit exposure on derivatives is disclosed gross of any collateral held. At 31 March <strong>2015</strong>, the group held £117.5 million(2014: £75.0 million) as collateral in relation to derivative financial instruments (included within borrowings in note 17).Market riskThe group’s exposure to market risk primarily results from its financing arrangements and the economic return which it isallowed on the regulatory capital value (RCV).The group uses a variety of financial instruments, including derivatives, in order to manage the exposure to these risks.2014£mSTRATEGIC REPORTSHAREHOLDER INFORMATION FINANCIAL STATEMENTSGOVERNANCE147
UNITED UTILITIES GROUP PLC ANNUAL REPORT AND FINANCIAL STATEMENTS <strong>2015</strong>Stock Code: UU.<strong>united</strong><strong>utilities</strong>.comNotes to the financial statements – appendicesA3 FINANCIAL RISK MANAGEMENT continuedInflation riskThe group earns an economic return on its RCV, comprising a real return through revenues and an inflation return as an upliftto its RCV. To the extent that nominal debt liabilities finance a proportion of the RCV, there is an asset liability mismatchwhich potentially exposes the group to the risk of economic loss where actual inflation is lower than that implicitly locked inthrough nominal debt.The group’s index-linked borrowings, which are linked to RPI inflation, form an economic hedge of the group’s regulatoryassets, which are also linked to RPI inflation. In particular, index-linked debt delivers a cash flow benefit compared tonominal debt, as the inflation adjustment on the index-linked liabilities is a deferred cash flow until the maturity of eachfinancial instrument, providing a better match to the inflation adjustment on the regulated assets, which is recognised as anon-cash uplift to the RCV.In addition, the group’s pension obligations also provide an economic hedge of the group’s regulatory assets. The pensionschemes’ inflation funding mechanism (see note A4) ensures that future contributions will be flexed for movements in RPIand smoothed over a rolling five-year period, providing a natural hedge against any inflationary uplift on the RCV.The group seeks to manage this risk by identifying opportunities to amend the economic hedge currently in place wheredeemed necessary and subject to relative value. Inflation risk is <strong>report</strong>ed monthly to the treasury committee in theoperational compliance <strong>report</strong>.The carrying value of index-linked debt held by the group is as follows:Index-linked debt 3,083.8 2,936.8<strong>2015</strong>£m2014£mSensitivity analysisAs required by IFRS 7 ‘Financial Instruments: Disclosure’, the sensitivity analysis has been prepared on the basis of theamount of index-linked debt in place as at 31 March <strong>2015</strong> and 31 March 2014 respectively. As a result, this analysis relatesto the position at the <strong>report</strong>ing date and is not indicative of the years then ended, as these factors would have variedthroughout the year. The following table details the sensitivity of profit before taxation to changes in the RPI on the group’sindex-linked borrowings:Increase/(decrease) in profit before taxation and equity1 per cent increase in RPI (31.4) (29.9)1 per cent decrease in RPI 31.4 29.9This table excludes the hedging aspect of the group’s regulatory assets which, being property, plant and equipment, are notfinancial assets as defined by IAS 32 ‘Financial Instruments: Presentation’ and are typically held at cost or deemed cost lessaccumulated depreciation on the consolidated statement of financial position. In addition, the table excludes the hedgingaspect of the group’s pension obligations.The analysis assumes a one per cent change in RPI having a corresponding one per cent impact on this position over a12-month period. It should be noted, however, that there is a time lag by which current RPI changes impact on the incomestatement, and the analysis does not incorporate this factor. The portfolio of index-linked debt is calculated on eithera three or eight-month lag basis. Therefore, at the <strong>report</strong>ing date the index-linked interest and principal adjustmentsimpacting the income statement are fixed and based on the <strong>annual</strong> RPI change either three or eight months earlier.CompanyThe company had no material exposure to inflation risk at 31 March <strong>2015</strong> or 31 March 2014.<strong>2015</strong>£m2014£m148
UNITED UTILITIES GROUP PLC ANNUAL REPORT AND FINANCIAL STATEMENTS <strong>2015</strong>Stock Code: UU.<strong>united</strong><strong>utilities</strong>.comA3 FINANCIAL RISK MANAGEMENT continuedInterest rate riskThe group’s policy is to structure debt in a way that best matches its underlying assets and cash flows. The group earns aneconomic return on its RCV, comprising a real return through revenues, determined by the real cost of capital fixed by theregulator for each five-year regulatory pricing period, and an inflation return as an uplift to its RCV.The preferred form of debt therefore is sterling index-linked debt which incurs fixed interest, in real terms, and forms anatural hedge of regulatory assets and cash flows.STRATEGIC REPORTWhere conventional long-term debt is raised in a fixed-rate form, to manage exposure to long-term interest rates, the debtis generally swapped at inception to create a floating rate liability for the term of the liability through the use of interestrate swaps. These instruments are typically designated within a fair value accounting hedge.To manage the exposure to medium-term interest rates, the group fixes underlying interest rates on nominal debt out to10 years in advance on a reducing balance basis. This is supplemented by managing residual exposure to interest rateswithin the relevant regulatory price control period by fixing substantively all residual floating underlying interest rateson projected nominal debt across the immediately forthcoming regulatory period at around the time of the price controldetermination.The group seeks to manage its risk by maintaining its interest rate exposure within a board approved range. Interest raterisk is <strong>report</strong>ed monthly to the treasury committee through the operational compliance <strong>report</strong>.Sensitivity analysisAs required by IFRS 7 ‘Financial Instruments: Disclosures’, the sensitivity analysis has been prepared on the basis of theamount of net debt and the interest rate hedge positions in place at the <strong>report</strong>ing date. As a result, this analysis is notindicative of the years then ended, as these factors would have varied throughout the year.The following assumptions were made in calculating the interest sensitivity analysis:• fair value hedge relationships are fully effective;• borrowings designated at fair value through profit or loss are effectively hedged by associated swaps;• the sensitivity excludes the impact of interest rates on post-retirement obligations;• management has assessed one per cent as a reasonably possible movement in UK interest rates; and• all other factors are held constant.Increase/(decrease) in profit before taxation and equity<strong>2015</strong>£mRestated*Group2014£m<strong>2015</strong>£mCompany1 per cent increase in interest rate 174.2 101.2 (16.1) (15.8)1 per cent decrease in interest rate (190.9) (111.4) 16.1 15.8* The comparatives have been restated to reflect the requirements of IFRS 11 ‘Joint Arrangements’. See accounting policies page 124 for details .The exposure largely relates to fair value movements on the group’s fixed interest rate swaps which manage the exposure tomedium-term interest rates.2014£mSHAREHOLDER INFORMATION FINANCIAL STATEMENTSGOVERNANCE149
UNITED UTILITIES GROUP PLC ANNUAL REPORT AND FINANCIAL STATEMENTS <strong>2015</strong>Stock Code: UU.<strong>united</strong><strong>utilities</strong>.comNotes to the financial statements – appendicesA3 FINANCIAL RISK MANAGEMENT continuedRepricing analysisThe following tables categorise the group’s borrowings, derivatives and cash deposits on the basis of when they reprice or, ifearlier, mature. The repricing analysis demonstrates the group’s exposure to floating interest rate risk.GroupAt 31 March <strong>2015</strong>Total£m1 yearor less£m1–2years£m2–3years£m3–4years£m4–5years£mMorethan5 years£mBorrowings in fair value hedge relationshipsFixed rate instruments 2,252.1 – – – 615.8 424.1 1,212.2Effect of swaps – 2,252.1 – – (615.8) (424.1) (1,212.2)2,252.1 2,252.1 – – – – –Borrowings designated at fair value throughprofit or lossFixed rate instruments 333.7 – – – – – 333.7Effect of swaps – 333.7 – – – – (333.7)333.7 333.7 – – – – –Borrowings measured at amortised costFixed rate instruments 572.7 543.8 0.4 0.5 0.5 0.6 26.9Floating rate instruments 403.1 403.1 – – – – –Index-linked instruments 3,083.8 3,083.8 – – – – –4,059.6 4,030.7 0.4 0.5 0.5 0.6 26.9Effect of a fixed hedge for the term of theregulatory period – (2,656.3) (250.0) (125.0) (50.0) 1,127.1 1,954.2Total borrowings 6,645.4 3,960.2 (249.6) (124.5) (49.5) 1,127.7 1,981.1Cash and short-term deposits (244.0) (244.0) – – – – –Net borrowings 6,401.4 3,716.2 (249.6) (124.5) (49.5) 1,127.7 1,981.1Restated*At 31 March 2014Total£m1 yearor less£m1–2years£m2–3years£m3–4years£m4–5years£mMorethan5 years£mBorrowings in fair value hedge relationshipsFixed rate instruments 2,137.6 – – – – 571.8 1,565.8Effect of swaps – 2,137.6 – – – (571.8) (1,565.8)2,137.6 2,137.6 – – – – –Borrowings designated at fair value throughprofit or lossFixed rate instruments 268.7 – – – – – 268.7Effect of swaps – 268.7 – – – – (268.7)268.7 268.7 – – – – –Borrowings measured at amortised costFixed rate instruments 531.8 75.3 427.7 0.4 0.5 0.5 27.4Floating rate instruments 166.6 166.6 – – – – –Index-linked instruments 2,936.8 2,936.8 – – – – –3,635.2 3,178.7 427.7 0.4 0.5 0.5 27.4Effect of a fixed hedge for the term of theregulatory period – (2,031.3) – 325.0 252.1 250.0 1,204.2Total borrowings 6,041.5 3,553.7 427.7 325.4 252.6 250.5 1,231.6Cash and short-term deposits (115.8) (115.8) – – – – –Net borrowings 5,925.7 3,437.9 427.7 325.4 252.6 250.5 1,231.6* The comparatives have been restated to reflect the requirements of IFRS 11 ‘Joint Arrangements’. See accounting policies page 124 for details.150
UNITED UTILITIES GROUP PLC ANNUAL REPORT AND FINANCIAL STATEMENTS <strong>2015</strong>Stock Code: UU.<strong>united</strong><strong>utilities</strong>.comA3 FINANCIAL RISK MANAGEMENT continuedCompanyTotal£m<strong>2015</strong>1 yearor less£mTotal£m20141 yearor less£mBorrowings measured at amortised costFloating rate instruments 1,609.8 1,609.8 1,584.3 1,584.3Total borrowings 1,609.8 1,609.8 1,584.3 1,584.3STRATEGIC REPORTElectricity price riskThe group is allowed a fixed amount of revenue by the regulator, in real terms, to cover electricity costs for each five-yearregulatory pricing period. To the extent that electricity prices remain floating over this period, this exposes the group tovolatility in its operating cash flows. The group’s policy, therefore, is to manage this risk by fixing a proportion of electricitycommodity prices in a cost-effective manner.The group has fixed the price on a substantial proportion of its anticipated net electricity usage out to the end of the AMP in2020, partially through entering into electricity swap contracts.Sensitivity analysisAs required by IFRS 7 ‘Financial Instruments: Disclosures’, the sensitivity analysis has been prepared on the basis of theamount of the group’s electricity swaps in place at the <strong>report</strong>ing date and, as a result, this analysis is not indicative of theyears then ended, as this factor would have varied throughout the year.Increase/(decrease) in profit before taxation and equity10 per cent increase in commodity prices 4.8 2.610 per cent decrease in commodity prices (4.8) (2.6)Currency riskCurrency exposure principally arises in respect of funding raised in foreign currencies.To manage exposure to currency rates, foreign currency debt is hedged into sterling through the use of cross currencyswaps and these are typically designated within a fair value accounting hedge.The group seeks to manage its risk by maintaining currency exposure within board approved limits. Currency risk inrelation to foreign currency denominated financial instruments is <strong>report</strong>ed monthly to the treasury committee through theoperational compliance <strong>report</strong>.The group and company have no material net exposure to movements in currency rates.Capital risk managementThe group’s objective when managing capital is to maintain efficient access to debt capital markets throughout theeconomic cycle. The board therefore believes that it is appropriate to maintain gearing, measured as group consolidated netdebt to regulatory capital value (RCV) of United Utilities Water Limited (UUW), within a target range of 55 per cent to 65per cent. As at 31 March <strong>2015</strong>, group consolidated gearing was 59 per cent, which is comfortably within this range.Assuming no significant changes to existing rating agencies’ methodologies or sector risk assessments, the group aims tomaintain, as a minimum, its existing credit ratings of A3 with Moody’s Investors Service (Moody’s) and BBB+ with Standard& Poor’s Ratings Services (Standard & Poor’s) for UUW and debt issued by its financing subsidiary, United Utilities WaterFinance PLC.In order to maintain existing credit ratings, the group needs to manage its capital structure with reference to the ratingsmethodology and measures used by Moody’s and Standard & Poor’s. The ratings methodology is normally based on anumber of key ratios (such as RCV gearing, adjusted interest cover and Funds from Operations (FFO) to debt) and thresholdlevels as updated and published from time to time by Moody’s and Standard & Poor’s. The group looks to manage its riskby maintaining the relevant key financial ratios used by the credit rating agencies to determine a corporate’s credit rating,within the thresholds approved by the board. Capital risk is <strong>report</strong>ed monthly to the treasury committee through theoperational compliance <strong>report</strong>.<strong>2015</strong>£m2014£mSHAREHOLDER INFORMATION FINANCIAL STATEMENTSGOVERNANCEFurther detail on the precise measures and methodologies used to assess water companies’ credit ratings can be found inthe methodology papers published by the rating agencies.151
UNITED UTILITIES GROUP PLC ANNUAL REPORT AND FINANCIAL STATEMENTS <strong>2015</strong>Stock Code: UU.<strong>united</strong><strong>utilities</strong>.comNotes to the financial statements – appendicesA3 FINANCIAL RISK MANAGEMENT continuedFair valuesThe table below sets out the valuation basis of financial instruments held at fair value and financial instruments where fairvalue has been separately disclosed in the notes as the carrying value is not a reasonable approximation of fair value.Group<strong>2015</strong>Available for sale financial assetsInvestments – 8.6 – 8.6Financial assets at fair value through profit or lossDerivative financial assets – fair value hedge – 521.6 – 521.6Derivative financial assets – held for trading (1) – 161.0 – 161.0Financial liabilities at fair value through profit or lossDerivative financial liabilities – held for trading (1) – (205.2) – (205.2)Financial liabilities designated as fair value through profit or loss – (333.7) – (333.7)Financial instruments for which fair value has been disclosedFinancial liabilities in fair value hedge relationships (2,142.6) (75.4) – (2,218.0)Other financial liabilities at amortised cost (2,530.3) (2,268.2) – (4,798.5)(4,672.9) (2,191.3) – (6,864.2)Restated*2014Available for sale financial assetsInvestments – 6.9 – 6.9Financial assets at fair value through profit or lossDerivative financial assets – fair value hedge – 398.9 – 398.9Derivative financial assets – held for trading (1) – 114.0 – 114.0Financial liabilities at fair value through profit or lossDerivative financial liabilities – held for trading (1) – (103.1) – (103.1)Financial liabilities designated as fair value through profit or loss – (268.7) – (268.7)Financial instruments for which fair value has been disclosedFinancial liabilities in fair value hedge relationships (2,032.3) (68.1) – (2,100.4)Other financial liabilities at amortised cost (1,146.7) (2,792.8) – (3,939.5)(3,179.0) (2,712.9) – (5,891.9)Level 1£mLevel 1£m* The comparatives have been restated to reflect the requirements of IFRS 11 ‘Joint Arrangements’. See accounting policies page 124 for details.Note:Level 2£mLevel 2£mLevel 3£mLevel 3£m(1) These derivatives form economic hedges and, as such, management intend to hold these through to maturity. Derivatives forming an economic hedge of the currency exposure onborrowings included in these balances were £152.2 million (2014: £83.2 million).Total£mTotal£m• Level 1 fair value measurements are those derived from quoted prices (unadjusted) in active markets for identical assetsor liabilities;• Level 2 fair value measurements are those derived from inputs other than quoted prices included within level 1 that areobservable for the asset or liability, either directly (i.e. as prices) or indirectly (i.e. derived from prices); and• Level 3 fair value measurements are those derived from valuation techniques that include inputs for the asset or liabilitythat are not based on observable market data (unobservable).The group has calculated fair values using quoted prices where an active market exists, which has resulted in£4,672.9 million (2014: £3,179.0 million) of ‘level 1’ fair value measurements. In the absence of an appropriate quoted price,the group has applied discounted cash flow valuation models utilising market available data in line with prior years.In respect of the total change during the year in the fair value of financial liabilities designated at fair value throughprofit or loss, of a £65.0 million loss (2014: £32.6 million gain), a £4.6 million loss (2014: £11.1 million) is attributable tochanges in own credit risk. The cumulative amount recognised in the income statement due to changes in credit spreadwas £59.0 million profit (2014: £63.6 million). The carrying amount is £131.6 million (2014: £66.6 million) higher than theamount contracted to settle on maturity.152
UNITED UTILITIES GROUP PLC ANNUAL REPORT AND FINANCIAL STATEMENTS <strong>2015</strong>Stock Code: UU.<strong>united</strong><strong>utilities</strong>.comA3 FINANCIAL RISK MANAGEMENT continuedCompanyThe company does not hold any financial instruments that are measured subsequent to initial recognition at fair value orwhere fair value has been separately disclosed in the notes as the carrying value is not a reasonable approximation offair value.A4 RETIREMENT BENEFITSDefined benefit schemesThe group participates in two major funded defined benefit pension schemes in the United Kingdom – the United UtilitiesPension Scheme (UUPS) and the United Utilities PLC group of the Electricity Supply Pension Scheme (ESPS), both of whichare closed to new employees. The assets of these schemes are held in trust funds independent of the group’s finances.The trustees are composed of representatives of both the employer and employees. The trustees are required by law to act inthe interests of all relevant beneficiaries and are responsible for the investment policy with regard to the assets plus theday-to-day administration of the benefits.The group also operates a series of unfunded, unregistered retirement benefit schemes. The costs of these schemes areincluded in the total pension cost, on a basis consistent with IAS 19 and the assumptions set out below.Information about the pension arrangements for executive directors is contained in the directors’ remuneration <strong>report</strong>.Under the schemes, employees are entitled to <strong>annual</strong> pensions on retirement. Benefits are also payable on death and followingother events such as withdrawing from active service. No other post-retirement benefits are provided to these employees.The latest actuarial valuations of UUPS and ESPS were carried out as at 31 March 2013. The results of these valuations havebeen adjusted to take account of the requirements of IAS 19 ‘Employee Benefits’ in order to assess the position at 31 March<strong>2015</strong> by projecting forward from the valuation date by the independent actuary, Aon Hewitt Limited.Funding requirementsThe latest funding valuations of the schemes as at 31 March 2013 <strong>report</strong>ed a deficit. The basis on which liabilities are valuedfor funding purposes differs to the basis required under IAS 19. Under UK legislation there is a requirement that pensionschemes are funded prudently.The group has a plan in place with the schemes’ trustees to address the funding deficit by 31 December 2020, through a seriesof <strong>annual</strong> deficit recovery contributions.The group and trustees have agreed long-term strategies for reducing investment risk in each scheme.For UUPS this includes an asset liability matching policy which aims to reduce the volatility of the funding level of the pensionplan by investing in assets such as fixed income swaps which perform in line with the liabilities so as to hedge against changesin swap yields. For ESPS, a partial hedge is in place to protect against changes in swap yields.In addition, the group has had an Inflation Funding Mechanism (IFM) in place since 2010; details of this are outlined in the 2011<strong>annual</strong> <strong>report</strong>. In 2013, it extended the mechanism to the ESPS, and increased the fixed percentage rate used to 3.0 per centper annum from 2.75 per cent per annum. To the extent that inflation, as measured by the RPI index at each 31 March precedingthe payment due date, is different from 3.0 per cent per annum, the inflation reserve will increase/decrease. Additionalcontributions are then payable <strong>annual</strong>ly based on the size of the inflation reserve.The duration of the combined schemes is around 20 years. The schemes’ duration is an indicator of the weighted-average timeuntil benefit payments are settled, taking account of the split of the defined benefit obligation between current employees,deferred members and the current pensioners of the schemes.The group expects to make contributions of £55.7 million in the year ending 31 March 2016, comprising £29.2 million to UUPSand £4.1 million to ESPS in respect of accelerated deficit repair contributions, and £21.4 million and £1.0 million in respect ofregular contributions to UUPS and ESPS respectively.Impact of scheme risk management on IAS 19 disclosuresUnder the prescribed IAS 19 basis, pension scheme liabilities are calculated based on current accrued benefits. Expected cashflows are projected forward allowing for RPI and the current member mortality assumptions. These projected cash flows arethen discounted by an AA corporate bond rate, which comprises an underlying interest rate and a credit spread.STRATEGIC REPORTSHAREHOLDER INFORMATION FINANCIAL STATEMENTSGOVERNANCE153
UNITED UTILITIES GROUP PLC ANNUAL REPORT AND FINANCIAL STATEMENTS <strong>2015</strong>Stock Code: UU.<strong>united</strong><strong>utilities</strong>.comNotes to the financial statements – appendicesA4 RETIREMENT BENEFITS continuedThe group has de-risked its pension schemes through hedging strategies applied to the underlying interest rate and theforecast RPI. The underlying interest rate has been largely hedged through external market swaps, the value of which isincluded in the schemes’ assets, and the forecast RPI has been largely hedged through the IFM, with RPI in excess of3.0 per cent per annum being funded through an additional schedule of deficit contribution.As a consequence, the <strong>report</strong>ed statement of financial position under IAS 19 remains volatile to changes in credit spread whichhave not been hedged, primarily due to the difficulties in doing so over long durations; changes in inflation, as the IFM resultsin changes to the IFM deficit contributions rather than a change in the schemes’ assets; and, to a lesser extent, changes inmortality as management has decided not to hedge this exposure due to its lower volatility in the short-term and the relativelyhigh hedging costs.In contrast, the schemes’ specific funding basis, which forms the basis for regular (non-IFM) deficit repair contributions, isunlikely to suffer from volatility due to credit spread or inflation. This is because a prudent, fixed credit spread assumption isapplied, and inflation-linked contributions are included within the IFM.In the IAS 19 assessment of financial position at 31 March <strong>2015</strong>, price inflation fell by 0.3 per cent and, although the discountrate has fallen by 1.2 per cent, this masks a credit spread increase of 0.1 per cent. The price inflation reduction and creditspread increase results in substantially all of the <strong>report</strong>ed £256.6 million improvement. During the year ended 31 March <strong>2015</strong>,there has not been any significant change in the deficits on a scheme specific funding basis that impacts the level of deficitrepair contributions.Sensitivity of the key scheme assumptionsThe measurement of the group’s defined benefit obligation is sensitive to changes in key assumptions, which are describedbelow. The sensitivity calculations presented below allow for the specified movement in the relevant key assumption, whilst allother assumptions are held constant. This approach does not take into account the inter-relationship between some of theseassumptions or any hedging strategies adopted.• Asset volatilityIf the schemes’ assets underperform relative to the discount rate used to calculate the schemes’ liabilities, this will create adeficit. The schemes hold some growth assets (equities, diversified growth funds and emerging market debt) which, thoughexpected to outperform the discount rate in the long-term, create volatility in the short-term. The allocation to growthassets is monitored to ensure it remains appropriate given the schemes’ long-term objectives.• Discount rateAn increase/decrease in the discount rate of 0.1 per cent would have resulted in a £60.1 million (2014: £49.1 million)decrease/increase in the schemes’ liabilities at 31 March <strong>2015</strong>, although as long as credit spreads remain stable this willbe largely offset by an increase in the value of the schemes’ bond holdings and other instruments designed to hedge thisexposure. The discount rate is based on AA corporate bond yields of a similar duration to the schemes’ liabilities.• Price inflationAn increase/decrease in the inflation assumption of 0.1 per cent would have resulted in a £56.6 million (2014: £47.0million) increase/decrease in the schemes’ liabilities at 31 March <strong>2015</strong>, as a significant proportion of the schemes’benefit obligations are linked to inflation. In some cases, caps on the level of inflationary increases are in place to protectagainst extreme inflation. The majority of the assets are either unaffected by or loosely correlated with inflation, meaningthat an increase in inflation will also increase the deficit. Any change in inflation out-turn results in a change to the cashcontributions provided under the IFM.• Life expectancyAn increase/decrease in the mortality long-term improvement rate of 0.25 per cent would have resulted in a £36.7million (2014: £37.3 million) increase/decrease in the schemes’ liabilities at 31 March <strong>2015</strong>. The majority of the schemes’obligations are to provide benefits for the life of the member and, as such, the schemes’ liabilities are sensitive to theseassumptions.A contingent liability exists in relation to the equalisation of Guaranteed Minimum Pension (GMP). The UK Government intendsto implement legislation which could result in an increase in the value of GMP for males. This would increase the definedbenefit obligation of the schemes. At this stage, until the Government develops its proposals and publishes guidance, it is notpossible to quantify the impact of this change.154
UNITED UTILITIES GROUP PLC ANNUAL REPORT AND FINANCIAL STATEMENTS <strong>2015</strong>Stock Code: UU.<strong>united</strong><strong>utilities</strong>.comA4 RETIREMENT BENEFITS continuedReportingThe results of the latest funding valuations at 31 March 2013 have been adjusted in order to assess the position at 31 March<strong>2015</strong>, by taking account of experience over the period, changes in market conditions, and differences in the financial anddemographic assumptions. The present value of the defined benefit obligation, and the related current service costs, weremeasured using the projected unit credit method.The main financial and demographic assumptions used by the actuary to calculate the defined benefit surplus/(obligations) ofUUPS and ESPS were as follows:STRATEGIC REPORTGroupDiscount rate 3.1 4.3Pensionable salary growth and pension increases 3.0 3.3Price inflation 3.0 3.3<strong>2015</strong>% pa2014% paIn assessing the financial assumptions, the group has taken into account the average duration of the schemes’ liabilities.Demographic assumptionsMortality in retirement is assumed to be in line with the Continuous Mortality Investigation’s (CMI) S1NA year of birthtables with a one-year age rating for males, reflecting actual mortality experience; and CMI 2014 (2014: CMI 2013)long-term improvement factors, with a long-term <strong>annual</strong> rate of improvement of 1.5 per cent per annum. The current lifeexpectancies at age 60 underlying the value of the accrued liabilities for the schemes are:Retired member – male 26.6 26.6Non-retired member – male 28.3 28.4Retired member – female 30.2 30.0Non-retired member – female 32.0 31.9Further <strong>report</strong>ing analysisAt 31 March, the fair value of the schemes’ assets recognised in the statement of financial position were as follows:Schemes’assets%<strong>2015</strong>£m<strong>2015</strong>yearsSchemes’assets%Equities 9.9 308.7 6.6 157.0Other non-equity growth assets 10.2 320.4 10.0 238.3Gilts 14.7 461.8 11.9 283.9Bonds 43.6 1,365.8 52.2 1,240.7Other 21.6 677.0 19.3 457.1Total fair value of schemes’ assets 100.0 3,133.7 100.0 2,377.0Present value of defined benefit obligations (3,054.5) (2,554.4)Net retirement benefit surplus/(obligations) 79.2 (177.4)The fair values in the table above are all based on quoted prices in an active market, where applicable.The assets, in respect of UUPS, included in the table above, have been allocated to each asset class based on the returnthe assets are expected to achieve as UUPS has entered into a variety of derivative transactions to change the returncharacteristics of the physical assets held in order to reduce undesirable market and liability risks. As such, the breakdownshown separates the assets of the schemes to illustrate the underlying risk characteristics of the assets held.2014years2014£mSHAREHOLDER INFORMATION FINANCIAL STATEMENTSGOVERNANCE155
UNITED UTILITIES GROUP PLC ANNUAL REPORT AND FINANCIAL STATEMENTS <strong>2015</strong>Stock Code: UU.<strong>united</strong><strong>utilities</strong>.comNotes to the financial statements – appendicesA4 RETIREMENT BENEFITS continuedBoth of the schemes employ a strategy where the asset portfolio is made up of a growth element and a defensive element.Assets in the growth portfolio are shown as equities and other non-equity growth assets above, while assets held in thedefensive portfolio represent the remainder of the schemes’ assets.The ‘other’ element of the portfolio is set aside for collateral purposes linked to the derivative contracts entered into,as described above. The collateral portfolio, comprising cash and eligible securities which are readily converted to cash,provides sufficient liquidity to manage the derivative transactions and is expected to achieve a return in excess of LIBOR.Movements in the fair value of the schemes’ assets were as follows:At the start of the year 2,377.0 2,442.0Interest income on schemes’ assets 101.0 111.3The return/(loss) on plan assets, excluding amounts included in interest 705.2 (125.1)Member contributions 6.3 6.6Benefits paid (92.5) (83.7)Administrative expenses (2.6) (2.2)Company contributions 39.3 28.1At the end of the year 3,133.7 2,377.0<strong>2015</strong>£m2014£mThe group’s actual return on the schemes’ assets was a gain of £806.2 million (2014: £13.8 million loss), principally due togains (2014: losses) on derivatives hedging the schemes’ liabilities.Movements in the present value of the defined benefit obligations are as follows:At the start of the year (2,554.4) (2,426.9)Interest cost on schemes’ obligations (108.0) (110.0)Actuarial losses arising from changes in financial assumptions (500.8) (108.3)Actuarial gains arising from changes in demographic assumptions 10.2 34.4Actuarial gains/(losses) arising from experience 35.9 (1.8)Curtailments/settlements (5.5) (1.7)Member contributions (6.3) (6.6)Benefits paid 92.5 83.7Current service cost (18.1) (17.2)At the end of the year (3,054.5) (2,554.4)<strong>2015</strong>£m2014£m156
UNITED UTILITIES GROUP PLC ANNUAL REPORT AND FINANCIAL STATEMENTS <strong>2015</strong>Stock Code: UU.<strong>united</strong><strong>utilities</strong>.comA5 RELATED PARTY TRANSACTIONSGroupTransactions between the company and its subsidiaries, which are related parties, have been eliminated on consolidationand are not disclosed in this note.Trading transactionsThe following transactions were carried out with the group’s joint ventures and other investments:STRATEGIC REPORT<strong>2015</strong>£mSales of services2014£mPurchases ofgoods and servicesJoint ventures 1.0 1.5 0.8 0.8Other investments 0.1 0.1 – –1.1 1.6 0.8 0.8<strong>2015</strong>£m2014£mSales of services to related parties were on the group’s normal trading terms.The following amounts were owed by/to the group’s joint ventures and other investments at the <strong>report</strong>ing date (see note 15).Amounts owedby related parties<strong>2015</strong>£mRestated*2014£mAmounts owedto related partiesJoint ventures 2.8 2.6 – –Other investments – 0.1 – –2.8 2.7 – –* The comparatives have been restated to reflect the requirements of IFRS 11 ‘Joint Arrangements’. See accounting policies page 124 for details .The amounts outstanding are unsecured and will be settled in accordance with normal credit terms. The group has issuedguarantees of £4.7 million (2014: £5.2 million) in support of its joint ventures (see note 12).No expense or allowance has been recognised for bad and doubtful receivables in respect of the amounts owed by relatedparties (2014: £nil).Details of transactions with key management are disclosed in note 2.CompanyThe parent company receives dividend income and pays and receives interest to and from subsidiary undertakings in thenormal course of business. Total dividend income received during the year amounted to £249.5 million (2014: £237.9million) and total net interest payable during the year was £26.3 million (2014: £25.3 million). Amounts outstanding at31 March <strong>2015</strong> and 31 March 2014 between the parent company and subsidiary undertakings are provided in notes 15,17 and 21.At 31 March <strong>2015</strong> and 31 March 2014, no related party receivables and payables were secured and no guarantees wereissued in respect thereof. Balances will be settled in accordance with normal credit terms. No allowance for doubtfulreceivables has been made for amounts owed by subsidiary undertakings as at 31 March <strong>2015</strong> and 31 March 2014.<strong>2015</strong>£m2014£mSHAREHOLDER INFORMATION FINANCIAL STATEMENTSGOVERNANCE157
UNITED UTILITIES GROUP PLC ANNUAL REPORT AND FINANCIAL STATEMENTS <strong>2015</strong>Stock Code: UU.<strong>united</strong><strong>utilities</strong>.comNotes to the financial statements – appendicesA6 ACCOUNTING POLICIESBasis of consolidationThe group financial statements consolidate the financialstatements of the company and entities controlled by thecompany (its subsidiaries), and incorporate the resultsof its share of joint ventures using the equity method ofaccounting. The results of subsidiaries and joint venturesacquired or disposed of during the year are included inthe consolidated income statement from the date controlis obtained or until the date that control ceases, asappropriate.Where necessary, adjustments are made to the financialstatements of subsidiaries to bring the accounting policiesused under the relevant local GAAP into line with those usedby the group.SubsidiariesSubsidiaries are entities controlled by the group. Control isachieved where the group is exposed to, or has the rights to,variable returns from its involvement in an entity and hasthe ability to affect those returns through its power overthe entity. In the parent company accounts, investments areheld at cost less provision for impairment.On acquisition, the assets and liabilities and contingentliabilities of a subsidiary are measured at their fair values atthe date of acquisition. Any excess of the cost of acquisitionover the fair values of the identifiable net assets acquiredis recognised as goodwill. Any deficiency of the cost ofacquisition below the fair values of the identifiable netassets acquired is credited to the income statement in theperiod of acquisition. All intra-group transactions, balances,income and expenses are eliminated on consolidation.Joint venturesJoint ventures are entities in which the group holds aninterest on a long-term basis and which are jointly controlledwith one or more parties under a contractual arrangement.The group’s share of joint venture results and assets andliabilities are incorporated using the equity method ofaccounting. Under the equity method, an investment in ajoint venture is initially recognised at cost and adjustedthereafter to recognise the group’s share of the profit orloss.Revenue recognitionRevenue represents the fair value of the income receivablein the ordinary course of business for goods and servicesprovided. Where relevant, this includes an estimate of thesales value of units supplied to customers between the dateof the last meter reading and the period end, exclusive ofvalue added tax and foreign sales tax.The group recognises revenue generally at the time ofdelivery and when collection of the resulting receivableis reasonably assured. Should the group consider thatthe criteria for revenue recognition are not met for atransaction, revenue recognition would be delayed untilsuch time as collectability is reasonably assured. Paymentsreceived in advance of revenue recognition are recorded asdeferred income.Operating profitOperating profit is stated after charging operationalexpenses but before investment income and financeexpense.Borrowing costs and finance incomeExcept as noted below, all borrowing costs and financeincome are recognised in the income statement in the periodin which they are accrued.Transaction costs that are directly attributable to theacquisition or issue of a financial asset or financial liabilityare included in the initial fair value of that instrument.Where borrowing costs are attributable to the acquisition,construction or production of a qualifying asset, such costsare capitalised as part of the specific asset.TaxationThe taxation expense represents the sum of currenttaxation and deferred taxation.Current taxationCurrent taxation is based on the taxable profit for theperiod and is provided at amounts expected to be paidor recovered using the tax rates and laws that have beenenacted or substantively enacted at each <strong>report</strong>ing date.Taxable profit differs from the net profit as <strong>report</strong>ed in theincome statement because it excludes items of income orexpense that are taxable or deductible in other years and itfurther excludes items that are never taxable or deductible.Current taxation is charged or credited in the incomestatement, except when it relates to items charged orcredited to equity, in which case the taxation is also dealtwith in equity.Deferred taxationDeferred taxation is the tax expected to be payable orrecoverable on differences between the carrying amountsof assets and liabilities in the financial statements andthe corresponding tax bases used in the computation oftaxable profit. Deferred tax liabilities are provided, usingthe liability method, on all taxable temporary differencesat each <strong>report</strong>ing date. Such assets and liabilities are notrecognised if the temporary difference arises from goodwillor from the initial recognition (other than in a businesscombination) of other assets and liabilities in a transactionthat affects neither the taxable profit nor the accountingprofit.Deferred taxation liabilities are recognised for taxabletemporary differences arising on investments insubsidiaries and interests in joint ventures, except wherethe group is able to control the reversal of the temporarydifference and it is probable that the temporary differencewill not reverse in the foreseeable future.158
UNITED UTILITIES GROUP PLC ANNUAL REPORT AND FINANCIAL STATEMENTS <strong>2015</strong>Stock Code: UU.<strong>united</strong><strong>utilities</strong>.comA6 ACCOUNTING POLICIES continuedDeferred taxation is measured at the average tax rates thatare expected to apply in the periods in which the temporarytiming differences are expected to reverse based on taxrates and laws that have been enacted or substantivelyenacted at each <strong>report</strong>ing date.The carrying amount of deferred taxation assets is reviewedat each <strong>report</strong>ing date and is reduced to the extent that itis no longer probable that sufficient taxable profits will beavailable to allow all or part of the asset to be recovered.Deferred taxation is charged or credited in the incomestatement, except when it relates to items charged orcredited to equity, in which case the deferred taxation isalso dealt with in equity.Property, plant and equipmentProperty, plant and equipment comprise water andwastewater infrastructure assets and overground assets(including properties, plant and equipment).The useful economic lives of these assets are primarily asfollows:• Water and wastewater infrastructure assets:––Impounding reservoirs 200 years;––Mains and raw water aqueducts 30 to 300 years;––Sewers and sludge pipelines 60 to 300 years;––Sea outfalls 77 years;• Buildings 10 to 60 years;• Operational assets 5 to 80 years; and• Fixtures, fittings, tools and equipment 3 to 40 years.Employee and other related costs incurred in implementingthe capital schemes of the group are capitalised.Water and wastewater infrastructure assetsInfrastructure assets comprise a network of waterand wastewater pipes and systems. Expenditure onthe infrastructure assets, including borrowing costswhere applicable, relating to increases in capacity orenhancements of the network is treated as additions.Amounts incurred in maintaining the operating capabilityof the network in accordance with defined standards ofservice are expensed in the year in which the expenditure isincurred. Infrastructure assets are depreciated by writingoff their cost (or deemed cost for infrastructure assets heldon transition to IFRS), less the estimated residual value,evenly over their useful economic lives.Other assetsAll other property, plant and equipment is stated athistorical cost less accumulated depreciation.Historical cost includes expenditure that is directlyattributable to the acquisition of the items, includingrelevant borrowing costs, where applicable, for qualifyingassets. Subsequent costs are included in the asset’s carryingamount or recognised as a separate asset, as appropriate,only when it is probable that future economic benefitsassociated with the item will flow to the group and the costof the item can be measured reliably. All other repairs andmaintenance costs are charged to the income statementduring the financial period in which they are incurred.Freehold land and assets in the course of construction arenot depreciated. Other assets are depreciated by writingoff their cost, less their estimated residual value, evenlyover their estimated useful economic lives, based onmanagement’s judgement and experience.Depreciation methods, residual values and useful economiclives are reassessed <strong>annual</strong>ly and, if necessary, changesare accounted for prospectively. The gain or loss arising onthe disposal or retirement of an asset is determined as thedifference between the sales proceeds and the carryingamount of the asset and is recognised in other operatingcosts.Transfer of assets from customers and developersWhere the group receives from a customer or developer anitem of property, plant and equipment (or cash to constructor acquire an item of property, plant and equipment) thatthe group must then use, either to connect the customerto the network, or to provide the customer with ongoingaccess to a supply of goods or services, or to do both,such items are capitalised at their fair value and includedwithin property, plant and equipment, with a credit of thesame amount to deferred grants and contributions. Theassets are depreciated over their useful economic lives andthe deferred contributions released to revenue over thesame period (or where the receipt of property, plant andequipment is solely to connect the customer to the network,the deferred contribution is released immediately torevenue). This interpretation has been applied to transfersof assets from customers received on or after 1 July 2009.Assets transferred from customers or developers areaccounted for at fair value. If no market exists for the assetsthen incremental cash flows are used to arrive at fair value.Intangible assetsIntangible assets are measured initially at cost and areamortised on a straight-line basis over their estimateduseful economic lives. The carrying amount is reduced by anyprovision for impairment where necessary.On a business combination, as well as recording separableintangible assets already recognised in the statement offinancial position of the acquired entity at their fair value,identifiable intangible assets that arise from contractualor other legal rights are also included in the acquisitionstatement of financial position at fair value.STRATEGIC REPORTSHAREHOLDER INFORMATION FINANCIAL STATEMENTSGOVERNANCE159
UNITED UTILITIES GROUP PLC ANNUAL REPORT AND FINANCIAL STATEMENTS <strong>2015</strong>Stock Code: UU.<strong>united</strong><strong>utilities</strong>.comNotes to the financial statements – appendicesA6 ACCOUNTING POLICIES continuedInternal expenditure is capitalised as internally generatedintangibles only if it meets the criteria of IAS 38 ‘IntangibleAssets’.Intangible assets, which relate primarily to computersoftware, are amortised over a period of three to ten years.Impairment of tangible and intangible assetsIntangible assets with definite useful economic livesand property, plant and equipment are reviewed forimpairment at each <strong>report</strong>ing date to determine whetherthere is any indication that those assets may have sufferedan impairment loss. If any such indication exists, therecoverable amount of the asset is estimated in orderto determine the extent of the impairment loss, if any.Where the asset does not generate cash flows that areindependent from other assets, the group estimates therecoverable amount of the cash generating unit to which theasset belongs.The recoverable amount is the higher of fair value less coststo sell, and value in use. Value in use represents the netpresent value of expected future cash flows, discountedon a pre-tax basis, using a rate that reflects current marketassessments of the time value of money and the risksspecific to the asset for which the estimates of future cashflows have not been adjusted.If the recoverable amount of an asset (or cash generatingunit) is estimated to be less than its carrying amount, thecarrying amount of the asset (or cash generating unit) isreduced to its recoverable amount. Impairment losses inrespect of non-current assets are recognised in the incomestatement within operating costs.Where an impairment loss subsequently reverses, thereversal is recognised in the income statement and thecarrying amount of the asset is increased to the revisedestimate of its recoverable amount, but not so as to exceedthe carrying amount that would have been determined hadno impairment loss been recognised in prior years.Financial instrumentsFinancial assets and financial liabilities are recognised andderecognised on the group’s statement of financial positionon the trade date when the group becomes/ceases to be aparty to the contractual provisions of the instrument.Cash and short-term depositsCash and short-term deposits include cash at bank andin hand, deposits and other short-term highly liquidinvestments which are readily convertible into knownamounts of cash, have a maturity of three months or lessfrom the date of acquisition and which are subject to aninsignificant risk of change in value. In the consolidatedstatement of cash flows and related notes, cash and cashequivalents include cash and short-term deposits, net ofbank overdrafts.Financial investmentsInvestments (other than interests in associates,subsidiaries, joint ventures and fixed deposits) are initiallymeasured at fair value, including transaction costs.Investments classified as available for sale in accordancewith IAS 39 ‘Financial Instruments: Recognition andMeasurement’ are measured at subsequent <strong>report</strong>ing datesat fair value. Gains and losses arising from changes in fairvalue are recognised directly in equity, until the security isdisposed of or is determined to be impaired, at which timethe cumulative gain or loss previously recognised in equityis included in the net profit or loss for the period.Trade receivablesTrade receivables are initially measured at fair value,and are subsequently measured at amortised cost, lessany impairment for irrecoverable amounts. Estimatedirrecoverable amounts are based on historical experienceof the receivables balance.Trade payablesTrade payables are initially measured at fair value and aresubsequently measured at amortised cost.Financial liabilities and equityFinancial liabilities and equity instruments are classifiedaccording to the substance of the contractual arrangementsentered into. An equity instrument is any contract thatevidences a residual interest in the assets of the groupafter deducting all of its liabilities.Equity instrumentsEquity instruments issued by the group are recorded at theproceeds received, net of direct issue costs.BorrowingsThe group’s default treatment is that bonds, loans andoverdrafts are initially measured at fair value being thecash proceeds received net of any direct issue costs. Theyare subsequently measured at amortised cost applyingthe effective interest method. The difference between thenet cash proceeds received at inception and the principalcash flows due at maturity is accrued over the term of theborrowing.The default treatment of measuring at amortised cost,whilst associated hedging derivatives are recognised atfair value, presents an accounting measurement mismatchthat has the potential to introduce considerable volatilityto both the income statement and the statement offinancial position. Therefore, where feasible, the grouptakes advantage of the provisions under IAS 39 ‘FinancialInstruments: Recognition and Measurement’ to fair value itsborrowing instruments to reduce this volatility and betterrepresent the economic hedges that exist between thegroup’s borrowings and associated derivative contracts.160
UNITED UTILITIES GROUP PLC ANNUAL REPORT AND FINANCIAL STATEMENTS <strong>2015</strong>Stock Code: UU.<strong>united</strong><strong>utilities</strong>.comA6 ACCOUNTING POLICIES continuedWhere feasible, the group designates its financialinstruments within fair value hedge relationships. Inorder to apply fair value hedge accounting, it must bedemonstrated that the hedging derivative has been, and willcontinue to be, a highly effective hedge of the risk beinghedged within the applicable borrowing instrument.Borrowings designated within a fair value hedgerelationshipWhere designated, bonds and loans are initially measured atfair value being the cash proceeds received net of any directissue costs. They are subsequently adjusted for any changein fair value attributable to the risk being hedged at each<strong>report</strong>ing date, with the change being charged or credited tofinance expense in the income statement.Hedge accounting is discontinued prospectively when thehedging instrument is sold, terminated or exercised, orwhere the hedge relationship no longer qualifies for hedgeaccounting.Borrowings designated at fair value through profit or lossDesignation is made where the requirements to designatewithin a fair value hedge cannot be met at inception despitethere being significant fair value offset between theborrowing and the hedging derivative. Where designated,bonds and loans are initially measured at fair value beingthe cash proceeds received and are subsequently measuredat fair value at each <strong>report</strong>ing date, with changes in fairvalue being charged or credited to finance expense in theincome statement.Derivative financial instrumentsDerivative financial instruments are measured at fairvalue at each <strong>report</strong>ing date, with changes in fair valuebeing charged or credited to finance expense in the incomestatement. The group enters into financial derivativescontracts to manage its financial exposure to changes inmarket rates (see note A3).Derivatives and borrowings – valuationWhere an active market exists, designated borrowings andderivatives recorded at fair value are valued using quotedmarket prices. Otherwise, they are valued using a netpresent value valuation model. The model uses applicableinterest rate curve data at each <strong>report</strong>ing date to determineany floating cash flows. Projected future cash flowsassociated with each financial instrument are discounted tothe <strong>report</strong>ing date using discount factors derived from theapplicable interest curves adjusted for counterparty creditrisk where appropriate. Discounted foreign currency cashflows are converted into sterling at the spot exchange rateat each <strong>report</strong>ing date. Assumptions are made with regardto credit spreads based on indicative pricing data.The valuation of debt designated in a fair value hedgerelationship is calculated based on the risk being hedgedas prescribed by IAS 39 ‘Financial Instruments: Recognitionand Measurement’. The group’s policy is to hedge itsexposure to changes in the applicable underlying interestrate and it is this portion of the cash flows that is includedin the valuation model (excluding any applicable companycredit risk spread).The valuation of debt designated at fair value through theprofit or loss incorporates an assumed credit risk spreadin the applicable discount factor. Credit spreads aredetermined based on indicative pricing data.InventoriesInventories are stated at the lower of cost and netrealisable value. For properties held for resale, costincludes the cost of acquiring and developing the sites,including borrowing costs where applicable.Net realisable value represents the estimated selling priceless all estimated costs of completion and costs to beincurred in marketing, selling and distribution.Employee benefitsRetirement benefit obligationsThe group operates two defined benefit pension schemes,which are independent of the group’s finances, for itsemployees. Actuarial valuations of the schemes are carriedout as determined by the pension scheme trustees usingthe projected unit credit method at intervals of not morethan three years, the rates of contribution payable andthe pension cost being determined on the advice of theactuaries, having regard to the results of these valuations.In any intervening years, the actuaries review the continuingappropriateness of the contribution rates.Defined benefit assets are measured at fair value whileliabilities are measured at present value. The differencebetween the two amounts is recognised as a surplus orobligation in the statement of financial position.The cost of providing pension benefits to employeesrelating to the current year’s service (including curtailmentgains and losses) is included within the income statementwithin employee benefits expense. The net interest onthe schemes’ surplus/obligation is included in the incomestatement within investment income or finance expense.Remeasurement gains and losses are recognised outsidethe income statement in retained earnings and presented inthe statement of comprehensive income.In addition, the group also operates a defined contributionpension section within the United Utilities Pension Scheme.Payments are charged as employee costs as they fall due.The group has no further payment obligations once thecontributions have been paid.STRATEGIC REPORTSHAREHOLDER INFORMATION FINANCIAL STATEMENTSGOVERNANCE161
UNITED UTILITIES GROUP PLC ANNUAL REPORT AND FINANCIAL STATEMENTS <strong>2015</strong>Stock Code: UU.<strong>united</strong><strong>utilities</strong>.comNotes to the financial statements – appendicesA6 ACCOUNTING POLICIES continuedShare-based compensation arrangementsThe group operates equity-settled, share-basedcompensation plans, issued to certain employees. Theequity-settled share-based payments are measured at fairvalue at the date of grant. The fair value determined at thegrant date is expensed on a straight-line basis over thevesting period, based on estimates of the number of optionsthat are expected to vest. Fair value is based on simulationmodels, according to the relevant measures of performance.The group has the option to settle some of these equitysettledshare-based payments in cash.At each <strong>report</strong>ing date, the group revises its estimate of thenumber of options that are expected to become exercisablewith the impact of any revision being recognised in theincome statement, and a corresponding adjustment toequity over the remaining vesting period.ProvisionsProvisions are recognised when the group has a presentlegal or constructive obligation as a result of past events,it is probable that an outflow of resources will be requiredto settle the obligation, and the amount can be reliablyestimated. Expenditure that relates to an existing conditioncaused by past operations that does not contribute tocurrent or future earnings is expensed.Foreign currency translationTransactions and balancesTransactions in foreign currencies are recorded at theexchange rates applicable on the dates of the transactions.At each <strong>report</strong>ing date, monetary assets and liabilitiesdenominated in foreign currencies are translated intosterling at the relevant rates of exchange applicable on thatdate. Gains and losses arising on retranslation are includedin net profit or loss for the period. Exchange differencesarising on investments in equity instruments classified asavailable for sale are included in the gains or losses arisingfrom changes in fair value which are recognised directly inequity.In order to hedge its exposure to certain foreign exchangerisks, the group enters into derivative instruments (seenote A3).Group companiesOn consolidation, the statements of financial position ofoverseas subsidiaries and joint ventures (none of which hasthe currency of a hyperinflationary economy) are translatedinto sterling at exchange rates applicable at each <strong>report</strong>ingdate. The income statements are translated into sterlingusing the average rate unless exchange rates fluctuatesignificantly in which case the exchange rate at the datethe transaction occurred is used. Exchange differencesresulting from the translation of such statements offinancial position at rates ruling at the beginning and end ofthe period, together with the differences between incomestatements translated at average rates and rates ruling atthe period end, are dealt with as movements on the group’scumulative exchange reserve, a separate component ofequity. Such translation differences are recognised asincome or expense in the period in which the operation isdisposed of.Goodwill and fair value adjustments arising on theacquisition of a foreign entity are treated as assets andliabilities of the foreign entity and translated at the closingrate. The group has elected to treat goodwill and fair valueadjustments arising on acquisitions before the date ofimplementation of IFRS 3 ‘Business Combinations’ (1 April1999) as sterling denominated assets and liabilities.Grants and contributionsGrants and contributions receivable in respect of property,plant and equipment are treated as deferred income, whichis credited to the income statement over the estimateduseful economic lives of the related assets.LeasesLeases are classified according to the substance of thetransaction. Operating leases are leases that do nottransfer substantially all the risks and rewards of ownershipto the lessee.Operating lease rentals are charged to the incomestatement on a straight-line basis over the period of thelease.162
UNITED UTILITIES GROUP PLC ANNUAL REPORT AND FINANCIAL STATEMENTS <strong>2015</strong>Stock Code: UU.<strong>united</strong><strong>utilities</strong>.comSHAREHOLDER INFORMATION FINANCIAL STATEMENTSGOVERNANCESTRATEGIC REPORT163
UNITED UTILITIES GROUP PLC ANNUAL REPORT AND FINANCIAL STATEMENTS <strong>2015</strong>Stock Code: UU.<strong>united</strong><strong>utilities</strong>.comShareholder informationKey dates3 August <strong>2015</strong>Pay the 2014/15 final dividend25 November <strong>2015</strong>Announce the half-year resultsfor the <strong>2015</strong>/16 financial yearDividends paid direct to your bankWhy not make life easy andhave your dividends paidstraight into your bank?1 February 2016Pay the <strong>2015</strong>/16 interimdividendMay 2016Announce the final results forthe <strong>2015</strong>/16 financial yearJune 2016Publish the Annual Report andFinancial Statements for the<strong>2015</strong>/16 financial year• The dividend goes directly intoyour bank account and is availablestraight away• No need to pay dividend chequesinto your bank account• No risk of losing cheques in thepost• No risk of having to replace spoiledor out-of-date cheques• It’s cost-effective for yourcompanyGo to Equiniti formore information viashareview.co.ukTo take advantage of this, pleasecontact Equiniti via shareview.co.ukor complete the dividend mandateform that you receive with your nextdividend cheque.If you choose to have your dividendpaid directly into your bank accountyou’ll receive one tax voucher eachyear. This will be issued with theinterim dividend normally paid inFebruary and will contain details ofall the dividends paid in that tax year.If you’d like to receive a tax voucherwith each dividend payment, pleasecontact Equiniti.Online <strong>annual</strong> <strong>report</strong>helping life flow smoothlyhelping life flow smoothlyOur <strong>annual</strong> <strong>report</strong> is availableonline. View or download thefull Annual Report and FinancialStatements from:corporate.<strong>united</strong><strong>utilities</strong>.comElectronic communicationsWe’re encouraging our shareholders toreceive their shareholder informationby email and via our website. Notonly is this a quicker way for you toreceive information, it helps us to bemore sustainable by reducing paperand printing materials and loweringpostage costs.Registering for electronicshareholder communications is verystraightforward, and is done onlinevia shareview.co.uk which is a websiteprovided by our registrar, Equiniti.To go straight to the investor pageon our website scan the QR codewith your smartphoneLog on to shareview.co.uk and you can:• set up electronic shareholdercommunication;• view your shareholdings;• update your address details if youchange your address; and• get your dividends paid directly intoyour bank account.Please do not use any electronicaddress provided in this notice or inany related document to communicatewith the company for any purposesother than those expressly stated.See further information online:corporate.<strong>united</strong><strong>utilities</strong>.com164
UNITED UTILITIES GROUP PLC ANNUAL REPORT AND FINANCIAL STATEMENTS <strong>2015</strong>Stock Code: UU.<strong>united</strong><strong>utilities</strong>.comKeeping you in the pictureYou can find information about UnitedUtilities quickly and easily on ourwebsite: corporate.<strong>united</strong><strong>utilities</strong>.comHere the <strong>annual</strong> <strong>report</strong> and financialstatements, corporate responsibility<strong>report</strong>, other <strong>report</strong>s, companyannouncements, the half-year andfinal announcements and associatedpresentations are published.RegistrarThe group’s registrar, Equiniti, canbe contacted on 0871 384 2041 ortextphone for those with hearingdifficulties: 0871 384 2255. Calls tothese numbers will be charged at 8pper minute plus network extras. Linesare open 8.30 am to 5.30 pm, Mondayto Friday excluding bank holidays.The address is:Equiniti, Aspect House, Spencer Road,Lancing, West Sussex, BN99 6DA.Overseas shareholders may contactthem on: +44 (0)121 415 7048Equiniti offers a share dealing serviceby telephone: 0845 603 7037 andonline: shareview.co.uk/dealingEquiniti also offers a stocks and sharesISA for United Utilities shares.For more information, call 0845 3000430 or go to: shareview.co.uk/dealingWarning to shareholdersREMEMBER: if it sounds too goodto be true, it probably is!Key shareholder factsBalance analysis as at31 March <strong>2015</strong>2.9274,8251-1,0006.4619,1221,001-10,000Number of holdings% of shares748 3.13Please be very wary of anyunsolicited contact about yourinvestments or offers of freecompany <strong>report</strong>s. It may be froman overseas ‘broker’ who could sellyou worthless or high risk shares.If you deal with an unauthorisedfirm, you would not be eligible toreceive payment under the FinancialServices Compensation Scheme.Further information and a listof unauthorised firms that havetargeted UK investors is availablefrom the Financial ConductAuthority atfca.org.uk/consumers/protectyourself/unauthorised-firms10,001-100,000Dividend history – pence per shareLooking after your investmentWe were delighted to retain ‘WorldClass’ status in the Dow JonesSustainability index for the seventhconsecutive year and, for the first time,we became leader in the multi-utilityand water sector. We achieved our bestever result in the Carbon DisclosureProject and are now members of the323 15.80100,001-1,000,00041.59941,000,001-10,000,00011 30.1010,000,001-to highestPrinted by Jones and Palmer on FSC® certified paperShareholders by locationUnited Kingdom 62%Europe 14%North America 21%Rest of the World 3%2011 2012 2013 2014 <strong>2015</strong>Interim 10.00 10.67 11.44 12.01 12.56Final 20.00 21.34 22.88 24.03 25.14Total ordinary 30.00 32.01 34.32 36.04 37.70FTSE 350 Disclosure Leadership Index.This year we also received 3.5 stars inBusiness in the Community’s corporateresponsibility index. Recently wesecured the Carbon Trust WaterStandard for our efforts to reducewater use in West Cumbria.This document is printed on Claro Silk Coated which containsEnvironmental Chlorine Free (ECF) virgin fibre sourced fromwell-managed, responsible, FSC® certified forests.SHAREHOLDER INFORMATION FINANCIAL STATEMENTSGOVERNANCE STRATEGIC REPORT165
United Utilities Group PLCHaweswater HouseLingley Mere Business ParkLingley Green AvenueGreat SankeyWarringtonWA5 3LPTelephone +44 (0)1925 237000Stock Code: UU.Registered in England and WalesRegistered number 6559020Pictured: Haweswater reservoir inCumbria, which supplies around aquarter of the North West’s dailywater needs.