AIR PRESSURE AND WINDS Chapter 8 Atmospheric Pressure ...
AIR PRESSURE AND WINDS Chapter 8 Atmospheric Pressure ...
AIR PRESSURE AND WINDS Chapter 8 Atmospheric Pressure ...
You also want an ePaper? Increase the reach of your titles
YUMPU automatically turns print PDFs into web optimized ePapers that Google loves.
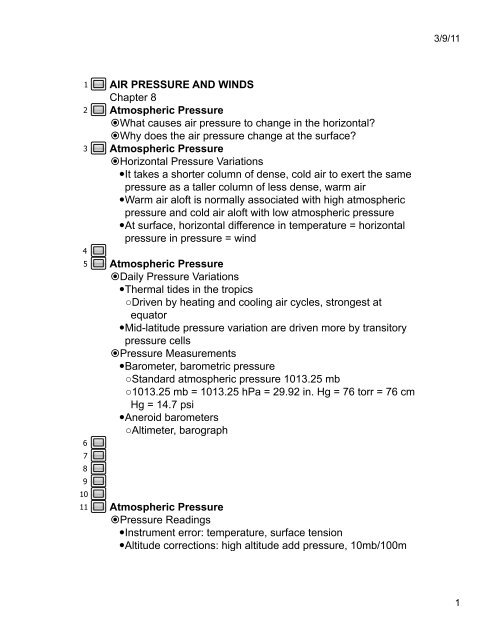
133/9/111234567891011<strong>AIR</strong> <strong>PRESSURE</strong> <strong>AND</strong> <strong>WINDS</strong><strong>Chapter</strong> 8<strong>Atmospheric</strong> <strong>Pressure</strong> What causes air pressure to change in the horizontal? Why does the air pressure change at the surface?<strong>Atmospheric</strong> <strong>Pressure</strong> Horizontal <strong>Pressure</strong> Variations It takes a shorter column of dense, cold air to exert the samepressure as a taller column of less dense, warm air Warm air aloft is normally associated with high atmosphericpressure and cold air aloft with low atmospheric pressure At surface, horizontal difference in temperature = horizontalpressure in pressure = wind<strong>Atmospheric</strong> <strong>Pressure</strong> Daily <strong>Pressure</strong> Variations Thermal tides in the tropics○ Driven by heating and cooling air cycles, strongest atequator Mid-latitude pressure variation are driven more by transitorypressure cells <strong>Pressure</strong> Measurements Barometer, barometric pressure○ Standard atmospheric pressure 1013.25 mb○ 1013.25 mb = 1013.25 hPa = 29.92 in. Hg = 76 torr = 76 cmHg = 14.7 psi Aneroid barometers○ Altimeter, barograph<strong>Atmospheric</strong> <strong>Pressure</strong> <strong>Pressure</strong> Readings Instrument error: temperature, surface tension Altitude corrections: high altitude add pressure, 10mb/100mabove sea level121
910113/9/1112131415161718192021222324 Altitude corrections: high altitude add pressure, 10mb/100mabove sea level○ Adjusted reading: Sea-level <strong>Pressure</strong>Surface and Upper Level Charts Sea-level pressure chart: constant height This is the most common pressure chart you see on weathermaps.Surface and Upper Level Charts Upper level or isobaric chart: constant pressure surface (e.g.500mb) High heights correspond to higher than normal pressures ata given latitude and vice versaSurface and Upper Level Charts Observation: Constant <strong>Pressure</strong> Surface <strong>Pressure</strong> altimeter in an airplane causes path along constantpressure not elevation May cause sudden drop in elevation Radio altimeter offers constant elevationNewton’s Law of Motion An object in motion will remain in motion as long as no force isexecuted on the object. The force exerted on an object equals its mass times theacceleration produced. Acceleration: speeding up, slowing down, change of directionof an object.Forces that Influence Winds <strong>Pressure</strong> Gradient Force: difference in pressure over distance Directed perpendicular to isobars from high to low. Large change in pressure over a short distance is a strongpressure gradient and vice versa.25262728292
243/9/11252627282930313233343536373839404142 Large change in pressure over a short distance is a strongpressure gradient and vice versa. This is the force that causes the wind to blow.Forces that Influence Winds Coriolis Force Apparent deflection due to rotation of the Earth Right in northern hemisphere and left in southernhemisphere Stronger wind = greater deflection No Coriolis effect at the equator, greatest at poles. Only influences direction, not speed Only has significant impact over long distancesForces that Influence Winds Geostrophic Winds “Earth turning” winds Travel parallel to isobars Spacing of isobars indicates speed; close = fast, spread out= slow Why parallel? The pressure gradient force is in equilibriumwith the Coriolis force.Forces that Influence Winds Gradient Winds Aloft Cyclonic: counterclockwise (LOW) Anticyclonic: clockwise (HIGH) These rotations are opposite in southern hemisphere Gradient wind (aloft, above the level of frictional influence):parallel to curved isobars3
3/9/113940414243444546474849parallel to curved isobarsForces that Influence Winds Winds on Upper-level Charts Winds parallel to contour lines and flow west to east○ What about southern hemisphere? East to west? Heights decrease from north to south Surface Winds Friction reduces the wind speed which in turn decrease theCoriolis effect. Winds cross the isobars at about 30° into low pressure andout of high pressureWinds and Vertical Motion Replacement of lateral spreading of air results in the rise of airover a low pressure and subsidence over high pressureHomework for <strong>Chapter</strong> 8 <strong>Chapter</strong> 8 Questions for Review, p. 219 #1, 6, 8-10, 12, 16, 19 <strong>Chapter</strong> 8 Questions for Thought, p. 220 #8, 14 <strong>Chapter</strong> 8 Problems and Exercises, p. 221 #1, 4Project for <strong>Chapter</strong> 8 Download Project 5 from the course webpage.4


