

Determinants of Capital Structure for Turkish Firms: A Panel Data ...
Determinants of Capital Structure for Turkish Firms: A Panel Data ...
Determinants of Capital Structure for Turkish Firms: A Panel Data ...

Create successful ePaper yourself
Turn your PDF publications into a flip-book with our unique Google optimized e-Paper software.
181 International Research Journal <strong>of</strong> Finance and Economics - Issue 29 (2009)<br />
apply to the new debt issues. Also when it is not sensible to issue any more debt, they would be obliged<br />
to realize new equity issues. This theory maintains that businesses adhere to a hierarchy <strong>of</strong> financing<br />
sources and prefer internal financing when available, and debt is preferred over equity if external<br />
financing is required. The theory suggests that the firms apply to external finance if and only if internal<br />
finance has not been sufficient. In case <strong>of</strong> using external financing, the firms issue the cheapest security<br />
first so they start with debt, then possibly applies to hybrid securities such as convertible bonds, and<br />
the issue equity only as a last resort. In contrast to the trade-<strong>of</strong>f theory, there is no well-defined target<br />
leverage ratio in the pecking order theory. Debt is considered the first source <strong>of</strong> external finance on the<br />
pecking order. Equity is issued only as a last resort, when the debt capacity is fully exhausted. Tax<br />
benefits <strong>of</strong> debt are assumed to have a second-order effect. The debt ratio varies when there is an<br />
imbalance between internal funds and real investment opportunities.<br />
The paper is organized as follows. The next section reports some stylized facts from the<br />
<strong>Turkish</strong> economy using the data taken from Istanbul Stock Exchange ISE-100 index. The third section<br />
aims to define some possible determinants <strong>of</strong> the capital structure <strong>of</strong> the firms. The fourth section<br />
briefly deals with the estimation methodology, whilst the ex-post findings are presented in section five.<br />
The last section summarizes the results to conclude the paper.<br />
2. Some Stylized Facts<br />
For an empirical research, we first try to figure out the leverage use <strong>of</strong> the firms. By this means, we use<br />
the financial reports <strong>of</strong> the firms traded at the ISE-100 index. However, we make some adjustments in<br />
the sense that since banks and insurance firms have been subject to specific rules, we exclude these<br />
institutions from our database. The financial reports used in the analysis cover the period <strong>of</strong> 2000-2007<br />
and the total number <strong>of</strong> observations amounts to the sum <strong>of</strong> 359.<br />
In order to examine the leverage position <strong>of</strong> the firms, we identify the measure <strong>of</strong> leverage, that<br />
is L, which denotes the ratio <strong>of</strong> debt use to finance total assets. The leverage parameters are computed<br />
within the years 2000-2007 through the financial reports <strong>of</strong> 42 firms traded in the Istanbul Stock<br />
Exchange ISE-100 index:<br />
Total liabilities<br />
L = (1)<br />
Total assets<br />
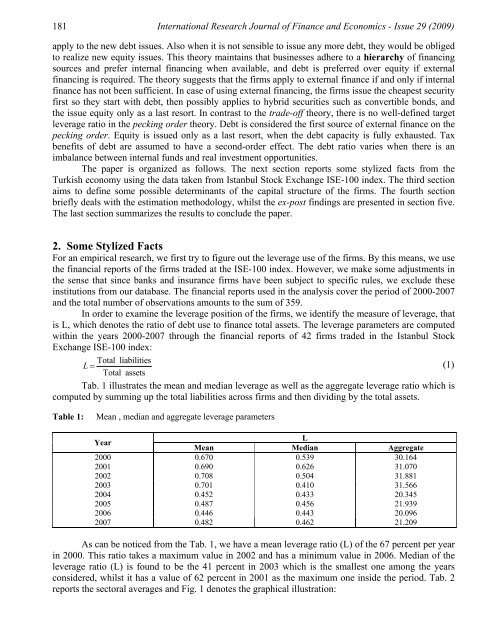
Tab. 1 illustrates the mean and median leverage as well as the aggregate leverage ratio which is<br />
computed by summing up the total liabilities across firms and then dividing by the total assets.<br />
Table 1: Mean , median and aggregate leverage parameters<br />
Year<br />
Mean<br />
L<br />
Median Aggregate<br />
2000 0.670 0.539 30.164<br />
2001 0.690 0.626 31.070<br />
2002 0.708 0.504 31.881<br />
2003 0.701 0.410 31.566<br />
2004 0.452 0.433 20.345<br />
2005 0.487 0.456 21.939<br />
2006 0.446 0.443 20.096<br />
2007 0.482 0.462 21.209<br />
As can be noticed from the Tab. 1, we have a mean leverage ratio (L) <strong>of</strong> the 67 percent per year<br />
in 2000. This ratio takes a maximum value in 2002 and has a minimum value in 2006. Median <strong>of</strong> the<br />
leverage ratio (L) is found to be the 41 percent in 2003 which is the smallest one among the years<br />
considered, whilst it has a value <strong>of</strong> 62 percent in 2001 as the maximum one inside the period. Tab. 2<br />
reports the sectoral averages and Fig. 1 denotes the graphical illustration:


