

Determinants of Capital Structure for Turkish Firms: A Panel Data ...
Determinants of Capital Structure for Turkish Firms: A Panel Data ...
Determinants of Capital Structure for Turkish Firms: A Panel Data ...

Create successful ePaper yourself
Turn your PDF publications into a flip-book with our unique Google optimized e-Paper software.
183 International Research Journal <strong>of</strong> Finance and Economics - Issue 29 (2009)<br />
Hansen (1989) report a positive correlation, whilst Feri and Jones (1979) suggest that firm’s size has a<br />
significant impact on leverage even though the sectoral decisions have been observed to vary among<br />
industries. The measure <strong>of</strong> size used in this paper is the natural logaritm <strong>of</strong> net sales similar to the<br />
approach followed by Drobetz and Fix (2003). They discuss the logaritm <strong>of</strong> total assets as an alternate,<br />
however, they accept the net sales as a better proxy <strong>for</strong> the mesure <strong>of</strong> size.<br />
Growth opportunities (GO): The trade-<strong>of</strong>f theory suggests that firms with more investment<br />
opportunities have less leverage because they have stronger incentives to avoid under-investment and<br />
asset substitution that can arise from stockholder-bondholder agency conflicts (Drobetz and Fix 2003).<br />
Jensen’s (1986) free cash flow theory similarly discusses that firms with more investment opportunities<br />
have less need <strong>for</strong> the disciplining effect <strong>of</strong> debt payments to control free cash flows. In this paper, we<br />
define growth opportunies as the ratio <strong>of</strong> book value to market value.<br />
Pr<strong>of</strong>itability: Pr<strong>of</strong>itability plays an important role in leverage decisions. To test the effect <strong>of</strong><br />
pr<strong>of</strong>itability on leverage, we use twomeasures, i.e., return on assets (ROA) and pr<strong>of</strong>it margin on sales<br />
(PMS). ROA represents the contribution <strong>of</strong> the firm’s assets on pr<strong>of</strong>itability creation. We test the<br />
effect <strong>of</strong> ROA in leverage decisions. Pr<strong>of</strong>it margin on sales (PMS) is the ratio <strong>of</strong> operating income<br />
over total sales.<br />
Nondebt tax shield: Although interest is tax deductable due to default risk, firms may tend to<br />
use other tax shields. Tax laws allow certain tax deductions to be made from a company’s taxable<br />
income. Depreciation on tangibles and intangibles are also tax deductable. We use two measures <strong>of</strong> tax<br />
shield opportunities. One is the ratio <strong>of</strong> total depreciation to total assets (DA) and the other measure is<br />
the ratio <strong>of</strong> depreciation over operating pr<strong>of</strong>it (DoP).<br />
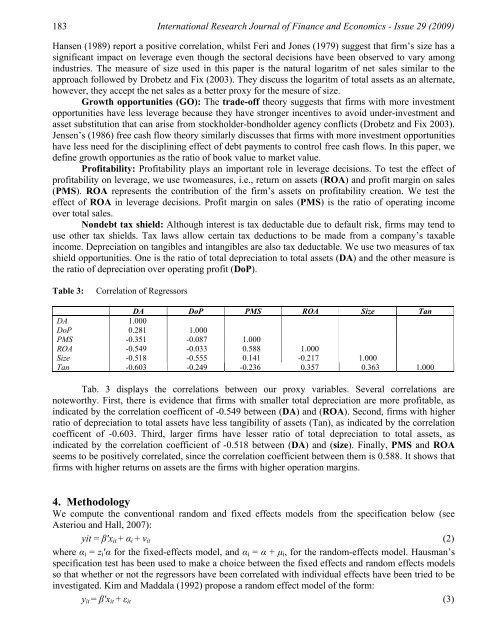
Table 3: Correlation <strong>of</strong> Regressors<br />
DA DoP PMS ROA Size Tan<br />
DA 1.000<br />
DoP 0.281 1.000<br />
PMS -0.351 -0.087 1.000<br />
ROA -0.549 -0.033 0.588 1.000<br />
Size -0.518 -0.555 0.141 -0.217 1.000<br />
Tan -0.603 -0.249 -0.236 0.357 0.363 1.000<br />
Tab. 3 displays the correlations between our proxy variables. Several correlations are<br />
noteworthy. First, there is evidence that firms with smaller total depreciation are more pr<strong>of</strong>itable, as<br />
indicated by the correlation coefficent <strong>of</strong> -0.549 between (DA) and (ROA). Second, firms with higher<br />
ratio <strong>of</strong> depreciation to total assets have less tangibility <strong>of</strong> assets (Tan), as indicated by the correlation<br />
coefficent <strong>of</strong> -0.603. Third, larger firms have lesser ratio <strong>of</strong> total depreciation to total assets, as<br />
indicated by the correlation coefficient <strong>of</strong> -0.518 between (DA) and (size). Finally, PMS and ROA<br />
seems to be positively correlated, since the correlation coefficient between them is 0.588. It shows that<br />
firms with higher returns on assets are the firms with higher operation margins.<br />
4. Methodology<br />
We compute the conventional random and fixed effects models from the specification below (see<br />
Asteriou and Hall, 2007):<br />
yit = β′xit + αi + νit<br />
(2)<br />
where αi = zi′α <strong>for</strong> the fixed-effects model, and αi = α + μi, <strong>for</strong> the random-effects model. Hausman’s<br />
specification test has been used to make a choice between the fixed effects and random effects models<br />
so that whether or not the regressors have been correlated with individual effects have been tried to be<br />
investigated. Kim and Maddala (1992) propose a random effect model <strong>of</strong> the <strong>for</strong>m:<br />
yit = β′xit + εit<br />
(3)


