Country report France - Construction Labour Research
Country report France - Construction Labour Research
Country report France - Construction Labour Research
You also want an ePaper? Increase the reach of your titles
YUMPU automatically turns print PDFs into web optimized ePapers that Google loves.
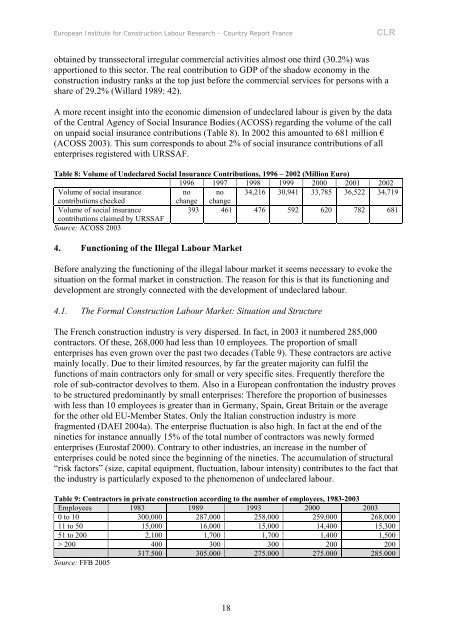
European Institute for <strong>Construction</strong> <strong>Labour</strong> <strong>Research</strong> – <strong>Country</strong> Report <strong>France</strong>CLRobtained by transsectoral irregular commercial activities almost one third (30.2%) wasapportioned to this sector. The real contribution to GDP of the shadow economy in theconstruction industry ranks at the top just before the commercial services for persons with ashare of 29.2% (Willard 1989: 42).A more recent insight into the economic dimension of undeclared labour is given by the dataof the Central Agency of Social Insurance Bodies (ACOSS) regarding the volume of the callon unpaid social insurance contributions (Table 8). In 2002 this amounted to 681 million €(ACOSS 2003). This sum corresponds to about 2% of social insurance contributions of allenterprises registered with URSSAF.Table 8: Volume of Undeclared Social Insurance Contributions, 1996 – 2002 (Million Euro)1996 1997 1998 1999 2000 2001 2002Volume of social insuranceno no 34,216 30,941 33,785 36,522 34,719contributions checkedchange changeVolume of social insurance393 461 476 592 620 782 681contributions claimed by URSSAFSource: ACOSS 20034. Functioning of the Illegal <strong>Labour</strong> MarketBefore analyzing the functioning of the illegal labour market it seems necessary to evoke thesituation on the formal market in construction. The reason for this is that its functioning anddevelopment are strongly connected with the development of undeclared labour.4.1. The Formal <strong>Construction</strong> <strong>Labour</strong> Market: Situation and StructureThe French construction industry is very dispersed. In fact, in 2003 it numbered 285,000contractors. Of these, 268,000 had less than 10 employees. The proportion of smallenterprises has even grown over the past two decades (Table 9). These contractors are activemainly locally. Due to their limited resources, by far the greater majority can fulfil thefunctions of main contractors only for small or very specific sites. Frequently therefore therole of sub-contractor devolves to them. Also in a European confrontation the industry provesto be structured predominantly by small enterprises: Therefore the proportion of businesseswith less than 10 employees is greater than in Germany, Spain, Great Britain or the averagefor the other old EU-Member States. Only the Italian construction industry is morefragmented (DAEI 2004a). The enterprise fluctuation is also high. In fact at the end of thenineties for instance annually 15% of the total number of contractors was newly formedenterprises (Eurostaf 2000). Contrary to other industries, an increase in the number ofenterprises could be noted since the beginning of the nineties. The accumulation of structural“risk factors” (size, capital equipment, fluctuation, labour intensity) contributes to the fact thatthe industry is particularly exposed to the phenomenon of undeclared labour.Table 9: Contractors in private construction according to the number of employees, 1983-2003Employees 1983 1989 1993 2000 20030 to 10 300,000 287,000 258,000 259,000 268,00011 to 50 15,000 16,000 15,000 14,400 15,30051 to 200 2,100 1,700 1,700 1,400 1,500> 200 400 300 300 200 200317.500 305.000 275.000 275.000 285.000Source: FFB 200518


