Tamilnadu, February 2013 - National Horticulture Mission
Tamilnadu, February 2013 - National Horticulture Mission
Tamilnadu, February 2013 - National Horticulture Mission
You also want an ePaper? Increase the reach of your titles
YUMPU automatically turns print PDFs into web optimized ePapers that Google loves.
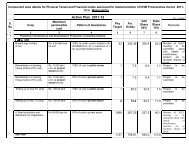
Table 8: Area, Production and Productivity of <strong>Horticulture</strong> Cropsin Salem districtA. FruitSl.No.Area and Production of <strong>Horticulture</strong> Crops from 2007-08 to 2011-12.Crops Area (000’ ha) Production (000’ MT) Productivity (MT/ha)2007-08 2011-12 %Change2007-08 2011-12 %Change2007-08 2011-12 %Change1 Mango 3968 5826 46.8 31744 55347 74.4 8.00 9.50 18.82 Banana 1273 2170 70.5 57285 108500 89.4 45.00 50.00 11.13 Guava 131 239 82.4 2882 5975 107.3 22.00 25.00 13.64 Lemon 46 68 47.8 736 1088 47.8 16.00 16.00 0.05 Orange 764 615 -19.5 19100 15375 -19.5 25.00 25.00 0.06 Sapota 128 268 109.4 2816 6164 118.9 22.00 23.00 4.57 Jack 10 28 180.0 300 980 226.7 30.00 35.00 16.78 Nelli 63 115 82.5 378 9209OtherFruits 116 202 74.1 2320 7070 204.7 20.00 35.00 75.0B. SpicesTotal 6499 9531 46.7 117561 201419 71.3 18.09 21.13 16.8Area and Production of <strong>Horticulture</strong> Crops from 2007-08 to 2011-12.Sl.No.Crops Area (000’ ha) Production(000’ MT)2007-08 2011-12 %Change%ChangeProductivity (MT/ha) %Change2007-08 2011-12 2007-08 2011-121 Chillies 398 873 119.3 1990 26190 1216.1 5.00 30.00 500.02 Turmeric 2131 12456 484.5 10655 311400 2822.6 5.00 25.00 400.03 Coriander 106 30 -71.7 1060 450 -57.5 10.00 15.00 50.04 Tamarind 1320 258 -80.5 2640 3870 46.6 2.00 15.00 650.05 Pepper 873.5 826 -5.4 873.5 1652 89.1 1.00 2.00 100.06 Cardamom 38 39 2.6 0 9.75 0.0 0.00 0.25 0.07 Clove 51 50 -2.0 0 37.5 0.0 0.00 0.75 0.08 Curryleaf 274 355 29.6 11880 14200 19.5 43.36 40.00 -7.7Total5191.5 14887 186.8 29098.5 357809 1129.6 5.61 24.04 328.8C. FlowerArea and Production of <strong>Horticulture</strong> Crops from 2007-08 to 2011-12.Sl.No.Crops Area (000’ ha) Production (000’ MT) Productivity (MT/ha)2007-08 2011-12 %Change2007-08 2011-12 %Change2007-08 2011-12 %Change1 Rose 47 46 -2.1 376 460 22.3 8.00 10.00 25.02 Jasmine 410 546 33.2 3690 5460 48.0 9.00 10.00 11.13 Crossandra 167 19 -88.6 668 76 -88.6 4.00 4.00 0.04Chrysanthemum494 1285 160.1 6916 19275 178.7 14.00 15.00 7.15 Tuberose 58 93 60.3 464 930 100.4 8.00 10.00 25.06 Nerium 38 302 694.7 342 3020 783.0 9.00 10.00 11.17 Cock’s comb 11 14 27.3 44 70 59.1 4.00 5.00 25.08 Others 278.5 92 -67.0 1671 920 -44.9 6.00 10.00 66.7Total 1503.5 2397 59.4 14171.0 30211 113.2 9.43 12.60 33.719


