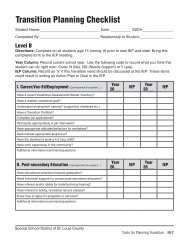
Guidance and Counseling - Special School District
Guidance and Counseling - Special School District
Guidance and Counseling - Special School District

Create successful ePaper yourself
Turn your PDF publications into a flip-book with our unique Google optimized e-Paper software.
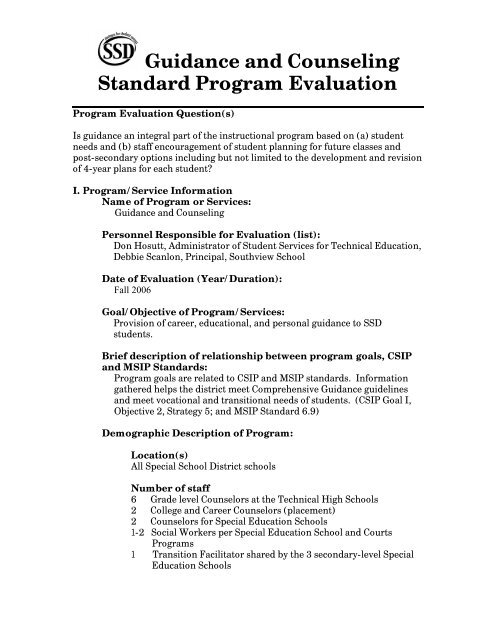
<strong>Guidance</strong> <strong>and</strong> <strong>Counseling</strong>St<strong>and</strong>ard Program EvaluationProgram Evaluation Question(s)Is guidance an integral part of the instructional program based on (a) studentneeds <strong>and</strong> (b) staff encouragement of student planning for future classes <strong>and</strong>post-secondary options including but not limited to the development <strong>and</strong> revisionof 4-year plans for each student?I. Program/Service InformationName of Program or Services:<strong>Guidance</strong> <strong>and</strong> <strong>Counseling</strong>Personnel Responsible for Evaluation (list):Don Hosutt, Administrator of Student Services for Technical Education,Debbie Scanlon, Principal, Southview <strong>School</strong>Date of Evaluation (Year/Duration):Fall 2006Goal/Objective of Program/Services:Provision of career, educational, <strong>and</strong> personal guidance to SSDstudents.Brief description of relationship between program goals, CSIP<strong>and</strong> MSIP St<strong>and</strong>ards:Program goals are related to CSIP <strong>and</strong> MSIP st<strong>and</strong>ards. Informationgathered helps the district meet Comprehensive <strong>Guidance</strong> guidelines<strong>and</strong> meet vocational <strong>and</strong> transitional needs of students. (CSIP Goal I,Objective 2, Strategy 5; <strong>and</strong> MSIP St<strong>and</strong>ard 6.9)Demographic Description of Program:Location(s)All <strong>Special</strong> <strong>School</strong> <strong>District</strong> schoolsNumber of staff6 Grade level Counselors at the Technical High <strong>School</strong>s2 College <strong>and</strong> Career Counselors (placement)2 Counselors for <strong>Special</strong> Education <strong>School</strong>s1-2 Social Workers per <strong>Special</strong> Education <strong>School</strong> <strong>and</strong> CourtsPrograms1 Transition Facilitator shared by the 3 secondary-level <strong>Special</strong>Education <strong>School</strong>s
<strong>Guidance</strong> <strong>and</strong> <strong>Counseling</strong>St<strong>and</strong>ard Program EvaluationParticipantsAdministrator/Supervisor of <strong>Guidance</strong> Counselors for <strong>Special</strong>Education Buildings, Representative SSD Social Workers, Technical<strong>School</strong> <strong>Guidance</strong> Advisory Committee (See attachment T-5).Questions developed from most recent Student Needs Surveys forall schools <strong>and</strong> High <strong>School</strong>s That Work Surveys <strong>and</strong> the TechnicalHigh <strong>School</strong>s. Student Needs surveys include responses fromstudents, parents, <strong>and</strong> staff while High <strong>School</strong>s That Work Surveysinclude responses from students <strong>and</strong> staff.Length of program/serviceOngoing.II. Description of Stakeholders Engagement in Program Evaluation(check stakeholders utilized)Listed individuals participating on one or more contributingcommittees.Don Hosutt – Administrator for Student Services,Technical EducationDebbie Scanlon – Principal, Southview <strong>School</strong> – <strong>Special</strong> Education<strong>Guidance</strong> SupervisorLynnette Adams – Counselor, <strong>Special</strong> Education BuildingsMarsha Stephens – Counselor, <strong>Special</strong> Education BuildingsSara Schmitt – Social Worker, SouthviewLinda Cantrell – Transition FacilitatorAnne Blind – Teacher, SouthviewDebbie Younce – Lead Counselor, South TechJeff Ch<strong>and</strong>ler – Lead Counselor, North TechJama Kupferer – Language Arts Instructor, South TechKarista Kohler – Science Instructor, North TechTech <strong>Guidance</strong> Advisory Committee (attachment T-5)III. Evaluation Criteria for Programs/Services OfferedStaff perceptionAssessment statisticsStudent attitude <strong>and</strong> interest surveyPerception data (parents <strong>and</strong> students)Identified need areas
<strong>Guidance</strong> <strong>and</strong> <strong>Counseling</strong>St<strong>and</strong>ard Program EvaluationIV. Data Collection Methodology <strong>and</strong> DocumentsV. Results<strong>Special</strong> Education <strong>School</strong>s:Staff/administrator surveys: Missouri Comprehensive <strong>Guidance</strong> Survey2005-06 <strong>School</strong> YearParent/guardian survey: Missouri Comprehensive <strong>Guidance</strong> Survey2005-06Student survey: Missouri Comprehensive <strong>Guidance</strong> Survey 2005-06,6-month, 3-year, <strong>and</strong> 5-year Follow-up Study of GraduatesDocuments: MSIP <strong>and</strong> Comprehensive <strong>Guidance</strong> St<strong>and</strong>ardsTechnical Education <strong>School</strong>s:Staff/administrator surveys:Missouri Comprehensive <strong>Guidance</strong> Student NeedsSurvey 2004-05 <strong>School</strong> Year,High <strong>School</strong>s That Work Survey 2004 & 2006,Counselor Time <strong>and</strong> Task Analysis, 2004-05 <strong>School</strong> YearParent/Guardian Surveys:Missouri Comprehensive <strong>Guidance</strong> Student NeedsSurvey 2004-05 <strong>School</strong> YearStudent Surveys:Missouri Comprehensive <strong>Guidance</strong> Student Needs Survey2004-2005 <strong>School</strong> YearHigh <strong>School</strong>s That Work Survey 2004 & 2006,Placement 6-month Follow-up, 5-year Follow-upDocuments:MSIP <strong>and</strong> Comprehensive <strong>Guidance</strong> St<strong>and</strong>ards• The Missouri Comprehensive <strong>Guidance</strong> model identifies the fourprogram components of a guidance program in school as the following: 1)<strong>Guidance</strong> Curriculum, 2) Individual Planning, 3) Responsive Services, <strong>and</strong>4) System Support.
<strong>Guidance</strong> <strong>and</strong> <strong>Counseling</strong>St<strong>and</strong>ard Program Evaluation• The <strong>Special</strong> Education <strong>School</strong>s of Neuwoehner, Ackerman,Northview, Litzinger, Southview <strong>and</strong> the Bridges program; are covered bytwo counselors who teach the Missouri Comprehensive <strong>Guidance</strong>Curriculum to all students. Currently the Court Programs do not receiveinstruction utilizing the above curriculum. In the 2002-03 school year, asecond counselor was added to the staff for <strong>Special</strong> Ed schools <strong>and</strong> asupervisor assigned to <strong>Special</strong> Ed guidance. The first Comprehensive<strong>Guidance</strong> Student Needs Survey was administered in 02-03 <strong>and</strong> thenagain in 05-06. Individual Planning in these buildings is done as part ofeach student’s IEP by the case manager with input from a transitionfacilitator <strong>and</strong> others as needed. Responsive Service is covered similarly ineach of these schools by the Social Workers with additional input from thestaff in the form of a care team meeting. Counselors, individual student’sCase Managers, Transition Facilitators, <strong>and</strong> Social Workers contribute toSystem Support in the <strong>Special</strong> Education schools. System Supportincludes the following components: parent involvement, committeeparticipation, professional development <strong>and</strong> community involvement. Asof December 2006, the <strong>Special</strong> Education schools serve an enrollment of883 students <strong>and</strong> with the Courts Programs <strong>and</strong> Career Training, thenumber increases to 1156 students. The desirable MSIP st<strong>and</strong>ard ofcounselors serving the <strong>Special</strong> <strong>School</strong>’s enrollment, based on theindividual enrollments would be 2.6 counselors <strong>and</strong> with the additionalprograms 1.2 additional counselors are recommended. It is important tonote that this st<strong>and</strong>ard also considers guidance staff taking fullresponsibility for all four Comprehensive <strong>Guidance</strong> Program Components.The recommended time full time counselors should spend on <strong>Guidance</strong>Curriculum ranges from 15-45% at different grade levels. Our twocounselors, exclusively assigned to the instruction of the <strong>Guidance</strong>Curriculum, fill this need at the Desirable St<strong>and</strong>ard level (see attachmentS-3).• The Technical High <strong>School</strong>s cover guidance areas as a moretraditional comprehensive high school with four counselors per building<strong>and</strong> additional assistance in Responsive Services coming from socialworkers (see attachment T-4 p.2)A. Strengths <strong>and</strong> Concerns of program/service based on MSIPst<strong>and</strong>ards <strong>and</strong>/or statistical comparisons.1. Program Strengths (MSIP st<strong>and</strong>ards met or exceeded)Toward the question on guidance meeting student needs as anintegral part of the instructional program based on documents,data totals <strong>and</strong> comparisons from instruments listed in section IV onpage 3:
<strong>Guidance</strong> <strong>and</strong> <strong>Counseling</strong>St<strong>and</strong>ard Program Evaluation<strong>Special</strong> Ed• The Student Needs Survey administered to students, staff, <strong>and</strong> parentsin 2005-06 in the <strong>Special</strong> Education schools identified specific needsparticularly in the area of transition that include decision making skills,knowledge of self <strong>and</strong> others, future planning, <strong>and</strong> self advocacy. (seeattachment S-2).• Students are being instructed in the guidance areas listed above as wellas job training to prepare for adult living. Employment for our studentsinclude placement at a sheltered workshop as well as supportedemployment when appropriate. (see attachment S-1).Tech Ed• Reports from the College <strong>and</strong> Career Counselors at each of the Tech<strong>School</strong>s from the 6-month follow-up survey done each year indicate anaverage of 89.6% placement of the 2662 surveyed completers oftechnical programs for the last 4 years. An average of 55.8% wereplaced in either employment, continuing education, or military billets(job or assignment) related to their vocational program (seeattachment T-1, p. 1). A 5-year follow-up of the graduating class of2000 from North <strong>and</strong> South Tech produced only 24 responses with 57surveys returned as undeliverable from 293 total graduates. On apositive note, 87.5% (21 of 24) were employed, 58.3% (14 of 24) wereemployed related to their tech program, <strong>and</strong> 16.7% (4 of 24) wereenrolled in <strong>and</strong> unrelated post-secondary program. No responderswere unemployed <strong>and</strong> none were currently in tech program relatedpost-secondary programs. Obviously, several were both employed <strong>and</strong>receiving some post-secondary education or training (T-1, p.2)• The SSD Board Approved Tech <strong>Guidance</strong> Curriculum addresses thestudent needs identified most recently conducted Student NeedsSurvey (2004-05, see attachment T-2, pp. 1-6).• The High <strong>School</strong>s That Work survey results of 2004 <strong>and</strong> 2006 indicatethat students reporting having never talked to a counselor about aFour-year Plan dropped from 16% to 6% at North Tech <strong>and</strong> from 20%to 16% at South Tech (T-3, pp. 1-3).• Time <strong>and</strong> task analysis indicate that service provided compared withthe state recommendations for guidance are met. Enrollment ratios<strong>and</strong> percentage of time spend on types of service enrollment is wellover the state recommendation for guidance at North <strong>and</strong> South Tech(T-4, pp.1-2).Toward the question of staff encouragement of students to plan for futureclasses <strong>and</strong> post-secondary options based on documents, data totals,comparisons listed in section IV on page 3:
<strong>Guidance</strong> <strong>and</strong> <strong>Counseling</strong>St<strong>and</strong>ard Program Evaluation<strong>Special</strong> Ed• All students age 16 <strong>and</strong> over participate in the Futures Plan programunder the supervision of two Transition Facilitators with participationof teachers <strong>and</strong> case managers that includes educational, career, <strong>and</strong>life planning as an ongoing process through time of exit with diploma.Beginning at the 8 th grade level, all students have a 4-year pl<strong>and</strong>esigned to prepare the student for adult life.• <strong>Guidance</strong> counselors administer interest inventories to beginidentifying areas of employment that a student may enjoy <strong>and</strong>experience success.Tech Ed• High <strong>School</strong>s That Work (HSTW) surveys from 2006 indicate that atleast 94% of students at North Tech <strong>and</strong> 84% at South Tech report thatthey have spoken with a counselor about courses <strong>and</strong> sequence, <strong>and</strong>Four-year Plans (see attachment T-3, p. 1; summary of HSTW surveyquestions for North <strong>and</strong> South Tech).• 82% of students reporting having reviewed sequence of courses 1 ormore times per semester at North Tech (T-3, p. 1).• North Tech students report increasing encouragement to takechallenging math, science, <strong>and</strong> English courses. South Tech studentsreport increasing encouragement to take challenging math <strong>and</strong> scienceclasses, while 0ver 80% surveyed teachers at both schools reportencouraging students to take math as a senior even though two units ofmath is the school <strong>and</strong> state requirement (attachment T-3, pp. 1-2).2. Program ConcernsToward the question on guidance meeting student needs as an integralpart of the instructional program based on documents, data totals<strong>and</strong> comparisons <strong>and</strong> listed in section IV on page 3:<strong>Special</strong> Ed• Utilization of the results from Comprehensive <strong>Guidance</strong> Student NeedsSurvey of 05-06, guides the curriculum taught by each of the twocounselors for the <strong>Special</strong> Ed schools, one assigned to Bridges,Ackermann, Litzsinger, Northview <strong>and</strong> the other assigned toSouthview, Neuwoehner <strong>and</strong> Litszinger. The desired result is acrossthe board identification of need areas <strong>and</strong> implementing moreintensive instruction of the guidance curriculum to meet these needs.The second Student Needs Survey was completed during the 2005-06school year. Results were reviewed <strong>and</strong> analyzed with curriculumdeveloped to address identified needs. Due to the number of studentsthat the 2 guidance counselors must teach at the <strong>Special</strong> <strong>School</strong>
<strong>Guidance</strong> <strong>and</strong> <strong>Counseling</strong>St<strong>and</strong>ard Program Evaluationbuildings, instruction in the guidance curriculum has not been given tothe following SSD buildings: Career Training, JDC, Lakeside, or ProjectLearn.• An advisory Committee for <strong>Special</strong> Ed school guidance must be formedthat includes parents.• Unable to locate students so return rate for 5-year follow up studies arelow—63 total graduates, 35% (n=22).Tech Ed (attachments T-2 <strong>and</strong> T-3)• The 2004-2005 Student Needs Survey composite from both North <strong>and</strong>South Tech indicate that making decisions about college <strong>and</strong> planning<strong>and</strong> developing careers are the top two priorities for Tech students <strong>and</strong>their parents. In the results form the High <strong>School</strong>s That Work Surveydone the spring of 2006, 98% of students at North Tech <strong>and</strong> 61% atSouth Tech indicate talking with a counselor about education <strong>and</strong>career. That number increased at North Tech but decreased at SouthTech over the last two years, indicating a need for adjustments incareer guidance at South Tech (see attachment T-3, p.2).• Agreement at North Tech, either strongly or somewhat, that they werecomfortable about transition from high school to either a career orfurther education; rose from 74% to 78% between 2004 <strong>and</strong> 2006according to the HSTW surveys administered. At South Tech on thissame question, those at least somewhat comfortable about theupcoming transition rose from 58% to 65% (T-3, p. 3).• Student Needs Surveys show different perceptions of need at the twohigh schools. At North Tech, ‘making decisions about college’ <strong>and</strong>‘planning <strong>and</strong> developing careers’ rank 1 st <strong>and</strong> 2 nd separatedsignificantly from each other <strong>and</strong> other choices down the list. At SouthTech ‘planning <strong>and</strong> developing careers’, ‘finding jobs’, <strong>and</strong> ‘makingdecisions about college’ ranked 1 through 3, were fairly close in rank,<strong>and</strong> significantly separated from other choices (See attachment T-2,top of p. 1 for scoring <strong>and</strong> explanation; p. 3 <strong>and</strong> 5 for statisticalcomparison).• On the High <strong>School</strong>s That Work survey (attachment T-3, p. 1) in thecategory of who helped most with their Four-year plan, 22% at SouthTech report ‘no one’, 20% report ‘never’ reviewing sequence of courseswith anyone.• The number of return on the 5-year Follow-up Survey isdisappointingly low.
<strong>Guidance</strong> <strong>and</strong> <strong>Counseling</strong>St<strong>and</strong>ard Program Evaluation<strong>Special</strong> <strong>and</strong> Tech Ed• Data obtained from SSD <strong>and</strong> Missouri Comprehensive <strong>Guidance</strong>Student Needs Surveys should carefully be reviewed along with anyother pertinent data to analyze coverage <strong>and</strong> effectiveness of guidancecurriculum instruction in special education buildings.Toward the question on staff encouragement of student planning forfuture classes <strong>and</strong> post-secondary options based on documents, datatotals <strong>and</strong> comparisons listed in section IV on page 3:<strong>Special</strong> Ed• Students in the 9-12 grade range indicated lack of knowledge in theareas of finding jobs, consumer skills, planning for careers, preparingfor jobs, <strong>and</strong> preparing for life after graduation at a range of 32 to 42%on the 2005-2006 Student Needs Survey (attachment S-2).Tech Ed• Students reporting having never talked to a counselor about a FouryearPlan dropped from 16% to 4% at North Tech <strong>and</strong> from 20% to 16%at South Tech. However, in the category of who helped most with theirFour-year plan, 22% at South Tech report ‘no one’, 20% report ‘never’reviewing sequence of courses with anyone (attachment T-2)• The percentage of students who report never or seldom receivingencouragement from counselors to take challenging math <strong>and</strong> sciencedecreased at both schools <strong>and</strong> the percentage never or seldomencouraged to take challenging English decreased at North Tech.(attachment T-2).• Students reporting having never talked to a counselor about a FouryearPlan dropped from 16% to 4% at North Tech <strong>and</strong> from 20% to 16%at South Tech. However, in the category of who helped most with theirFour-year plan, 22% at South Tech report ‘no one’, 20% report ‘never’reviewing sequence of courses with anyone (also reported in programstrengths).• Only 50% of students at South Tech report reviewing course sequenceat least 1 time per year (T-3, p. 1).
<strong>Guidance</strong> <strong>and</strong> <strong>Counseling</strong>St<strong>and</strong>ard Program Evaluation3. Recommendations regarding program/service<strong>Special</strong> <strong>and</strong> Tech Ed• Continue to monitor, review <strong>and</strong> revise program throughComprehensive <strong>Guidance</strong> Student Need <strong>and</strong> SSD surveys, payingparticular attention to concerns mentioned in this document.• Insure that all students in all buildings <strong>and</strong> programs develop FouryearPlans for secondary academic <strong>and</strong> career planning <strong>and</strong> thatplacement assistance is provided for transition through use of HSTWsurveys <strong>and</strong> Time <strong>and</strong> Task analysis at the Tech <strong>School</strong>s <strong>and</strong> StudentNeeds Surveys at all SSD buildings, again starting with concernsmentioned in this document.<strong>Special</strong> Ed• The <strong>Special</strong> Education building staffs support parents in their efforts tolocate <strong>and</strong> provide information in the areas of work, life skills, <strong>and</strong>living arrangements for the student’s adult life.• Transition Committee investigating the ability to attain informationfrom parent/student to update current employment/living statusthrough DVR, PLB, <strong>and</strong>/or Regional Center for up to 5-years aftergraduation .Tech Ed• The High <strong>School</strong>s That Work committee model for counselors tofacilitate faculty advisors to help students seems to work well witheducational planning at North Tech but has been less successful atSouth, where another model is being developed. All students at bothschools do, in fact, review their 4-year or Educational Career Plan evenif only with their counselor.• The Missouri Comprehensive <strong>Guidance</strong> Program includesrecommendations for incorporating Grade Level Expectations into theguidance curriculum at each school. During the 2006-07 school year,the South Tech guidance staff will review, rewrite, or develop a newlesson or activity to be included in Technical Education <strong>Guidance</strong>Curriculum that places additional emphasis on application of theEducational Career Plan (4-year plan) for each student.____________________________________Date:_________Signature of Administrator Responsible for Chairing Evaluation
<strong>Guidance</strong> <strong>and</strong> <strong>Counseling</strong>St<strong>and</strong>ard Program Evaluation<strong>Special</strong> Ed <strong>School</strong>DocumentsS-1 through S-3
<strong>Guidance</strong> <strong>and</strong> <strong>Counseling</strong>St<strong>and</strong>ard Program EvaluationFOLLOW-UP OF GRADUATES/SURVEY OF EMPLOYERSSPECIAL EDUCATION SCHOOLS AND CAREER TRAINING PROGRAMPURPOSE OF THE STUDYMARCH, 2006The district conducts follow-up studies of graduates <strong>and</strong> surveys employers fortwo reasons: First, st<strong>and</strong>ard 8.1.2 of the Missouri <strong>School</strong> Improvement Program (MSIP)requires school districts to conduct thorough follow-up studies of its graduates <strong>and</strong>surveys of employers <strong>and</strong> colleges. The purpose of these activities is to determine howwell the district has prepared students for work or post-secondary education. The secondreason is to obtain information about the long-term performance of our graduates so thatwe can make adjustments in our instructional programs <strong>and</strong> better prepare our studentsfor life after school. In simple terms, the study asks two questions. The first is “What areour graduates doing?”. The second question is “How well is the district preparing themto do it?”. The first question was answered through a follow-up of graduates. Theanswer to the second came from a survey of employers.METHODOLOGYThe district obtained information to complete the follow-up study <strong>and</strong> employersurvey through the following means:Follow-up of graduates1. Transition Facilitators tried to contact members of the classes of 2000, 2003, <strong>and</strong>2005 from the secondary <strong>Special</strong> Education <strong>School</strong>s (Neuwoehner, Northview,Southview). Facilitators attempted three phone contacts on varying days <strong>and</strong>times.2. If Facilitators were unable to contact the graduate, they sent a survey to thegraduate’s last known address or residential facility.3. Facilitators discussed post-school outcome status with the graduates’ teacherswhen enrolled in SSD.4. Teachers in the Career Training Program contacted graduates, family members, orteachers of students who had graduated from that program. Due to historicallylow response to mailings, teachers relied on repeated phone calls to obtaininformation.S-1, p. 1
<strong>Guidance</strong> <strong>and</strong> <strong>Counseling</strong>St<strong>and</strong>ard Program EvaluationFINDINGSGraduates of <strong>Special</strong> Education <strong>School</strong>sIt should be noted that district staff collect post-graduation data for studentsgraduating from each school, <strong>and</strong> report it to in that manner to school staff. However, inreporting information describing the post-graduation activity <strong>and</strong> outcomes of ourstudents in public, maintaining confidentiality is crucial. The relatively small number ofgraduates from each school in each “cell” (that is, “Male”, “Female”, each ethnic group,or each follow-up category) puts the confidentiality of each student at risk. Therefore,this report provides only data for the entire group of graduates.Class of 2000The class of 2000 consisted of 63 students graduating from Neuwoehner,Northview, <strong>and</strong> Southview <strong>School</strong>s. Of those students, 54% were male <strong>and</strong> 46% female.White students made of 67% of the graduates, Black students made up 30%, <strong>and</strong> 3%were of another ethnic group. The status of graduates is shown below._____________________________________________________________Class of 2000Five Year Follow-Up StatusPercentageMale Female Total Black White Other Total Of TotalEmployed 7 6 13 1 11 1 13 20.6Percent 53.8 46.2 100.0 7.7 84.6 7.7 100.0Day Program 10 10 20 3 16 1 20 31.7Percent 50.0 50.0 100.0 15.0 80.0 5.0 100.0Unemployed/NoProgram 4 3 7 4 3 0 7 11.1Percent 57.1 42.9 100.0 57.1 42.9 0.0 100.0Unable to Locate 12 10 22 11 11 0 22 34.9Percent 54.5 45.5 100.0 50.0 50.0 0.0 100.0Deceased 1 0 1 1 0 0 1 1.6Percent 100.0 0.0 100.0 100.0 0.0 0.0 100.0Total 34 29 63 20 41 2 63 100.0Total Percent 54.0 46.0 100.0 31.7 65.1 3.2 100.0The number of students who are deceased or with whom staff were unable tomake contact affects the above distribution. The table below shows the status of studentsabout whom the district was able to obtain information. These data indicate that ofstudents about whom the district was able to obtain information, nearly 83% areemployed or in a day program.S-1, p. 2
<strong>Guidance</strong> <strong>and</strong> <strong>Counseling</strong>St<strong>and</strong>ard Program EvaluationClass of 2000Status of Students ContactedMale Female Black White Other Total PercentageEmployed 7 6 1 11 1 13 32.5Day Program 10 10 3 16 1 20 50.0Unemployed/No Program 4 3 4 3 0 7 17.5Total 21 19 8 30 2 40 100.0Percent 52.5 47.5 20.0 75.0 5.0 100.0________________________________________________________________In an attempt to identify trends in post-graduation activity, this study comparedyear-to-year activities of students in the class of 2000. The table on the next page showsthose data in detail. It is noteworthy that over five years, the percentage of studentsemployed dropped substantially, while the percentage in various day programs remainedabout the same.S-1, p. 3
<strong>Guidance</strong> <strong>and</strong> <strong>Counseling</strong>St<strong>and</strong>ard Program EvaluationClass of 2000Year-To-Year Post-Graduate Status2000 2000 2001 2001 2003 2003 2005 2005Status Number Percent Number Percent Number Percent Number PercentEmployed/ShelteredWorkshop 11 17.5 7 11.1 5 7.9 6 9.5Employed/SupportedEmployment 23 36.5 15 23.8 9 14.3 6 9.5Employed/CompetitiveEmployment 3 4.8 0 0.0 0 0.0 1 1.6Total Employed 37 58.7 22 34.9 14 22.2 13 20.6Day Program/VolunteerActivity 2 3.2 2 3.2 2 3.2 2 3.2Day Program/Other 16 25.4 20 31.7 21 33.3 18 28.6Total Day Program 18 28.6 22 34.9 23 36.5 20 31.7Unemployed/NoProgram 7 11.1 15 23.8 10 15.9 6 9.5Unemployed/Home byChoice 0 0.0 0 0.0 0 0.0 1 1.6Total Unemployed 7 11.1 15 23.9 10 15.9 7 11.2Unable to Locate 1 1.6 4 6.3 16 25.4 22 34.9Deceased 0 0.0 0 0.0 0 0.0 1 1.6Category Total 63 100.0 63 100.0 63 100.0 63 100.0S-1, p. 4
<strong>Guidance</strong> <strong>and</strong> <strong>Counseling</strong>St<strong>and</strong>ard Program EvaluationClass of 2003The class of 2003 consisted of 63 students from Neuwoehner, Northview, <strong>and</strong> Southview<strong>School</strong>s. The follow-up data for those students follow.________________________________________________________________Class of 2003Two Year Follow-Up StatusPercentageMale Female Total Black White Other Total of TotalEmployed 13 3 16 6 10 0 16 25.4Percent 81.3 18.8 100.0 37.5 62.5 0.0 100.0Day Program 7 5 12 4 7 1 12 19.0Percent 58.3 41.7 100.0 33.3 58.3 8.3 100.0Unemployed/No Program 12 1 13 8 5 0 13 20.6Percent 92.3 7.7 100.0 61.5 38.5 0.0 100.0Unable to Locate 17 3 20 8 12 0 20 31.7Percent 85.0 15.0 100.0 40.0 60.0 0.0 100.0Deceased 1 1 2 0 2 0 2 3.2Percent 50.0 50.0 100.0 0.0 100.0 0.0 100.0Total 100.0Total Percent 79.4 20.6 100.0 41.3 57.1 1.6 100.0________________________________________________________________The above data show that of the total number of graduates, approximately 44 percent areemployed or in a day program <strong>and</strong> about one-fifth are unemployed or in no program. As withthe class of 2005, however, these data are substantially affected by the number of students notlocated. The table on the next page shows outcome data for students from whom staff obtainedinformation. This table shows that of students in that group, about 68% were employed or in aday program.S-1, p. 5
<strong>Guidance</strong> <strong>and</strong> <strong>Counseling</strong>St<strong>and</strong>ard Program EvaluationClass of 2003Status of Students ContactedMale Female Black White Other Total PercentageEmployed 13 3 6 10 0 16 39.0Day Program 7 5 4 7 1 12 29.3Unemployed/No Program 12 1 8 5 0 13 31.7Total 32 9 18 22 1 41 100.0Percent 78.0 22.0 43.9 53.7 2.4 100.0________________________________________________________________In an attempt to identify trends in post-graduation activity, this study compared year-toyearactivities of students in the class of 2003. The table on the next page shows those data indetail.________________________________________________________________Class of 2003Year-To-Year Post-Graduate StatusAnticipated2003 2004 2004 2005 2005Status Number Percent Number Percent Number PercentEmployed/Sheltered Workshop 6 9.4 12 18.8 9 14.3Employed/Supported Employment 27 42.2 8 12.5 4 6.3Employed/Competitive Employment 3 4.7 1 1.6 3 4.8Total Employed 36 56.3 21 32.8 16 25.4Day Program/Volunteer Activity 0 0.0 2 3.1 11 17.5Day Program/Other 17 26.6 11 17.2 1 1.6Total Day Program 17 26.6 13 20.3 12 19.0Unemployed/No Program 10 15.6 19 29.7 12 19.0Unemployed/Home by Choice 1 1.6 3 4.7 1 1.6Total Unemployed 11 17.2 22 34.4 13 20.6Unable to Locate 0 0.0 8 12.5 20 31.7Deceased 0 0.0 0 0.0 2 3.2Category Total 64 100.0 64 100.0 63 100NOTE: One student received a diploma from home school <strong>and</strong> was not counted in SSD follow-up.S-1, p. 6
<strong>Guidance</strong> <strong>and</strong> <strong>Counseling</strong>St<strong>and</strong>ard Program EvaluationAs with the Class of 2000, these data show that over time the percentage of employed studentsdecreased. However, unlike the Class of 2000, the percentage in day programs also decreased.Class of 2005The final group reported is students graduating in 2005 from Northview, Neuwoehner,<strong>and</strong> Southview <strong>School</strong>s. <strong>District</strong> staff collected data in December 2005, six months postgraduation.The table below shows that about 46 percent of graduates are employed or in a dayprogram, while about 36 percent are unemployed. Staff were unable to reach almost nineteenpercent of the graduates.________________________________________________________________Class of 2005Six-Month Follow-Up Status________________________________________________________________PercentageMale Female Total Black White Other Total of TotalEmployed 6 8 14 5 8 1 14 20.0Percent 42.9 57.1 100.0 35.7 57.1 7.1 100.0Day Program 9 9 18 10 8 0 18 25.7Percent 50.0 50.0 100.0 55.6 44.4 0.0 100.0Unemployed/No Program 16 9 25 10 15 0 25 35.7Percent 64.0 36.0 100.0 40.0 60.0 0.0 100.0Unable to Locate 7 6 13 9 4 0 13 18.6Percent 53.8 46.2 100.0 69.2 30.8 0.0 100.0Deceased 0 0 0 0 0 0 0 0.0Percent 0 0 0 0 0 0 0Total 38 32 70 34 35 1 70 100.0Percent 54.3 45.7 100.0 48.6 50.0 1.4 100.0________________________________________________________________The table on the next page shows the distribution of graduates in those about whom staffcould obtain no information are omitted from the group. Those data indicate that of this group,about 56% are employed or in a day program.S-1, p. 7
<strong>Guidance</strong> <strong>and</strong> <strong>Counseling</strong>St<strong>and</strong>ard Program EvaluationClass of 2005Status of Students ContactedMale Female Black White Other Total PercentageEmployed 6 8 5 8 1 14 24.6Day Program 9 9 10 8 0 18 31.6Unemployed/No Program 16 9 10 15 0 25 43.9Total 31 26 25 31 1 57 100.0Percent 54.4 45.6 43.9 54.4 1.8 100.0________________________________________________________________DiscussionA review of the above follow-up data gives rise to the following important points:1. For all classes, the high percentage of students not located, ranging from over 18% forthe class of 2005 to over one-third for the class of 2000, has a substantial impact on theability to draw clear conclusions. Simply said, the district doesn’t know what thesestudents are currently doing.2. The percentage of students employed decreases over time. For the class of 2000, thispercentage decreased over five years from almost 59% to about 20%. For the class of2003, the percentage decreased over two years from about 56% to about 21%. For theclass of 2000, this decrease took place in all types of employment (sheltered workshop,supported employment, <strong>and</strong> competitive employment). For the class of 2003, thepercentage of students in sheltered workshop <strong>and</strong> supported employment decreased byalmost half (from 18.8% to 9.5% <strong>and</strong> from 12.5% to 6.3%, respectively) between oneyear <strong>and</strong> two years after graduation, while the percentage of students in competitiveemployment increased.3. Over five years, the percentage of students in day programs stayed about the same whilethe percentage of unemployed students increased in the short-term but returned to itsinitial level long-term. Over two years for the class of 2003, the percentage of students inday programs dropped while the percentage unemployed grew.4. Six months after graduation, almost half of graduates were employed or in a dayprogram. However, over one-third were unemployed.5. A review of post-graduation status by gender <strong>and</strong> ethnic groups shows that for membersof the Class of 2000, the percentages of males <strong>and</strong> females in eachS-1, p. 8
<strong>Guidance</strong> <strong>and</strong> <strong>Counseling</strong>St<strong>and</strong>ard Program Evaluationcategory are consistent with their overall representation in the group. However, thepercentage of Black students employed or in day programs is less than the overallpercentage of Black students <strong>and</strong> the percentage unemployed or not located is more thanthe total percentage. The opposite is the case for White students. For the class of 2003,the percentage of Male <strong>and</strong> Female students employed is similar to their membership inthe entire group. However, the percentage of Males in a day program is less than theiroverall percentage while the percentage unemployed or not located is greater than theiroverall representation. The percentage of Females in a day program is greater than theiroverall percentage of the total group but the opposite is the case for Females who areunemployed or not located. The percentages of Black students <strong>and</strong> White studentsemployed or not located are about the same as their overall percentage of groupmembership. The percentage of White students in a day program is about the same astheir overall representation, while this is not the case for any unemployed students orBlack students in a day program.Career Training GraduatesTeachers collected follow-up data for graduates in 2000, 2003, <strong>and</strong> 2005, that is, fiveyears, two years, <strong>and</strong> six months post-graduation. The following table summarizes datadescribing those groups of graduates <strong>and</strong> their post-graduation status.___________________________________________Career Training Program GraduatesGroup Descriptions <strong>and</strong> Post-Graduation StatusYear of Graduation 2000 2003 2005Number of Students 98 92 73Percent Contacted 37 68 92GenderPercent Male 59 56 59Percent Female 41 44 41Ethnic GroupPercent Black 47 64 48Percent White 52 36 51Percent Other 1 0 1Percent Enrolled in Non-College 0 2 0Percent in Military 0 0 0Percent Employed 27 42 51Percent Unemployed 7 22 37Percent with Status Unknown 66 33 12_____________________________________________S-1, p. 9
<strong>Guidance</strong> <strong>and</strong> <strong>Counseling</strong>St<strong>and</strong>ard Program EvaluationGRADES K-3 STUDENT SURVEYSPRING 2006 GUIDANCE DEPARTMENTNEEDS ASSESSMENTRESULTS1) 4. I can identify different ways of settling conflicts.(Underst<strong>and</strong>ing <strong>and</strong> accepting myself)2) 16. I look at the person who is speaking to me.(Improving study <strong>and</strong> basic learning skills)3) 18. I know how to ask appropriate questions in class.(Improving study <strong>and</strong> basic learning skills)4) 40. I know how to say “NO” to people who try to get me to use alcohol<strong>and</strong> other drugs.(Knowing how alcohol <strong>and</strong> other drugs affect my friends <strong>and</strong>me)GRADES K-3 STAFF SURVEY1) Underst<strong>and</strong>ing <strong>and</strong> getting along with others2) Underst<strong>and</strong>ing <strong>and</strong> accepting myself3) Making decisionsGRADES K-3 PARENT SURVEY1. Improving study <strong>and</strong> basic learning skills2. Making decisions3. Underst<strong>and</strong>ing <strong>and</strong> getting along with othersS-2, p. 1
<strong>Guidance</strong> <strong>and</strong> <strong>Counseling</strong>St<strong>and</strong>ard Program EvaluationSPRING 2006 GUIDANCE DEPARTMENTNEEDS ASSESSMENTRESULTSGRADES 4-6 STUDENT SURVEY1) 8. I know how to h<strong>and</strong>le teasing from other students if I am interested in activitiesusually chosen by the other sex.(Underst<strong>and</strong>ing how being male or female relates to school <strong>and</strong>work)2) 20. I know an adult to get help from if I or a friend has a problem withalcohol <strong>and</strong> drugs.(Knowing how alcohol <strong>and</strong> other drugs affect my friends <strong>and</strong>me)3) 24. I know some things that cause problems in families, such as death,divorce, unemployment(Learning about family responsibilities)GRADES 4-6 STAFF SURVEY1. Underst<strong>and</strong>ing <strong>and</strong> getting along with others2. Underst<strong>and</strong>ing <strong>and</strong> accepting self3. Making decisionsGRADES 4-6 PARENT SURVEY1. Underst<strong>and</strong>ing <strong>and</strong> getting along with others2. Exploring <strong>and</strong> planning for careers3. Underst<strong>and</strong>ing <strong>and</strong> accepting self4. Improving study <strong>and</strong> learning skillsS-2, p. 2
<strong>Guidance</strong> <strong>and</strong> <strong>Counseling</strong>St<strong>and</strong>ard Program EvaluationSPRING 2006 GUIDANCE DEPARTMENTNEEDS ASSESSMENTRESULTSGRADES 6-9 STUDENT SURVEY1) 27. I attend <strong>and</strong> participate in my IEP meetings.(Planning for school <strong>and</strong> beyond)2) 4. I can h<strong>and</strong>le teasing <strong>and</strong> disapproval for wanting a job that isusually held by people of the opposite sex.(Underst<strong>and</strong>ing how being male or female relates toclasses <strong>and</strong> jobs)3) 30. I can complete a sample job application.(Preparation for finding jobs)GRADES 6-9 STAFF SURVEY1. Underst<strong>and</strong>ing <strong>and</strong> getting along with others2. Making decisions3. Learning how to use leisure timeGRADES 6-9 PARENT SURVEY1. Making decisions2. Underst<strong>and</strong>ing <strong>and</strong> accepting self3. Underst<strong>and</strong>ing <strong>and</strong> getting along with othersS-2, p. 3
<strong>Guidance</strong> <strong>and</strong> <strong>Counseling</strong>St<strong>and</strong>ard Program EvaluationSPRING 2006 GUIDANCE DEPARTMENTNEEDS ASSESSMENTRESULTSGRADES 9-12 STUDENT SURVEY1) 48. I underst<strong>and</strong> credit purchases <strong>and</strong> installment buying.(Learning about consumer skills)2) 32. I know which individuals or agencies helped graduates get intocollege, find a job, or obtain other training beyond high school.(Learning from friends <strong>and</strong> others who have graduated)3) 39. I can develop a resume (personal information for employers).(Preparation for finding jobs)GRADES 9-12 STAFF SURVEY1. Preparing for life after graduation2. Underst<strong>and</strong>ing <strong>and</strong> accepting self3. Preparing for finding jobsGRADES 9-12 PARENT SURVEY1. Preparing for life after graduation2. Improving basic study skills <strong>and</strong> learning skills3. Underst<strong>and</strong>ing <strong>and</strong> accepting selfS-2, p. 4
<strong>Guidance</strong> <strong>and</strong> <strong>Counseling</strong>St<strong>and</strong>ard Program Evaluation15% - 25 % <strong>Guidance</strong> Curriculum25% - 35% Individual Planning25% - 35% Responsive Services15% - 20% System Support0% Non-<strong>Guidance</strong>Missouri Comprehensive <strong>Guidance</strong>Recommended Time DistributionState Suggested PercentagesMSIP St<strong>and</strong>ards for <strong>Counseling</strong> StaffFull time enrollment for the 2006-07 school year in the <strong>Special</strong> Education school buildingsis 883.S-3
<strong>Guidance</strong> <strong>and</strong> <strong>Counseling</strong>St<strong>and</strong>ard Program EvaluationTech <strong>School</strong>DocumentsT-1 through T-5
<strong>Guidance</strong> <strong>and</strong> <strong>Counseling</strong>St<strong>and</strong>ard Program EvaluationPlacement Results2002 - 2005North Technical High <strong>School</strong>YEAR CONCENTRATOR/ ER ENR CER CENR NP NA SU MR MNR TOT TOTPGRADUATESP %2005 438 61 44 193 74 60 3 1 1 1 374 85 %14% 10% 44% 17% 14% 1% 0% 0% 0% 85%2004 370 49 37 164 73 35 3 0 8 1 332 90%13% 10% 44% 20% 9% 1% 0% 2% 0% 90%2003 307 74 19 139 53 10 3 6 2 1 288 94%24% 6% 45% 17% 3% 1% 2% 1% 0% 94%2002 252 52 20 115 33 28 0 0 4 0 224 89%21% 8% 46% 13% 11% 0% 0% 2% 0% 89%So uth Technical H igh <strong>School</strong>YEAR CONCENTRATOR/GRADUATESER ENR CER CENR NP NA SU MR MNR TOTP TOTP%2005 359 57 51 83 116 23 13 9 1 6 314 87 %16% 14% 23% 32% 6% 4% 3% 0% 2% 87%2004 367 67 77 84 98 20 9 4 1 7 334 91%18% 21% 23% 27% 5% 2% 1% 0% 2% 91%2003 296 59 42 97 66 10 3 6 7 6 277 94%20% 15% 33% 22% 3% 1% 2% 2% 2% 94%2002 273 71 65 62 39 19 4 8 3 2 242 89%26% 24% 23% 14% 7% 1% 3% 1% 1% 89%CONCENTRATOR/GRADUATE – Student enrolled in a vocat ional progra m, ear ns a minimum of 2.0 unitsof credit in vocational program <strong>and</strong> graduates from high school.EREmployment RelatedENREmployment Not RelatedCERContinuing Education RelatedCENR Continuing Education Not RelatedNPNot PlacedNANot Available (Jail, pregnant, dead, etc.)SUStatus Unknown (Unable to obtain information)MRMilitary RelatedMNR Military Not RelatedTOT P Total Placed (Actively doing something)TOTP% Percent PlacedT-1, p. 1
<strong>Guidance</strong> <strong>and</strong> <strong>Counseling</strong>St<strong>and</strong>ard Program EvaluationClass of 2000 5-Year Graduate Follow-up Results• Surveys were sent to all North <strong>and</strong> South Tech graduates in the Class of 2000.• North Tech graduates in 2000 numbered 132 with 32 surveys returned asundeliverable <strong>and</strong> 7.0% of the delivered surveys returned. South Tech graduatesnumbered 161 with 25 returned as undeliverable <strong>and</strong> 12.5% of the deliveredsurveys returned.Highest level of education completed.Statistical Results• 62.5% High <strong>School</strong> Graduate• 8.3% Post-Secondary Certification• 25.0% Associates Degree• 0% Bachelors Degree• 4.2% Masters DegreeCurrent employment <strong>and</strong>/or educational status• 58.2% Employed, related to Tech High <strong>School</strong> program• 29.2% Employed, not related to Tech program• 0% Enrolled in post-secondary education related to Tech program• 16.6% Enrolled in post-secondary education not related to program• 0% Unemployed, seeking employment• 0% Unemployed, not seeking employmentT-1, p. 2
<strong>Guidance</strong> <strong>and</strong> <strong>Counseling</strong>St<strong>and</strong>ard Program EvaluationStudent Needs Survey 2004-05 Results SummaryPoint value is assigned to each item as ranked by each individual completing the survey withtotal scores being a calculation of that these rankings. Number of surveys completed in eachsection is a factor in totals.Tech Division Composite Rankings <strong>and</strong> Total ScoresGrade 10 (N=99) Cur. Page # Total score1. Making decisions about college (1,5,12-29,57) 2082. Planning <strong>and</strong> develop ing careers3. Finding jobs(1-6,9)(6,7,51-54,62-69,72)1891214. Making decisions (75-77) 1175. Preparation for finding jobs (7,21-23,51-54,62-68,71,72) 1096. Underst<strong>and</strong>ing <strong>and</strong> getting along with others (8-11,38,39) 86Grade 11 (N=136)1. Making decisions about college 2822. Planning <strong>and</strong> developing careers 2603. Finding jobs 2314. Preparation for finding jobs 1655. Learning about marriage <strong>and</strong> family responsibilities (35,36) 1086. Making decisions 101Grade 12 (N=87)1. Making decisions about college2. Finding jobs1751543. Planning <strong>and</strong> developing careers 1524. Making decisions 995. Learning consumer <strong>and</strong> homeowner skills(None, new Personal Finance Class) 976. Preparation for finding jobs 88Combined Grades (N=322)1. Making decisions about college 6652. Planning <strong>and</strong> developing careers 6013. Finding jobs 5064. Preparation for finding jobs 3625. Making decisions 3176. Improving basic skills <strong>and</strong> study/learning skills (46-52,55,56) 245T-2, p. 1
<strong>Guidance</strong> <strong>and</strong> <strong>Counseling</strong>St<strong>and</strong>ard Program EvaluationParents (N=167)Total score1. Planning <strong>and</strong> developing careers 3372. Improving basic skills <strong>and</strong> study/learning skills 3023. Making decisions about college 2494. Underst<strong>and</strong>ing <strong>and</strong> accepting self (27-31) 2335. Preparation for finding jobs 1846. Finding jobs (54-62) 162Staff (N=131)1. Improving basic skills including study/learning skills 4172. Underst<strong>and</strong>ing <strong>and</strong> getting along with others 2823. Making decisions 2454. Underst<strong>and</strong>ing <strong>and</strong> accepting self 1955. Planning <strong>and</strong> developing careers 1906. Vocational selection <strong>and</strong> training 126Combined Adults (N=307 including 9 not identified as Staff or Parent)1. Improving basic skills <strong>and</strong> study/learning skills2. Planning <strong>and</strong> developing careers7625293. Underst<strong>and</strong>ing <strong>and</strong> accepting self 4444. Underst<strong>and</strong>ing <strong>and</strong> getting along with others (8-11,38,39)4365. Making decisions 4176. Preparation for finding jobs 313Page numbers in parentheses indicate the page number of the taskin the <strong>Guidance</strong> Curriculum for Technical Education that addressesthat need. Items with no parenthetic notations have been previouslylisted.T-2, p. 2
<strong>Guidance</strong> <strong>and</strong> <strong>Counseling</strong>St<strong>and</strong>ard Program EvaluationNorth Tech Rankings <strong>and</strong> Total ScoresGrade 10 (N=80)Total score1. Making decisions about college 1862. Planning <strong>and</strong> develop ing careers3. Making decisions145934. Finding jobs 865. Preparation for finding jobs 756. Underst<strong>and</strong>ing <strong>and</strong> getting along with others 70Grade 11 (N=63)1. Making decisions about college 1392. Planning <strong>and</strong> developing careers3. Finding jobs104764. Preparation for finding jobs 555. Improving basic skills <strong>and</strong> study/learning skills 466. Learning about marriage <strong>and</strong> family responsibilities 41Grade 12 (N=29)1. Making decisions about college 452. Learning consumer a nd homeowner skills 353. Finding jobs 344. Planning <strong>and</strong> developing careers 315. Improving basic skills <strong>and</strong> study/learning sk ills256t.Underst<strong>and</strong>ing <strong>and</strong> accepting self 186t.Preparation for finding jobs 18Combined Grades (N=172)1. Making decisions about college 3702. Planning <strong>and</strong> developing careers 2803. Finding jobs 1964. Preparation for finding jobs 1485. Improving basic skills <strong>and</strong> study/learning skills 1356. Making decisions 126T-2, p. 3
<strong>Guidance</strong> <strong>and</strong> <strong>Counseling</strong>St<strong>and</strong>ard Program EvaluationParents (N=95)Total score1. Improving basic skills <strong>and</strong> study/learning skills 1802. Planning <strong>and</strong> developing careers 1653. Making decisions about college 1474. Underst<strong>and</strong>ing <strong>and</strong> accepting self 1235. Knowing how drugs <strong>and</strong> alcohol affect me <strong>and</strong> my friends 1076. Finding jobs 100Staff (N=73)1. Improving basic skills <strong>and</strong> study/learning skills 2002. Underst<strong>and</strong>ing <strong>and</strong> getting along with others 1673. Underst<strong>and</strong>ing <strong>and</strong> accepting self 1484. Making decisions 1405. Planning <strong>and</strong> developing careers 906. Vocational selection <strong>and</strong> training 60Combined Adults (M=168)1. Improving basic skills <strong>and</strong> study/learning skills 3802. Underst<strong>and</strong>ing <strong>and</strong> accepting self 2713. Underst<strong>and</strong>ing <strong>and</strong> getting along with others 2574. Planning <strong>and</strong> developing careers 2555. Making decisions 2126. Making decisions about college 167T-2, p. 4
<strong>Guidance</strong> <strong>and</strong> <strong>Counseling</strong>St<strong>and</strong>ard Program EvaluationSouth Tech Rankings <strong>and</strong> Total ScoresGrade 10 (N=19)Total score1. Planning <strong>and</strong> developing careers 442. Finding jobs 353. Preparation for finding jobs 344. Underst<strong>and</strong>ing <strong>and</strong> accepting self 255. Making decisions 246. Underst<strong>and</strong>ing <strong>and</strong> getting along with others 16Grade 11 (N=73)1. Planning <strong>and</strong> developing careers 1562. Finding jobs 1553. Making decisions about college 1434. Preparation for finding jobs 1105. Making decisions 836. Learning about marriage <strong>and</strong> family responsibilities 67Grade 12 (N=58)1. Making decisions about college 1302. Planning <strong>and</strong> developing careers 1213. Finding jobs 1204. Making decisions 845. Preparation for finding jobs 706. Learning consumer <strong>and</strong> household skills 62Combined Grades (N=150)1. Planning <strong>and</strong> developing careers 3212. Finding jobs 3103. Making decisions about college 2954. Preparation for finding jobs 2145. Making decisions 1916. Learning consumer <strong>and</strong> homeowner skills 128T-2, p-5
Parents (N=72)<strong>Guidance</strong> <strong>and</strong> <strong>Counseling</strong>St<strong>and</strong>ard Program Evaluation1. Planning <strong>and</strong> developing careers 1722. Improving basic skills <strong>and</strong> study/learning skills 1223. Preparation for finding jobs 1174. Underst<strong>and</strong>ing <strong>and</strong> accepting self 1105. Making decisions about college 1026. Making decisions 81Staff (N=58)1. Improving basic skills <strong>and</strong> study/learning skills 2172. Underst<strong>and</strong>ing <strong>and</strong> getting along with others 1153. Making decisions 1054. Planning <strong>and</strong> developing careers 1005. Vocational selection <strong>and</strong> training 666. Preparation for finding jobs 59Combined Adults (N=139 including 9 not identified as Staff or Parent)1. Improving basic skills including study/learning skills3822. Planning <strong>and</strong> developing careers 2743. Making decisions 2054. Preparation for finding jobs 1905. Underst<strong>and</strong>ing <strong>and</strong> getting along with others 1796. Underst<strong>and</strong>ing <strong>and</strong> accepting self 175T-2, p. 6
<strong>Guidance</strong> <strong>and</strong> <strong>Counseling</strong>St<strong>and</strong>ard Program EvaluationNorth TechSouth TechStudent Survey Results2006 n=57 2004 n=542006 n=54 2004 n=59Who helpe d most with 4 year plan?Counselor 57% 38% 12% 25%Teacher 9% 11%20% 20%Parents 26% 31% 41% 27%Friends 4% 4% 4% 10%No one 4% 16% 22% 17%Talked about 4 yea r plan with counselorN ever 6% 7% 16% 20%1 or 2 times 15% 15%28% 20%1 per ye ar 11% 13% 24% 14%1 per sem. 31% 26% 20% 31%Several/sem.37% 39% 12% 15%Talked about 4 year plan with teachersN ever 11% 24%22% 17%1 or 2 times 31% 20%14% 24%1 per ye ar1 per sem.13%26%9%37%24%24%22%22%Several/sem. 19% 11% 16% 15%F requency of parent-teac her-student conference to plan high school prog ram of studyN ever 31% 39%22% 41%1 or 2 times 22% 20%26% 8%1 per ye ar1 per sem.26%11%20%15%30%12%15%14%Several/sem.9% 7% 10% 22%Reviewedsequence of co urses w/teacher <strong>and</strong> counselorN ever 4% 2% 20% 20%1 or 2 times15% 24% 29% 19%1 per ye ar 19% 17% 22% 14%1 per sem. 37% 30% 16% 14%Several/sem.26% 26% 12% 32%Was encouraged by coun selors or teachers to takechallenging mathNever11% 28% 30% 36%Seldom 17% 13%22% 25%Sometimes28% 35% 36% 20%Often 44% 24% 12% 19%
<strong>Guidance</strong> <strong>and</strong> <strong>Counseling</strong>St<strong>and</strong>ard Program EvaluationStudent Survey Results 2006 n=57 2004 n=54 2006 n=54 2004 n=59Was encouraged by counselors or teachers to takechallenging scienceNever19% 39% 30% 44%Seldom 26% 26%24% 14%SometimesOften22%33%20%15%30%16%29%14%North Tech South TechWas encouraged by counselors or teachers to takechallenging EnglishNever 19% 26% 31% 27%Seldom 11% 22% 22% 17%Sometimes26% 30% 33% 31%Often 44% 22% 14% 25%Teacher or Counselo r talked with me about education orcareer after high schoolYes 98% 87% 61% 75%No 2% 13% 39% 25%Satisfaction w/help at school selecting coursesN ot at all 2% 4% 15% 22%Somewhat 57% 61% 60% 41%Very 42% 33% 25% 37%Received informa tion <strong>and</strong> counseling aboutcontinuing educationYes 78% 71% 62% 53%No 22% 29% 38% 47%The following happen ed during high school:I spoke w/ so meone in a career I aspire toYes 70% 65% 68% 63%No 30% 35% 32% 37%I spoke w/ colle ge rep about going to collegeY es 92% 87% 62% 59%No 8% 13% 38% 41%I spoke w/ local business about working thereY es 54% 54% 52% 49%No 46% 46% 48% 51%
<strong>Guidance</strong> <strong>and</strong> <strong>Counseling</strong>St<strong>and</strong>ard Program EvaluationParents <strong>and</strong> I met at school about plans afterhigh schoolYes 50% 52% 41% 47%No 50% 48% 59% 53%Parents <strong>and</strong> I were assisted at school about collegeapplica tionYes 65% 63% 62% 56%No 35% 37% 38% 44%North TechSouth TechStudent Survey Results2006 n=57 2004 n=542006 n=54 2004 n=59<strong>School</strong> courses prepared me for career or furthereducationStrongly Disagree 9% 15% 12% 10%Somewhat Disagree 13% 11% 22% 32%Somewhat Agree 40% 50% 45% 36%Strongly Agree 38% 24% 20% 22%North Tech Sout h TechT eacher Survey Results2006 n=69 2006 n=47To what extent are teachers involved in guiding <strong>and</strong>supporting studentsPart of guidance/advisory 74% 55%Assist parent s/students inhigh school plan <strong>and</strong> beyond 53% 52%Meet <strong>and</strong> advise core group atleast once per year 72% 56%Inform parents on post highschool readiness at l eastonce a year 57% 60%Work with parents onachievement gap once a year 61% 57%To what extent are teachers helping studen ts maketransition from high school to further learningBelieve 81% of seniors are highlycompetent in technical area5% 9%Encourage students to takemath as a senior 86% 83%Annually meet with employers<strong>and</strong> post seconda ry staff onexpectations 64% 82%Encourage students to takescience as sen iors77% 74%
<strong>Guidance</strong> <strong>and</strong> <strong>Counseling</strong>St<strong>and</strong>ard Program Evaluation2004-05 <strong>School</strong> Year Time <strong>and</strong> Task Analysis for <strong>Guidance</strong>Departments at the Technical High <strong>School</strong>sThis data combines the total hours reported in each semester on the time <strong>and</strong> task analysisarriving at a percentage breakdown for the 2004-2005 school year.North TechSouth TechHours Percent Hours PercentCurriculum 69.75 7% Curriculum 78.5 9%Individual Planning 334.00 36% Individual Planning 329.75 38%Responsive Services241.75 26% Responsive Services 202.5 23%System Support 175.25 19% System Support 84.25 10%Non-<strong>Guidance</strong> 116.25 12% Non-<strong>Guidance</strong> 178.5 20%totals 932.00 100% 873.5 100%T-4, p. 1
<strong>Guidance</strong> <strong>and</strong> <strong>Counseling</strong>St<strong>and</strong>ard Program Evaluation15% - 25 % <strong>Guidance</strong> Curriculum25% - 35% Individual Planning25% - 35% Responsive Services15% - 20% System Support0% Non-<strong>Guidance</strong>Missouri Comprehensive <strong>Guidance</strong>Recommended Time DistributionState Suggested PercentagesMSIP St<strong>and</strong>ards for <strong>Counseling</strong> StaffFull time enrollment for the 2006-07 school year is 503 at North Tech <strong>and</strong> 206 at SouthTech. Total enrollment is 1173 at North <strong>and</strong> 935 at South. Referring again to Page 4 of theSt<strong>and</strong>ard Program Eval form, the Desirable St<strong>and</strong>ard is met even with someadministrative <strong>and</strong> supervision duties assigned to counselors falling into the Non-<strong>Guidance</strong>Activity area.T-4, p. 2
<strong>Guidance</strong> <strong>and</strong> <strong>Counseling</strong>St<strong>and</strong>ard Program EvaluationParticpating members of Tech <strong>School</strong> <strong>Guidance</strong> Advisory CommitteeMr. Russ Andrews, Counselor-South Tech High <strong>School</strong>Mr. Larry Baine, College <strong>and</strong> Career Counselor-North Tech High <strong>School</strong>Ms. Elizabeth Bagi, Parent of South Tech Auto Tech StudentMr. Keith Bagi, South Tech Auto Tech StudentMs. Patty Barnes, Assessment Director-Florissant Valley Community CollegeMr. Ferdin<strong>and</strong> Bautista, Parent of North Tech Health Services StudentMs. Michelle Bautista, North Tech Health Services StudentMr. Jeff Ch<strong>and</strong>ler, Lead Counselor-North Tech High <strong>School</strong>Ms. Tiffany Dunlap, North Tech Graduate-Sunnen CorporationMr. Phil Elliott, Counselor-South Tech High <strong>School</strong>Mr. Jim Evans, College <strong>and</strong> Career Counselor-South Tech High <strong>School</strong>Mr. Marshall Foss, Counselor-Oakville High <strong>School</strong>Ms. Killian Hanks, North Tech Computer Information Systems 2006 GraduateMr. Al Haushalter, Counselor-University City High <strong>School</strong>Mr. Mike Hawley, Admissions-Rankin TechMr. Don Hosutt, Administrator-Technical EducationDr. Jim Jaimeson, Tech Ed <strong>and</strong> Lindbergh High <strong>School</strong>Mr. Dwight Jones, North Tech Computer Information Services StudentMs. Kathy Jones, Parent of South Tech Lab Tech StudentMr. Lamont Jones, South Tech Lab Tech StudentMs. S<strong>and</strong>y Kearney, Counselor-Eureka High <strong>School</strong>Ms. Kathleen Mead, Counselor-Ritenour High <strong>School</strong>Ms. Sharon Piel, Parent of North Tech Computer Information Services StudentMr. John Riethmeier, Counselor-Lindbergh High <strong>School</strong>Ms. Leigh Roberts, Assessment Coordinator-South Tech High <strong>School</strong>Ms. Carol Robinson, Counselor-North Tech High <strong>School</strong>Ms. Kristen Scott, North Tech Early Childhood StudentMr. Brian Scott, Parent of North Tech Early Childhood StudentMs. Sally Taylor, Personnel-Friendship Village of West CountyMs. Joanna VanDer Tuin, Counselor-Mehlville High <strong>School</strong>Ms. Debbie Younce, Lead Counselor-South TechMs. Mary White-North Tech CounselorT-5