Mayora - Company update Feb 2012 - Sinarmas Sekuritas, PT.
Mayora - Company update Feb 2012 - Sinarmas Sekuritas, PT.
Mayora - Company update Feb 2012 - Sinarmas Sekuritas, PT.

Create successful ePaper yourself
Turn your PDF publications into a flip-book with our unique Google optimized e-Paper software.
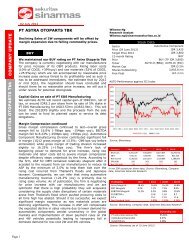
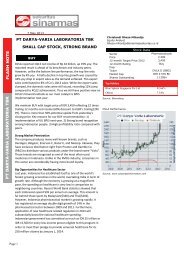
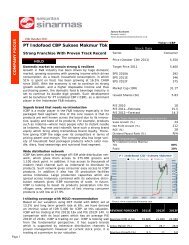
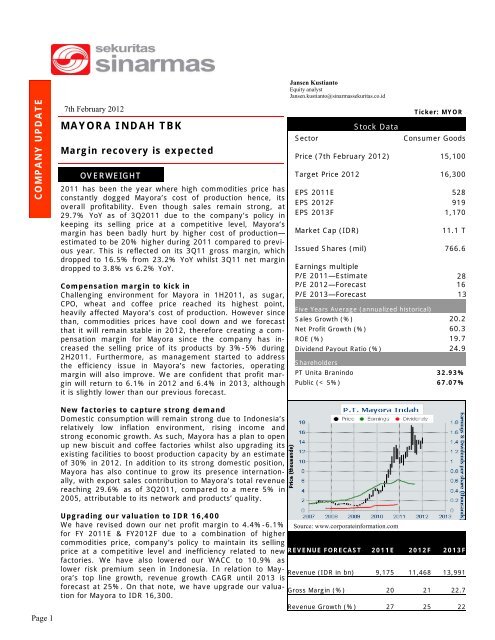
COMPANY UPDATE7th <strong>Feb</strong>ruary <strong>2012</strong>MAYORA INDAH TBKMargin recovery is expectedOVERWEIGHT2011 has been the year where high commodities price hasconstantly dogged <strong>Mayora</strong>’s cost of production hence, itsoverall profitability. Even though sales remain strong, at29.7% YoY as of 3Q2011 due to the company’s policy inkeeping its selling price at a competitive level, <strong>Mayora</strong>’smargin has been badly hurt by higher cost of production—estimated to be 20% higher during 2011 compared to previousyear. This is reflected on its 3Q11 gross margin, whichdropped to 16.5% from 23.2% YoY whilst 3Q11 net margindropped to 3.8% vs 6.2% YoY.Compensation margin to kick inChallenging environment for <strong>Mayora</strong> in 1H2011, as sugar,CPO, wheat and coffee price reached its highest point,heavily affected <strong>Mayora</strong>’s cost of production. However sincethan, commodities prices have cool down and we forecastthat it will remain stable in <strong>2012</strong>, therefore creating a compensationmargin for <strong>Mayora</strong> since the company has increasedthe selling price of its products by 3%-5% during2H2011. Furthermore, as management started to addressthe efficiency issue in <strong>Mayora</strong>’s new factories, operatingmargin will also improve. We are confident that profit marginwill return to 6.1% in <strong>2012</strong> and 6.4% in 2013, althoughit is slightly lower than our previous forecast.Jansen KustiantoEquity analystJansen.kustianto@sinarmassekuritas.co.idSectorStock DataConsumer GoodsPrice (7th <strong>Feb</strong>ruary <strong>2012</strong>) 15,100Target Price <strong>2012</strong> 16,300EPS 2011E 528EPS <strong>2012</strong>F 919EPS 2013F 1,170Market Cap (IDR)Ticker: MYOR11.1 TIssued Shares (mil) 766.6Earnings multipleP/E 2011—Estimate28P/E <strong>2012</strong>—Forecast 16P/E 2013—Forecast 13Five Years Average (annualized historical)Sales Growth (%) 20.2Net Profit Growth (%) 60.3ROE (%) 19.7Dividend Payout Ratio (%) 24.9Shareholders<strong>PT</strong> Unita Branindo 32.93%Public (< 5%) 67.07%New factories to capture strong demandDomestic consumption will remain strong due to Indonesia’srelatively low inflation environment, rising income andstrong economic growth. As such, <strong>Mayora</strong> has a plan to openup new biscuit and coffee factories whilst also upgrading itsexisting facilities to boost production capacity by an estimateof 30% in <strong>2012</strong>. In addition to its strong domestic position,<strong>Mayora</strong> has also continue to grow its presence internationally,with export sales contribution to <strong>Mayora</strong>’s total revenuereaching 29.6% as of 3Q2011, compared to a mere 5% in2005, attributable to its network and products’ quality.Page 1Upgrading our valuation to IDR 16,400We have revised down our net profit margin to 4.4%-6.1% Source: www.corporateinformation.comfor FY 2011E & FY<strong>2012</strong>F due to a combination of highercommodities price, company’s policy to maintain its sellingprice at a competitive level and inefficiency related to new REVENUE FORECASTfactories. We have also lowered our WACC to 10.9% aslower risk premium seen in Indonesia. In relation to <strong>Mayora</strong>’stop line growth, revenue growth CAGR until 2013 isRevenue (IDR in bn)forecast at 25%. On that note, we have upgrade our valuationfor <strong>Mayora</strong> to IDR 16,300.Gross Margin (%)2011E9,17520<strong>2012</strong>F11,468212013F13,99122.7Revenue Growth (%) 27 25 22
Commodities trend on <strong>Mayora</strong>’s main raw materials show declining trend since 1H2011:COMPANY UPDATECrude palm oil:1,400.001,200.001,000.00800.00600.00400.00200.000.00Jan- 11 F eb - 11 M ar-11 A p r - 11 M ay- 11 Jun- 11 Jul - 11 A ug - 11 Sep - 11 Oct - 11 N o v- 11 D ec- 11Sugar:<strong>Mayora</strong> Indah Tbk$35302520151050Wheat:($)40035030025020015010 0500Dec-10 Jan-11 <strong>Feb</strong>-11 Mar-11 Apr-11 May-11 Jun-11Jul-11 Aug-11 Sep-11 Oct-11 Nov-11 Dec-11Jan- 11 F eb - 11 M ar - 11 A p r - 11 M ay- 11 Jun- 11 Jul - 11 A ug - 11 Sep - 11 O ct - 11 N o v- 11 D ec- 11Coffee13 012 512 0115($)11010 510 095Jan- 11 F eb - 11 M ar - 11 A p r - 11 M ay- 11 Jun- 11 Jul- 11 A ug - 11 Sep - 11 Oct - 11 N o v- 11 D ec- 11Page 2Source: World Bank
COMPANY UPDATEFiscal Year End 2009 2010 2011E <strong>2012</strong>F 2013FIncome Statement (bn)Sales Revenue 4,777 7,224 9,175 11,468 13,991Cost of Goods Sold (3,643) (5,518) (7,340) (9,060) (10,815)Gross Profit 1,134 1,706 1,835 2,408 3,176Operating Expenses (520) (933) (1,101) (1,262) (1,763)Operating Income 614 773 734 1,147 1,413EPS 485Net Interest Income (Expenses) (99) (88) (166) (136) (132)Other Income (Expenses) (11) (27) 13 (12) (12)Income Before Tax 504 658 581 999 1,269Income Tax Expense (122) (159) (158) (271) (345)Minority Interest (10) (16) (18) (23) (28)Net Income 372 484 405 705 897Balance Sheet (bn)<strong>Mayora</strong> Indah TbkCash & Cash Equivalents 334 472 334 185 157Account Receivables 858 1,295 1,624 2,053 2,448Inventories 459 498 826 826 1,063Other Current Assets 100 420 229 275 392Net Fixed Assets 1,283 1,490 2,120 2,540 2,986Total Non-Current Assets 1,496 1,714 2,670 3,056 3,545Total Assets 3,247 4,399 5,683 6,395 7,606Current Liabilities 764 1,040 1,571 1,569 2,065Long-Term Liabilities 859 1,319 1,775 1,867 1,840Total Liabilities 1,623 2,359 3,346 3,436 3,905Shareholder's Equity 1,623 2,040 2,337 2,960 3,701Minority Interest 41 49 67 90 118Total Equity & Liabilities 3,246 4,399 5,683 6,395 7,606Cash Flow (bn)Operating Cash flow 467 248 150 803 793Net Capex (229) (396) (689) (642) (718)Other Investing Items (124) 14 (326) 34 (44)Free Cash Flow 238 (134) (865) 195 31Dividends paid (38) (85) (126) (105) (183)Other financing items (40) 369 852 (238) 123Net Cash Flow 36 150 (138) (148) (29)KEY RATIOSales Growth (%) 22 51 27 25 22EPS Growth (%) 89 30 -16 74 27Operating Margin (%) 12.9 10.7 8 10 10Payout Ratio (%) 19.5 23 25 25 25Acid-Test Ratio (%) 1.5 1.7 1.2 1.4 1.3ROE (%) 25.7 26.4 18.5 26.6 26.9P/E 22.2 23 28 16 13P/BV 3.7 5.5 4.8 3.8 3ROA (%) 12.1 12.7 8 11.7 12.8Page 3
Historical recommendation & valuation: <strong>PT</strong> <strong>Mayora</strong> Indah TbkCOMPANY UPDATEDate Coverage Recommendation Valuation14/7/2010 Initiation Buy 8,90031/12/2010 Update Buy 13,4004/2/<strong>2012</strong> Update Overweight 16,300DISCLAIMER :This material is issued by <strong>PT</strong> <strong>Sinarmas</strong> <strong>Sekuritas</strong>, a member of the Jakarta and Surabaya Stock Exchanges,represent the opinion of <strong>PT</strong> <strong>Sinarmas</strong> <strong>Sekuritas</strong>, derived its judgment from sources deemed reliable, however,<strong>PT</strong> <strong>Sinarmas</strong> <strong>Sekuritas</strong> and its affiliated cannot guarantee its accuracy and completeness. <strong>PT</strong> <strong>Sinarmas</strong> <strong>Sekuritas</strong>or its affiliates may be involved in transactions contrary to any opinion herein or have positions in the securitiesrecommended herein and may seek or will seek investment banking or other business relationships with thecompanies in this material. <strong>PT</strong> <strong>Sinarmas</strong> <strong>Sekuritas</strong>, its employees and its affiliates, expressly disclaim any andall liability for representation or warranties, expressed or implied, here in or omission there from or for any losshow so ever arising from any use of this material or its contents or otherwise arising in connection there with.Opinion expressed in this material are our present view and are subject to change without notice.<strong>Mayora</strong> Indah TbkPage 4