PT A STRA O TOPAR T S Tbk COMP A NY UPD ATE - Sinarmas ...
PT A STRA O TOPAR T S Tbk COMP A NY UPD ATE - Sinarmas ...
PT A STRA O TOPAR T S Tbk COMP A NY UPD ATE - Sinarmas ...

You also want an ePaper? Increase the reach of your titles
YUMPU automatically turns print PDFs into web optimized ePapers that Google loves.
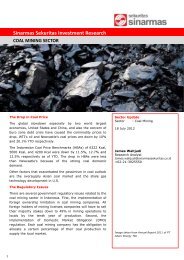
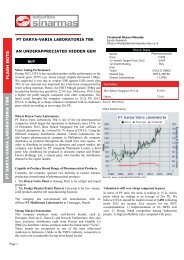
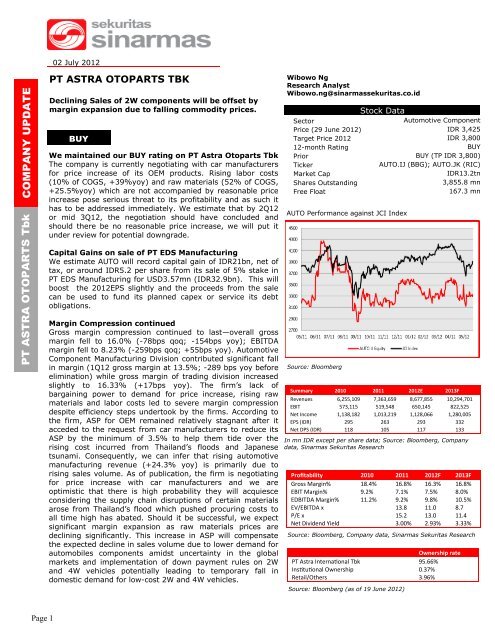
<strong>PT</strong> A<strong>STRA</strong> O<strong>TOPAR</strong>TS <strong>Tbk</strong><strong>COMP</strong>A<strong>NY</strong> <strong>UPD</strong><strong>ATE</strong>02 July 2012<strong>PT</strong> A<strong>STRA</strong> O<strong>TOPAR</strong>TS TBKDeclining Sales of 2W components will be offset bymargin expansion due to falling commodity prices.BUYWe maintained our BUY rating on <strong>PT</strong> Astra Otoparts <strong>Tbk</strong>The company is currently negotiating with car manufacturersfor price increase of its OEM products. Rising labor costs(10% of COGS, +39%yoy) and raw materials (52% of COGS,+25.5%yoy) which are not accompanied by reasonable priceincrease pose serious threat to its profitability and as such ithas to be addressed immediately. We estimate that by 2Q12or mid 3Q12, the negotiation should have concluded andshould there be no reasonable price increase, we will put itunder review for potential downgrade.Wibowo NgResearch AnalystWibowo.ng@sinarmassekuritas.co.idStock DataSectorAutomotive ComponentPrice (29 June 2012) IDR 3,425Target Price 2012 IDR 3,80012-month RatingBUYPrior BUY (TP IDR 3,800)TickerAUTO.IJ (BBG); AUTO.JK (RIC)Market CapIDR13.2tnShares Outstanding3,855.8 mnFree Float167.3 mnAUTO Performance against JCI IndexCapital Gains on sale of <strong>PT</strong> EDS ManufacturingWe estimate AUTO will record capital gain of IDR21bn, net oftax, or around IDR5.2 per share from its sale of 5% stake in<strong>PT</strong> EDS Manufacturing for USD3.57mn (IDR32.9bn). This willboost the 2012EPS slightly and the proceeds from the salecan be used to fund its planned capex or service its debtobligations.Margin Compression continuedGross margin compression continued to last—overall grossmargin fell to 16.0% (-78bps qoq; -154bps yoy); EBITDAmargin fell to 8.23% (-259bps qoq; +55bps yoy). AutomotiveComponent Manufacturing Division contributed significant fallin margin (1Q12 gross margin at 13.5%; -289 bps yoy beforeelimination) while gross margin of trading division increasedslightly to 16.33% (+17bps yoy). The firm’s lack ofbargaining power to demand for price increase, rising rawmaterials and labor costs led to severe margin compressiondespite efficiency steps undertook by the firms. According tothe firm, ASP for OEM remained relatively stagnant after itacceded to the request from car manufacturers to reduce itsASP by the minimum of 3.5% to help them tide over therising cost incurred from Thailand’s floods and Japanesetsunami. Consequently, we can infer that rising automotivemanufacturing revenue (+24.3% yoy) is primarily due torising sales volume. As of publication, the firm is negotiatingfor price increase with car manufacturers and we areoptimistic that there is high probability they will acquiesceconsidering the supply chain disruptions of certain materialsarose from Thailand’s flood which pushed procuring costs toall time high has abated. Should it be successful, we expectsignificant margin expansion as raw materials prices aredeclining significantly. This increase in ASP will compensatethe expected decline in sales volume due to lower demand forautomobiles components amidst uncertainty in the globalmarkets and implementation of down payment rules on 2Wand 4W vehicles potentially leading to temporary fall indomestic demand for low-cost 2W and 4W vehicles.Source: BloombergSummary 2010 2011 2012E 2013FRevenues 6,255,109 7,363,659 8,677,855 10,294,701EBIT 573,115 519,548 650,145 822,525Net Income 1,138,182 1,013,219 1,128,066 1,280,005EPS (IDR) 295 263 293 332Net DPS (IDR) 118 105 117 133In mn IDR except per share data; Source: Bloomberg, Companydata, <strong>Sinarmas</strong> Sekuritas ResearchProfitability 2010 2011 2012F 2013FGross Margin% 18.4% 16.8% 16.3% 16.8%EBIT Margin% 9.2% 7.1% 7.5% 8.0%EDBITDA Margin% 11.2% 9.2% 9.8% 10.5%EV/EBITDA x 13.8 11.0 8.7P/E x 15.2 13.0 11.4Net Dividend Yield 3.00% 2.93% 3.33%Source: Bloomberg, Company data, <strong>Sinarmas</strong> Sekuritas ResearchOwnership rate<strong>PT</strong> Astra International <strong>Tbk</strong> 95.66%Institutional Ownership 0.37%Retail/Others 3.96%Source: Bloomberg (as of 19 June 2012)Page 1
<strong>PT</strong> A<strong>STRA</strong> O<strong>TOPAR</strong>TS <strong>Tbk</strong> <strong>COMP</strong>A<strong>NY</strong> <strong>UPD</strong><strong>ATE</strong>Joint-Ventures to boost Products Offerings.AUTO signed a joint-venture agreement with the prominent Italian tyre manufacturer, Pirelli & C. SpA, to establish anew 40 Ha tyre-manufacturing facility in Karawang under <strong>PT</strong> Evoluzione Tyres. AUTO will own 40% of the sharesand it is expected to begin operation in 2Q13. By 2Q14, <strong>PT</strong> Evoluzione Tyres is forecast to produce 2 mn units ofconventional 2W tyres p.a. and by 2016, the firms expect operations at full capacity (7mn units of conventional 2Wtyres p.a. with 3mn units will be marketed under Astra’s own brand, Aspira, while the remaining 4 mn units will bemarketed under Pirelli and these are most likely for OEM or export purposes). AUTO’s partnership with Pirelli willboost the brand equity of its Aspira in the local markets and it is no longer required to outsource its tyre production.Furthermore, AUTO is able to leverage on its parent’s vast and diverse businesses and source its rubber from itssister company, <strong>PT</strong> Astra Agro Lestari <strong>Tbk</strong> (AALI), ensuring constant supply of rubber. Availability of its own tyreproduction plant will allow AUTO to manage its product quality and boost its product portfolio offeringcomprehensive portfolio to car manufacturers—one-stop-order.Automotive Outlook—Fall in demand for 2W and 4W post implementation of new DP regulationWe downgrade the domestic sales of 2W vehicles to 7.4 mn units on the backdrop of sub-par 5M2012 sales (3.16mn; -6.97% yoy) and highly negative outlook post-implementation of 25% minimum down payment (DP). Lowerincome segment represents significant percentage of 2W-vehicles buyer and they tend to purchase on credit withlow or even 0% DP. This regulation will lower demand temporarily as they need to save at least 25% of thepurchase price. However, considering the fact that 2W-vehicles are basic necessity in core cities in Indonesia, weforesee that the drop will be temporary but the outlook remains negative as lower replacement rate leading toslower growth is expected. Furthermore, the high inflationary pressure will dent sentiment as allocation on food andother basic necessities will trump savings for automotive.5M12 sales of domestic 4W-vehicles grew 24.7% yoy to 433,421 units and this was due to people taking advantageof lower DP by purchasing car on credit prior to 15th of June 2012. Despite the sterling 5M12 sales performance, weare less rosy on the future and thus we lower our estimate of annual 4W domestic sales to 890k (with 5M12 salesrepresented 48.7%) from our previous 900k (5M12 sales: 48.2%). MPV with CC
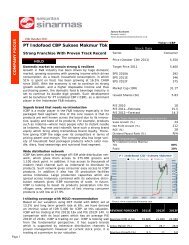
<strong>PT</strong> A<strong>STRA</strong> O<strong>TOPAR</strong>TS <strong>Tbk</strong> <strong>COMP</strong>A<strong>NY</strong> <strong>UPD</strong><strong>ATE</strong>Chart 2: Domestic 4W-vehicles Sales—2012 sales isexpected to remain stagnant post implementation ofminimum DP.1 Day Change 1 Month Change YTD Change Change from YTD High 1 Year ChangeBrent Crude Oil -1.27% -1.90% -10.08% -23.50% -13.61%Polyethylene -0.35% 0.87% 8.43% -6.99% -3.20%Copper 0.86% -2.21% -0.38% -8.99% -19.59%Lead 4.83% -4.32% -8.29% -19.81% -29.54%Aluminum 0.62% -2.94% -2.85% -4.08% -9.39%Rubber 2.67% -6.92% -2.22% -25.42% -34.68%Tin 1.46% -7.06% -1.93% -26.18% -27.14%Hot-Rolled Coil Steel 0.00% -9.37% -17.24% -18.14% -17.24%WTI Crude Oil -1.12% 0.94% -15.00% -23.47% -11.51%Steel 2.86% 6.27% 0.32% -1.74% -13.74%Source: Bloomberg (as of 02 July 2012)Chart 3: 4W-Vehicles sales volume rose by 25% in 5M12 vs5M11—Increase was expected as people tend to takeadvantage of the low DP prior to the implementation.Source: Gaikindo, <strong>Sinarmas</strong> Sekuritas ResearchSource: GaikindoChart 4: Domestic 2W-vehicles Sales—new regulation willsignificantly impact the performance of 2W-vehicles salesChart 5: Disappointing 5M2011 2W-vehicles Sales will dragdown overall annual performance leading us to downgradeour estimate on 2012 2W-vehicles sales due to bleak nextHalf of 2012.Source: AISI, <strong>Sinarmas</strong> Sekurtias ResearchSource: AISIPage 3
Chart 6: WTI Crude Oil (USD/barrel)Chart 7: Brent Crude Oil (USD/barrel)<strong>PT</strong> A<strong>STRA</strong> O<strong>TOPAR</strong>TS <strong>Tbk</strong> <strong>COMP</strong>A<strong>NY</strong> <strong>UPD</strong><strong>ATE</strong>Source: BloombergChart 8: Rubber (JPY/kg) - Pressure on rubber prices soaredamidst expected rising surplus of 402kT in 2H12 vs 134kTdeficit in 1H12 and slowing Chinese economy.Source: BloombergChart 9: Polyethylene (C<strong>NY</strong>/T)Source: BloombergSource: BloombergChart 9: Copper (C<strong>NY</strong>/T)Chart 10: Aluminum (C<strong>NY</strong>/T)Source: BloombergSource: BloombergPage 4
Chart 11: Tin (USD/T)Chart 12: Lead (USD/T)<strong>PT</strong> A<strong>STRA</strong> O<strong>TOPAR</strong>TS <strong>Tbk</strong> <strong>COMP</strong>A<strong>NY</strong> <strong>UPD</strong><strong>ATE</strong>Source: BloombergChart 13: Hot-Rolled Coil Steel (USD/T)Source: BloombergChart 14: Steel (USD/T)Source: BloombergChart 15: Margin Comparison-we are concerned withAUTO’s lack of bargaining power and should it fail todemand for price increase, margin will deteriorate furtherthreatening its overall profitability.Source: BloombergChart 16: Revenue Breakdown-the low marginmanufacturing will still dominate while the firmexpands its trading and retails division throughexpansion of ‘Shop & Drive’.Source: Company data, <strong>Sinarmas</strong> Sekuritas ResearchSource: BloombergPage 5
<strong>PT</strong> A<strong>STRA</strong> O<strong>TOPAR</strong>TS <strong>Tbk</strong> <strong>COMP</strong>A<strong>NY</strong> <strong>UPD</strong><strong>ATE</strong>Table 2: Income Statement Summary2009 2010 2011 2012E 2013F 2014F 2015FRevenues 5,265,798 6,255,109 7,363,659 8,677,855 10,294,701 12,432,417 14,918,900Cost of Revenue 4,317,181 5,102,483 6,126,058 7,263,364 8,565,191 10,343,771 12,397,606Gross Profit 948,617 1,152,626 1,237,601 1,414,490 1,729,510 2,088,646 2,521,294SG&A 508,626 579,511 718,053 764,345 906,984 1,074,171 1,284,321EBIT 439,991 573,115 519,548 650,145 822,525 1,014,475 1,236,973Other non-operating income 56,242 32,108 38,090 46,000 55,200 65,173 76,981interest, net -14,493 -109,038 -133,693 -132,607 -107,972 -102,242 -74,402Equity linked, net income 509,774 761,161 693,786 793,535 872,888 977,635 1,094,951Profit before tax 967,001 1,391,264 1,255,083 1,394,447 1,599,811 1,905,502 2,279,152Taxation -137,046 -168,956 -153,500 -162,246 -196,269 -250,524 -319,734Profit after tax 829,955 1,222,308 1,101,583 1,232,200 1,403,541 1,654,978 1,959,418Minorities -41,690 -84,126 -88,364 -104,134 -123,536 -149,189 -179,027Net Profit 788,265 1,138,182 1,013,219 1,128,066 1,280,005 1,505,789 1,780,391Gross Margin 18.01% 18.43% 16.81% 16.30% 16.80% 16.80% 16.90%EBITDA margin 10.14% 11.19% 9.20% 9.79% 10.49% 10.66% 10.79%EBIT Margin 8.36% 9.16% 7.06% 7.49% 7.99% 8.16% 8.29%NOPAT Margin 5.85% 6.71% 5.13% 5.47% 5.83% 0.00% 0.00%Net Margin 5.29% 6.03% 4.34% 3.86% 3.95% 4.25% 4.59%Revenue Growth -1.35% 18.79% 17.72% 17.85% 18.63% 20.77% 20.00%EBITDA Growth 0.35% 31.07% -3.22% 25.46% 27.09% 22.72% 21.48%EBIT Growth -2.63% 30.26% -9.35% 25.14% 26.51% 23.34% 21.93%Net Profit Growth 39.26% 44.39% -10.98% 11.33% 13.47% 17.64% 18.24%Source: Company data, <strong>Sinarmas</strong> SekuritasChart 17: Net Income in Jointly Controlled Entities—overallremained stagnant with new investments registering netloss. We foresee <strong>PT</strong> Evoluzione Tyres will registersignificant loss too in the coming quarter due to the sheersize of investment.Chart 18: Net Income in Jointly Controlled Entities (yoygrowth) - Negative growth for some entities were due tomargin squeeze and increase in ASP will alleviate this problem.Source: Company dataSource: Company dataPage 6
<strong>PT</strong> A<strong>STRA</strong> O<strong>TOPAR</strong>TS <strong>Tbk</strong> <strong>COMP</strong>A<strong>NY</strong> <strong>UPD</strong><strong>ATE</strong>Fiscal Year EndIncome Statement (IDR mn) 2010 2011 2012E 2013F 2014F 2015FSales Revenue 6,255,109 7,363,659 8,677,855 10,294,701 12,432,417 14,918,900Gross Profit 1,152,626 1,237,601 1,414,490 1,729,510 2,088,646 2,521,294Operating Income 573,115 519,548 650,145 822,525 1,014,475 1,236,973Depreciation & Amortization 2,952,125 2,952,126 2,952,127 2,952,128 2,952,129 2,952,130EBITDA 699,832 677,293 849,736 1,079,893 1,325,285 1,609,946Other non-operating income 32,108 38,090 46,000 55,200 65,173 76,981Net Interest Income (expense) -109,038 -133,693 -132,607 -107,972 -102,242 -74,402Equity linked, net income 761,161 693,786 793,535 872,888 977,635 1,094,951Profit before tax 1,391,264 1,255,083 1,394,447 1,599,811 1,905,502 2,279,152Tax expenses -168,956 -153,500 -162,246 -196,269 -250,524 -319,734Profit after tax 1,222,308 1,101,583 1,232,200 1,403,541 1,654,978 1,959,418Minority Interests -84,126 -88,364 -104,134 -123,536 -149,189 -179,027Net Profit 1,138,182 1,013,219 1,128,066 1,280,005 1,505,789 1,780,391Cash Flow (IDR mn)Operating Cash Flow 399,127 258,576 778,898 829,302 772,917 1,136,989Capex 409,006 773,467 1,232,300 1,029,470 497,297 372,973Investments in Associates & Jointly ControlledEntities0 64,405 450,000 100,000 0 0Free Cash Flow -9,879 -579,296 -903,402 -300,168 275,621 764,016Dividends Received from Investments 223,250 441,016 353,929 389,322 428,255 471,080Dividends Paid 456,525 488,202 451,226 512,002 602,316 712,156Debt Issuance (redemption) -20,552 561,321 1,189,572 336,569 129,391 -161,621Net debt (cash) -203,122 365,399 554,272 467,994 698,945 1,060,263Balance Sheet (IDR mn)Cash & cash equivalents 485,564 365,399 554,272 467,994 698,945 1,060,263Account Receivables 849,087 1,017,494 1,193,424 1,412,829 1,714,823 2,062,114Inventories 708,322 955,369 1,117,441 1,259,587 1,521,143 1,823,177Other Current assets 156,752 226,193 246,568 294,215 361,384 442,258Net fixed assets 985,029 1,547,831 2,544,521 3,330,203 3,505,174 3,503,235Investment in Jointly Controlled Entities 2,154,640 2,475,031 2,722,534 2,994,788 3,294,266 3,623,693Other non-current assets 246,458 376,910 893,481 875,381 1,240,727 1,151,272Total Assets 5,585,852 6,964,227 9,272,241 10,634,996 12,336,462 13,666,013Short term Liabilities 1,251,731 1,892,818 3,179,937 3,533,344 4,078,385 4,266,087Long term Liabilities 230,974 348,515 633,483 802,987 969,729 939,891Total Liabilities 1,482,705 2,241,333 3,813,420 4,336,331 5,048,114 5,205,978Shareholders’ Equity 3,860,827 4,423,554 5,099,613 5,867,616 6,771,089 7,839,324Minority Interest 242,320 299,340 359,208 431,050 517,260 620,711Total Equity & Liabilities 5,585,852 6,964,227 9,272,241 10,634,996 12,336,462 13,666,013Key RatioRevenue Growth (%) 18.8% 17.7% 17.8% 18.6% 20.8% 20.0%EPS Growth (%) 44.4% -11.0% 11.3% 13.5% 17.6% 18.2%EBITDA Margin (%) 11.2% 9.2% 9.8% 10.5% 10.7% 10.8%Payout Ratio (%) 40.1% 40.0% 40.0% 40.0% 40.0% 40.0%ROE (%) 29.5% 22.9% 22.1% 21.8% 22.2% 22.7%Quick Ratio (×) 1.19 0.85 0.63 0.62 0.68 0.84Debt/Equity (%) 0.07 0.20 0.41 0.41 0.38 0.30*: Adjusted for stock splitPage 7
<strong>PT</strong> A<strong>STRA</strong> O<strong>TOPAR</strong>TS <strong>Tbk</strong> <strong>COMP</strong>A<strong>NY</strong> <strong>UPD</strong><strong>ATE</strong>AppendixDown Payment RegulationAccording to the data from Gaikindo, prior to the implementation of down payment regulation in June 2012,around 75% of 4W purchases via auto-loan (from January-September 2011) were transacted with DP of morethan 20% indicating that even before the implementation, auto-finance companies have exercised extremeprudence by requiring customers to have higher DP. However, we are more concerned with 2W-vehicles asstatistics showed that only 36.3% of transactions via auto-loan were done with DP higher than 20% and sales of2W-vehiclels will be seriously impacted by the regulation.However, the silver lining will be lower interest payment on the loan which will encourage savings and/orspendings. With the higher down payment, auto-finance companies are no longer able to demand stratosphericinterest rate, as opposed to interest rate charged on customer with dubious credit worthiness who purchased 2W-vehicles with low or near zero DP.Chart 19: Breakdown of Down Payment on 4W vehicles purchased viaauto-financing.30%44.1%32.6%13.7%8.4%0.3%0.8%Source: Gaikindo, Bisnis Indonesia.Page 8
<strong>PT</strong> A<strong>STRA</strong> O<strong>TOPAR</strong>TS <strong>Tbk</strong> <strong>COMP</strong>A<strong>NY</strong> <strong>UPD</strong><strong>ATE</strong>DISCLAIMERThis report has been prepared by <strong>PT</strong> <strong>Sinarmas</strong> Sekuritas, an affiliate of <strong>Sinarmas</strong> Group.This material is: (i) created based on information that we consider reliable, but we do not represent that it is accurate orcomplete, and it should not be relied upon as such; (ii) for your private information, and we are not soliciting any action basedupon it; (iii) not to be construed as an offer to sell or a solicitation of an offer to buy any security.Opinions expressed are current opinions as of original publication date appearing on this material and the information, includingthe opinions contained herein, is subjected to change without notice. The analysis contained herein is based on numerousassumptions. Different assumptions could result in materially different results. The analyst(s) responsible for the preparation ofthis publication may interact with trading desk personnel, sales personnel and other constituencies for the purpose ofgathering, integrating and interpreting market information. Research will initiate, update and cease coverage solely at thediscretion of <strong>Sinarmas</strong> Research department. If and as applicable, <strong>Sinarmas</strong> Sekuritas’ investment banking relationships,investment banking and non-investment banking compensation and securities ownership, if any, are specified in disclaimersand related disclosures in this report. In addition, other members of <strong>Sinarmas</strong> Group may from time to time performinvestment banking or other services (including acting as advisor, manager or lender) for, or solicit investment banking orother business from companies under our research coverage. Further, the <strong>Sinarmas</strong> Group, and/or its officers, directors andemployees, including persons, without limitation, involved in the preparation or issuance of this material may, to the extentpermitted by law and/or regulation, have long or short positions in, and buy or sell, the securities (including ownership by<strong>Sinarmas</strong> Group), or derivatives (including options) thereof, of companies under our coverage, or related securities orderivatives. In addition, the <strong>Sinarmas</strong> Group, including <strong>Sinarmas</strong> Sekuritas, may act as market maker and principal, willing tobuy and sell certain of the securities of companies under our coverage. Further, the <strong>Sinarmas</strong> Group may buy and sell certainof the securities of companies under our coverage, as agent for its clients.Investors should consider this report as only a single factor in making their investment decision and, as such, the report shouldnot be viewed as identifying or suggesting all risks, direct or indirect, that may be associated with any investment decision.Recipients should not regard this report as substitute for exercise of their own judgment. Past performance is not necessarily aguide to future performance. The value of any investments may go down as well as up and you may not get back the fullamount invested.<strong>Sinarmas</strong> Sekuritas specifically prohibits the redistribution of this material in whole or in part without the written permission of<strong>Sinarmas</strong> Sekuritas and <strong>Sinarmas</strong> Sekuritas accepts no liability whatsoever for the actions of third parties in this respect. Ifpublication has been distributed by electronic transmission, such as e-mail, then such transmission cannot be guaranteed to besecure or error-free as information could be intercepted, corrupted, lost, destroyed, arrive late or incomplete, or containviruses. The sender therefore does not accept liability for any errors or omissions in the contents of this publication, which mayarise as a result of electronic transmission. If verification is required, please request a hard-copy version.Additional information is available upon request.Images may depict objects or elements which are protected by third party copyright, trademarks and other intellectualproperties.©<strong>Sinarmas</strong> Sekuritas(2012). All rights reserved.Page 9